VOLUME 16 ISSUE 1 (2018), Page 381 – 396
INCOME TARGETS AND POVERTY OF RUBBER SMALLHOLDERS IN FOUR STATES OF MALAYSIA
Siti Murni Wee Jamil Wee1 & Kuppusamy Singaravelloo2
1,2Faculty of Economics and Administration
UNIVERSITI MALAYA, MALAYSIA
Abstract
Both rubber and oil have contributed significantly to Malaysia’s revenues and job creations especially for those in the rural areas. Malaysia now stands at third after Thailand and Indonesia in natural rubber production. However, the country’s natural rubber productivity began to decline since late 2011 and would probably deteriorate through 2016 as consumption growth weakens in China – the largest importer, curbing prices of the raw material used in everything from tyre to medical gloves and condoms. The declining rubber price has moved the smallholders who mostly live in rural areas into serious poverty. This has led the smallholders, who sustain latex production, to suffer and find alternative jobs to sustain. This has dampened the government’s intention to ensure smallholders earn at least RM2,500 per month by 2015 and further to RM4,000 by 2020. The key objectives of this paper are to determine the poverty level, whether this policy has been met, and the impact of the reducing price of the commodity on the smallholders’ spending patterns. The study finds a large proportion of this group fall into the hardcore poverty category, which deviates very much from the national poverty levels pronounced by the government. More needs to be done to assist this impoverished group.
INTRODUCTION
The Malaysian rubber industry has successfully established itself as the third largest producer of natural rubber in the world. The industry produces a broad range of products from natural rubber as well as rubber wood products with superior quality and is widely used as a benchmark in the international market. Malaysia also remains as the world largest exporter of natural rubber medical gloves, catheters and latex thread. From the finished rubber products, rubber gloves are one of Malaysia’s biggest export product. It is estimated that over 60 percent of the rubber gloves in the international market is produced by Malaysia. As reported by the Department of Statistics Malaysia (2015), Malaysia has invested heavily in research and development (R&D) in the rubber industry in order to develop innovations and identify new uses for rubber.
Growth in agricultural productivity is a requisite to sustain current and future economic development. An increase in the agricultural productivity can lead to an increase in income, alleviate poverty and improve the standard of living of those in the rural area. Malaysia started its agrarian reforms under the First Malaysian Plan (1966-1970), which implemented land development, regional development, agricultural research and development schemes on commodities policies (Pazim, 2003). Land development programs are carried out through the opening of new land schemes and in-situ programs such as land rehabilitation and consolidation, replanting schemes, modern irrigation schemes and integrated agricultural projects. Regional development emphasizing on balanced development between rural and urban areas was implemented by means of locating small-scale industries in modern agricultural areas. In support of this, agricultural research is carried out by institutions such as Malaysian Agricultural Research and Development (MARDI), Rubber Research Institute of Malaysia (RRIM), Forest Research Institute of Malaysia (FRIM) as well as local universities. Besides involved in research, these agencies also disseminate their findings to farmers through extended and support services.
For rubber industries itself, Rubber Industry Smallholders’ Development Authority (RISDA) was established on 1st January 1973 under the Ministry of Rural and Regional Development to address the plight of the smallholders. Besides that Malaysia Rubber Board (MRB) under Ministry of Plantation Industries and Commodities (MPIC) was established as a statutory authority responsible to manage the rubber industry in Malaysia.
utilisation of agricultural resources (Ministry of Agriculture & Agro-Based Industry Malaysia, 2012).
In the commodity sector, the implementation of National Commodities Policy (NCP) in 2011 by the Ministry of Plantation Industries and Commodities (MPIC) has formulated strategies to strengthen the role and contribution of the plantation and commodities industries to the economy. The NCP targets the transformation of the commodities industry to a dynamic and competitive sector by 2020. The NCP’s formulation takes into account the industries’ orientation towards market requirements and the potential of wealth creation through the production of high value-added products (Ministry of Plantation Industries and
Commodities, 2012). Policies supporting natural rubber in the last decade saw
areas planted with rubber increase from 1.39 million hectares to 1.63 million hectares by 2014 (RISDA, 2013). Rubber cultivation from total planted areas attributed to 16.8 percent in 2011 and decreased to 16.3 percent in 2014 due to greater growth in areas planted with oil palm.
Malaysia’s policy against poverty first took a clear and coordinated shape with the introduction of the New Economic Policy (NEP) in 1970. It was designed to be an integral part of the NEP, thereby underscoring its importance to overall national development. When the National Development Policy (NDP) was introduced in 1991 to replace the NEP, some adjustments were made to the poverty reduction policy but its basic features remained. Similarly, Vision 2020, which was formulated at about the same time as the NDP, gave strong emphasis on poverty eradication. However, the smallholder families have been pushed into poverty due to current volatility in the rubber prices, making things worse for many.
Generally, poverty is defined as the inability to meet basic needs as measured by income or consumption. Poverty and standard of living are inter-related. Poverty may be visible as shown by several indicators, such as lack of control over resources such as education, skills, shelter and access to basic utilities like water, electricity, and sanitation. Other aspects include poor health, malnutrition, vulnerability to shocks, violence and crime (Chamhuri Siwar & Norshamliza Chamhuri, 2008).
Ever since the early 1900s, poverty have been traditionally measured using an economic approach based on income and consumption levels. Over the last decades social scientists have criticised this approach and have produced an impressive amount of work presenting alternative definitions and ways of measuring poverty. However, much of the poverty indicators used to this day are still imbedded in this income/consumption paradigm, while fieldwork undertaken so far on alternative indicators have been primarily carried out in rural areas (Hasan, 2002).
under poverty; to analyse the impact of falling rubber prices on smallholders’ on household income; and to explore means at which the smallholder households are managing the decline in rubber prices and household income.
The study intends to verify smallholders’ income based on the current volatile price of rubber. Currently, almost all smallholders are low income earners of below RM800 (USD 195; 1 USD=RM4.10) per month and they live scattered in rural areas (RISDA, 2013). This study was conducted in four regions – southern and northern peninsula, Sabah and Sarawak.
LITERATURE REVIEW
According to Yeoh and Loh (2008), the main reason why China adopts developmental approach to poverty reduction in rural areas is related to the level of development of the rural economy. Compared to the urban areas, the level of development in the rural areas is relatively low. The urban-rural gap before and after the reforms has been widening. Dissanayake, Wasana Wijesuriya, Herath and Gunaratne (2013) refer to Sri Lanka’s issue of declining rubber prices that has affected the smallholders’ income. The smallholders continue to be farmers due mainly to their low educational attainment. We would relate three key theories to the issue in this paper. First, the supply and demand theory, second, growth pole theory, and finally the market efficiency theory.
Supply and Demand Theory explains the main concern in Malaysia’s natural rubber as fluctuation of market price that affects the demand, supply (productions), the quantity and the earnings from exports. Price is determined by the intersection of supply and demand. Barlow, Jayasuriya and Tan (1994) presented a broad economic framework for natural rubber industry. The expected rubber prices in the market, production capacity of natural rubber, input costs of natural rubber and the underlying technological progress are the determining factors for natural rubber supply. Meanwhile, income level in the overall economy, prices of rubber substitutes, price of final goods, technology, consumer preferences, stocks and manufacturing capacity utilising determine the demand for natural rubber. Both demand and supply actively correlate in setting natural rubber in market. Relating to the supply and demand theory, natural rubber supply depends on several factors such as mature rubber plantation area that are eligible for tapping, the number of tapping days and rubber prices in the market. Smallholders’ involvement depends on some of these. They will re-engage to tap rubber once the prices rise.
rubber sector to continuously develop natural rubber production and the low domestic productivity by introducing key programs to support mechanisation and incorporating Good Agricultural Practices (GAP) for the rubber industry smallholders.
Market Efficiency Theory can be used to relate rubber as an investment item and smallholders as the investors. This theory can be classified at historical, current or forecast of the rubber price. The more information available to the public on rubber price will better the situation for the smallholders to make informed decisions whether to tap or not. In a strong efficient market, the current market price will reflect all the relevant information. MRB published daily the world market price of rubber in the websites and reports. The report uses physical rubber prices and can be retrieved from MRB portal as well as from RISDA’s e-services portal which is open to the public.
METHODOLOGY
Smallholders are scattered across the country, especially in rural areas. A census by RISDA (2013) shows there were 283,683 smallholders who occupy 621,270 hectares of land cultivated with rubber (Table 1). Rubber smallholders comprise almost two-thirds of all smallholders in the country, and the land occupied for rubber is about 63 percent.
The agencies in charge of smallholders are RISDA in the peninsula, Sabah Rubber Industry Board (LIGS), and the Department of Agriculture Sarawak (JPS).
Table 1: Numbers and percentage of smallholders lot and land area cultivated for rubber and oil palm
Smallholders Percentage
Number Lot Land Area (Ha)
Number Lot Land Area (Ha)
Rubber 283,683 326,525 621,269.72 64.8 62.74 56.31 Oil
Palm
154,090 193,885 482,023.89 35.2 37.26 43.69
Total 437,773 520,410 1,103,293.61 100.0 100.0 100.0
Source: RISDA (2013), p.19.
The sessions with the smallholder respondents were held at different hours and venues accordingly in groups of 20 to 35 respondents each.
A survey questionnaire was used but face-to-face interview sessions was done as almost all of the respondents were from rural areas and required deliberation for better understanding of the questions posed. Other than interviewing, data from research papers, statistical reports, and government publications are a part of the secondary sources of data.
401 respondents participated in the survey. 77 respondents were from Negeri Sembilan, 119 were from Perak, 102 were from Sarawak and 103 were from Sabah. The interviews were held at UMNO Youth Operations Centre, Kg Ketior Dalam, Kuala Kangsar, Perak; RISDA Office, Stesen Manong, Kuala Kangsar, Perak; Kg Ulu Inas Community Centre, and Air Mawang Community Centre, both at Johol, Negeri Sembilan. In Sabah and Sarawak, the officers from LIGS and JPS assisted in conducting the interviews on the field. Interviews were carried out with the help of the officers. The respondents were approached house to house. This include the disabled respondents, especially in the peninsula.
A pilot test was conducted at Kuala Pilah, Negeri Sembilan with the assistance of RISDA’s District Officer on 24 January 2016 at 9.00 a.m. Twelve respondents gathered at the Air Mawang Community Centre, Johol. However according to the respondents, the interviews were best held around 11.00 am or after 2.00 pm, as they need to attend to the farms early in the morning and would be back by 10.30 a.m. Most of the respondents were from rural areas and were over 50 years of age. The interviews were face-to-face in order to ensure the questions were answered well and accurately. As the respondents were about 50 years of age and the questions raised were sensitive – such as ownership of land and its size, children’s contribution, and monthly income and expenditure matters – these were conveyed in an utmost polite manner. These were followed through by the actual study in February 2016.
The questionnaire comprised of four sections: respondent’s background; occupational details; monthly income and expenditure patterns; and issues on market rubber price and how they manage it. In addition, there was a table for details of family demography to examine the household size, educational levels, occupation, incomes, and income sharing with the head of household.
Secondary data was obtained from the Malaysian Rubber Board, while Natural Rubber Statistics published is confined from year 2012 to mid-2015.
RESULTS AND DISCUSSION
Table 2 shows the demographic distributions of the respondents. The demographic aspects covered respondent age, gender, ethnicity, health status, marriage status, number of children and number of dependents living in the same residential unit. The proportion of respondents who attended primary and secondary schooling was more than 85%, showing majority of the respondents had basic literacy. Less than 10% of the respondents had not attended school, and about two-thirds of the respondents were 50 years or above in age. 71% of the respondents were male and majority of the respondents were either Malays (47.9%) or “Others” (50.6%). The former were mostly Bumiputera respondents in the peninsular while the latter were mostly indigenous Bumiputera groups at
Sabah and Sarawak, namely Iban, Kadazan, Dusun, Bajau, Bugis and Rungus.
84% of the respondents were married and 9.5% were single mothers. 83.6% of the respondents had six children or less. The average number of children was three while the mode is two. Majority of the dependents were staying with them. In terms of health, 93% of the respondents declared themselves as healthy. Only 1% of them were disabled but were still able to work. Those who were unhealthy comprise 5.5%. Amazingly, it was found that, despite their age, these respondents still go to the farms to earn their living.
Figure 1 describes smallholder respondents’ occupation at the four states. Distribution of jobs showed that the respondents were working as rubber tappers, oil palm planters, civil servants, private sector employees, rearing livestock, self-employed, farmers, or being fishermen. Additionally, the respondents tend to supplement their income with handicraft, lawn-moving, manning durian orchards, planting black pepper or are drivers. There were also some respondents who were unable to work due to old age or health issues. In addition, when the land was under replanting by RISDA, the smallholder had to look for other jobs while waiting for the tree to grow.
Data in Table 3 shows that a large proportion of the smallholders were rubber tappers in all states but least in Sarawak. At the latter, the difference was accounted for oil palm smallholding, livestock rearing, and farmers, more than their counterparts in the other three states. Some of the smallholders took up multiple jobs to sustain their families.
Table 2: Demographic background of participants
Demography Frequency Percentage
Age 21 - 35 36 - 50 50 and above
50 132 219
12.5 32.9 54.6 Ethnicity
Malay Chinese Indian
192 6 -
Others 203 50.6 Health Status
Healthy Unhealthy
Disabled, able to work Disabled, unable to work
374 22 4 1 93.3 5.5 1.0 0.2 Marriage Status Single Married Widow Single mother 21 336 6 38 5.2 83.8 1.5 9.5 No. of Children
None 1 - 3 4 - 6 7 - 9
10 and above
36 219 116 24 6 9.0 54.6 29.0 6.0 1.4 No. of Dependents
None 1 - 3 4 - 6 7 - 9
10 and above
33 183 152 29 4 8.2 45.7 37.9 7.2 1.0 Education Level None Primary Secondary
College /University
Table 3: Smallholders’ occupations by state Employment Status State All States Negeri
Sembilan Perak Sarawak Sabah
Rubber Smallholder 59.8 48.9 34.3 62.2 47.3 Oil Palm Smallholder 1.0 8.2 14.1 4.5 8.9 Public Sector Employee 6.2 3.8 0.0 1.3 2.0 Private Sector Employee 2.1 2.7 1.3 1.3 1.8
Livestock Rearing 4.1 5.4 21.2 1.3 10.8
Business 5.2 4.3 1.7 1.3 2.7
Farmer 2.1 4.9 24.6 19.2 15.5
Fisherman - 3.8 - 5.8 2.2
Unable to Work 5.2 4.9 - - 1.9
Not Working 11.3 9.8 0.7 - 4.2
Others 3.1 3.3 2.0 3.2 2.7
Total 100.0 100.0 100.0 100.0 100.0 Note: Includes multiple occupations; “Unable to work” includes pensioners, “Others” include being a
carpenter, manning orchard, cultivating black pepper, and driver. Land Ownership, Land Size, Income and State
Total owner-occupied land was 72.6% (Table 4). All respondents in Sarawak were landowners with the land sizes mainly above 3 acres (at 94.1%). Respondents who own land 3 acres or less accounted for 40 percent, mostly in Negeri Sembilan and Perak. Smallholders in Negeri Sembilan and Perak were landowners but rubber serves only as a supplementary income as they mainly worked in public or private sectors. They tend to hire third parties to tap rubber. Over one third (34%) of smallholders own land above 5 acres.
Table 4 Distribution of smallholders by land ownership, land size and monthly income by state
Negeri
Sembilan Perak Sarawak Sabah
Total (%) Smallholder Status
Owner occupied Owner not operator Operator occupied Power of Attorney to Manage 74.0 9.1 10.4 6.5 54.6 25.2 16.0 4.2 100.0 - - - 65.0 2.9 28.2 3.9 72.6 10.0 14.0 3.5
Total 100.0 100.0 100.0 100.0 100.0
Land Ownership None
1 acre or less 1.1 to 3 acres 3.1 to 5 acres
More than 5 acres 6.5 5.0 63.7 58.2 33.9
Total 100.0 100.0 100.0 100.0 100.0
Monthly Household Income
RM1,000 or less RM1,001-RM2,000 RM2,001-RM4,000 Above RM4,000
55.8 31.2 9.1 3.9
65.5 23.5 8.5 2.5
11.8 52.9 29.4 5.9
56.3 43.7 - -
47.6 37.7 11.7 3.0
Total 100.0 100.0 100.0 100.0 100.0
Overall, those earning household income less than RM1,000 stood at 47.6%. Only 3% of the households earned above RM4,000 per month. By doing various jobs, Sarawak respondents were able to earn higher monthly income, more than RM2,000 (35.3%) compared to respondents from other states. Almost two in three smallholders (65.5%) in Perak earned RM1,000 or below and the proportion was nearly the same in Negeri Sembilan (55.8%) and Sabah (56.3%). With the decline in rubber price, they had to find alternative jobs and sublet their rubber trees to third parties to tap. If one were to combine incomes of those earning RM2,000 and below per month, the proportion would have stood at 87% in Negeri Sembilan, 89% in Perak, all of them in Sabah and lowest being 64.7% in Sarawak.
Overall Income of the Respondents Based on PLI
RISDA’s target was to ensure smallholders earn at least RM2,500 per month by the end of 2015 and RM4,000 by year 2020. Referring to Figure 1 on respondent’s monthly household income, overall household income below RM2,500 per month stood at 89.3%. Those earning between RM2,500 and RM4,000 per month only account for 7.7% and only 3% of the respondents had household income above RM4,000 per month. This shows RISDA’s target of minimum RM2,500 had not been achieved as a large majority (90%) earned below RM2500 per month.
Poverty Line Income (PLI) and Food Poverty Line Income (FPLI)
Hardcore poverty or hardcore poor is defined as monthly income below the food poverty line that is needed to cover nutritional meals of the family (Malay Mail Online, 8 June 2014). The latest formula for the poverty line income established in 2014 is minimum RM930 in Peninsular Malaysia, RM1170 in Sabah and
RM990 in Sarawak(Chi, 2015). Meanwhile, the same source identifies the food
poverty line as minimum household income under RM580 in the peninsula, RM710 in Sabah and RM660 in Sarawak. Using these definitions, crude hardcore poverty is highest at Perak, high at Sabah and none at Sarawak. Incidence of poverty among smallholders is thus highest at Negeri Sembilan (36.4%), followed by Sabah (35.9%) and Perak (21.9%), and is lowest (2.9%) at Sarawak (Table 4). These figures were much higher than the poverty rates issued by the Economic Planning Unit, Prime Minister’s Department in 2014 which reported a very low of 0.7% at Perak; 0.4% at Negeri Sembilan; 3.9% at Sabah and 0.9% at Sarawak. This illustrates that incidence of poverty among rubber smallholder was very high at all the four states.
Table 5 Distribution of smallholders’ crude poverty rate by state
Level of Poverty
State
Total Perak Negeri
Sembilan Sabah Sarawak
Hardcore 38.7 15.6 33.9 - 22.1
Poverty 21.9 36.4 35.9 2.9 24.3
Out of Poverty 39.4 48.0 30.2 97.1 53.6
Note: For 2014 Food PLI, Peninsular Malaysia –RM580; Sabah RM710; Sarawak RM660 For 2014 PLI, Peninsular Malaysia –RM930; Sabah RM1170; Sarawak RM990
Source: Malay Mail Online, 8 June 2014.
Monthly Income and Expenditure by Income Source
We begin here with the premise that the reducing price of rubber certainly affected household income of smallholders and their living standards. Table 5 proves that 22.1% of the respondents in the four states were earning RM500 per month. Healthy smallholders survived by doing alternative jobs like farming, fishing and planting other crops. Respondents who were unhealthy or aged 50 and above were unable do multiple jobs to supplement their income. They depend on government contributions such as Special Assistance Due to Declining Rubber Prices (BKKH), an assistance of RM500 given in 2014 and 2015. Besides that, the government also provided BRIM (1 Malaysia People’s Aid) which enabled them to receive a one-off amount of RM500. BR1M was an amount given to deserving lower income citizens across all sectors by the government. In 2016, the BR1M aid had been given through three instalments compared to previous disbursement to households and single individuals. The minimum monthly
2016 online dated 1st May 2016). These disbursements were seen to reduce the burdens of the poor.
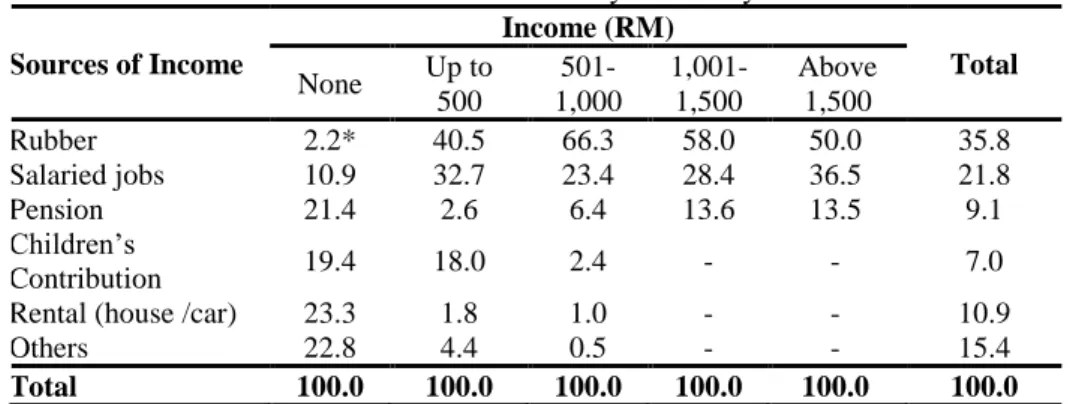
Table 6 shows that there were 2.2% smallholders who did not receive any income as their land was currently under rubber replanting programs and had to wait for the rubber trees to grow at least for another four years before they could tap. During this period they had to find other supplementary income.
Table 6: Smallholders’ monthly income by source
Sources of Income
Income (RM)
Total None Up to
500
501-1,000
1,001-1,500
Above 1,500
Rubber 2.2* 40.5 66.3 58.0 50.0 35.8
Salaried jobs 10.9 32.7 23.4 28.4 36.5 21.8
Pension 21.4 2.6 6.4 13.6 13.5 9.1
Children’s
Contribution 19.4 18.0 2.4 - - 7.0
Rental (house /car) 23.3 1.8 1.0 - - 10.9
Others 22.8 4.4 0.5 - - 15.4
Total 100.0 100.0 100.0 100.0 100.0 100.0
Note: * - due to replanting; “Others” comprise incomes from, Social Welfare Department, poultry farming and other supplementary jobs.
Children’s contribution to the respondents was also very low. Only 18.0% of respondent’s children contribute below RM500 to their parents. The respondents also received other incomes from businesses, formal employment with the public sector, Social and Welfare Department, poultry and other supplementary jobs. Only 9% received their pensions and among them, those receiving more than RM1,500 per month stood at 13.6%. Only a negligible proportion earned from rentals.
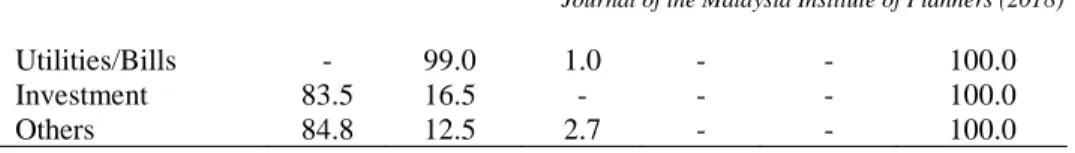
Food is basic human needs. With the decline in the price of rubber, the smallholders tend to spend less on food. For example, over 71% spent less than RM500 on food (Table 7). Almost one-quarter of the respondents spent between RM500 and RM1,000 on food. However, many also spent below RM500 each on bills, children’s education and transportation.
Table 7: Monthly expenditure of smallholders
Purpose
Expenditure (RM)
Total (%) None Up to
500
501-1,000
1,001-1,500
Above 1,500
Food - 71.3 23.7 5.0 - 100.0
Rent & Bank Loan 81.0 15.0 3.5 0.5 - 100.0 Children Education 48.9 46.3 4.0 0.8 - 100.0 Transport
Expenses
Utilities/Bills - 99.0 1.0 - - 100.0
Investment 83.5 16.5 - - - 100.0
Others 84.8 12.5 2.7 - - 100.0
Note: Others include vehicle repair, medicine, fuel, car loan and groceries. Figures in table show proportions with column.
Government Assistance to the Smallholders
The government was concerned with the present low prices for rubber that had affected smallholder’s income. There had been several plans by the government to help them. The government helped on replanting with the state governments subsidising between 22% and 28% at Negeri Sembilan, Perak and Sarawak compared to only 7.8% by Sabah (Table 8).
Table 8: Subsidy received by smallholders by state
Type of Subsidy
State Negeri
Sembilan Perak Sarawak Sabah
Replanting 22.3 21.6 28.1 7.8
Livestock Rearing - 2.1 16.3 4.9
Cash Crops 1.3 1.6 - -
Increase Rubber Productivity 1.3 - - 2.9
Rubber Latex Booster 11.8 11.1 2.5 4.9
Tapping Equipment 9.9 1.0 1.9 4.9
Rain Protector - 1.0 1.3 -
Fertiliser/Insecticides 24.3 43.2 35.5 33.0
Financial Support 1.4 3.7 14.4 -
BKKH 26.3 8.4 - -
Additional Economy Activities
(AET) 0.7 - - -
Rubber Production Incentives (IPG) - - - 41.6
None 0.7 6.3 - -
Total 100.0 100.0 100.0 100.0
Although Sabah smallholders get the lowest subsidy among the states for replanting, they received the highest incentives of Rubber Production Incentives (IPG) from the MRB at 41.6% compared to other states which did not apply for it. A large proportion of government subsidy went to fertilisers and insecticides. BKKH subsidy of RM500, were given to smallholders who were registered with RISDA. In the peninsula, Negeri Sembilan smallholders received the highest (26.3%) followed by Perak (8.4%).
Conclusion
Natural rubber has put Malaysia as the top latex producing countries in the world some decades back before lagging behind to the third place now after Thailand and Indonesia. Natural rubber still continues to position itself as a strategic commodity crop in Malaysia, especially in supporting the rubber-based industries as well as being one of the main sources of income for rural smallholders. In tandem with the objective of transforming Malaysia into a developed and high-income nation status by 2020, the rubber industry is expected to sustain its contribution by producing high value and green products to meet global demand. This can only be sustained if those involved in the rubber plantations find it worthwhile to continue planting rubber. Various schemes and assistance have been introduced to help smallholders by providing special cash payments, subsidising fertiliser, providing assistance to rearing livestock and IPG.
This study found that almost 90% of the smallholders’ monthly household income had fallen very much below RM2,500 at all the four states studied. It shows that the government policy targeting at smallholder’s income to reach RM2,500 by year 2015 had failed. In fact, hardcore poverty stood at 39% among smallholders in Perak, 34% in Sabah, and 16% in Negeri Sembilan. Overall 23% of all smallholder families lived in hardcore poverty. Smallholders families who had household income below PLI was highest at Negeri Sembilan and Sabah (at 36%, respectively) and 22% at Perak. In sum, only 39% of smallholders in Perak, 48% in Negeri Sembilan, 30% in Sabah and 97% in Sarawak had income above PLI. Put together, 46% of the smallholder population in the four states were either in poverty or hardcore poverty.
By analysing the smallholders’ spending pattern due to the falling rubber price, the smallholders had to manage their spending to mere basic needs such as food, children’s education, transportation and utilities or bills. Some reportedly starve as they had no money to spend on food. Results of the study showed a majority of the smallholders studied were aged in their 50s. Many were approaching their retirement age but their current financial instability required them to have supplementary jobs to support themselves and their family. Most of their adult children were also unable to contribute to the households as they had migrated, were studying, or settled down elsewhere.
Unfortunately, household expenditures had escalated along with the government service tax beginning April 2015. Healthier smallholders managed the drop in their income through alternative jobs such as fishing, rearing livestock and cultivating cash crops. However, for the aged and the unhealthy, they were unable to look for alternative jobs. This had worsened by weak family support.
They were also categorised as poor people and registered with E-Kasih. E-Kasih
household, allowing applications for assistance, till the request is accepted or approved (Ministry of Women, Family and Community Development, 2016).
Although the current government has policies to remove subsidies in the economy, monthly subsidy should be extended to smallholder families to support them. The aged rubber smallholders should also be aided as they are prone to ill-health conditions and are unable to earn a living. It is perhaps better to assist smallholders to form cooperatives by consolidating smallholder lands to modern smallholding where they could synergise work for mutual benefit and to receive constant incomes and assistance. The cooperatives may also operate the land as if the land has been outsourced, encourage cultivation of cash crops to diversify income sources, and integrated farming. The younger generation may be introduced into modern smallholding through new land schemes, just like the way the oil palm plantations are currently promoted. It is most important that poverty among smallholder families are addressed.
The study may benefit plantation schemes around the world and in particular to give attention to farmers. Future research should consider widening the study to more states and a larger sample size, and to see the role of the second and third generations of rubber smallholders in rubber cultivation.
ACKNOWLEDGEMENT
The authors would like to express their gratitude to the grant provided for the research by the Population Studies Unit, at the Faculty of Economics and Administration, University of Malaya.
REFERENCES
Barlow, C., Jayasuriya, S., & Tan, C. S. (1994). The world rubber industry. London: Routledge.
Chamhuri Siwar & Norshamliza Chamhuri (2008). Poverty and inequality in
Malaysia: Rural poverty alleviation strategies and programmes. Bangi: Universiti Kebangsaan Malaysia.
Chi, M. (2015, June 8). Poverty rate down to 0.6pc. Parliament told’. Malay Mail
Online. Retrieved from https://www.malaymail.com /s/911663/poverty-rate-down-to-0.6pc-parliament-told
Department of Statistics Malaysia (2015). Monthly statistical bulletin Malaysia
– March 2015. Malaysia: Department of Statistics Malaysia.
Dissanayake, D. M. A. P., Wasana Wijesuriya, Herath, H. M. L. K., & Gunaratne, P.K.K.S. (2013). Socio-economic status of smallholder rubber farmers in
the Moneragala District. Journal of Food and Agriculture, 3(1-2), 41-49.
Hasan, S. (2002). Literature review of poverty and urban development indicators.
Retrieved from
Ministry of Agriculture and Agro-Based Industry, Malaysia (2012). National Agricultural Policy. Kuala Lumpur: Percetakan Nasional Malaysia Berhad.
Ministry of Plantation Industries and Commodities (2012). National
Commodities Policy 2011-2020. Kuala Lumpur: Percetakan Nasional Malaysia Berhad.
Ministry of Women, Family and Community Development (2016). https://ekasih.icu.gov.my/, retrieved 31 May 2016.
Pazim, F. O. (2003). Malaysia. In M. G. Chaudhry (Ed.). Agrarian reforms and
agricultural productivity: report of the APO study meeting on agrarian reforms and agricultural productivity, Sri Lanka, 28 May – 2 June 2001. Tokyo: Asian Productivity Organization.
RISDA (2013). 2013 RISDA Smallholders Census. Kuala Lumpur: RISDA.
Yeoh, E. K., & Loh, J. H. (2008). China in the world contemporary issues and