Journal of Applied Food Technology
H o m e p a g e : h t t p s : / / e j o u r n a l 2 . u n d i p . a c . i d / i n d e x . p h p / j a f t
Effect of Basil (
Ocimum americanum
L.) Proportion on Physical and
Organoleptical Properties of Basil Cracker
Yoga Pratama*, Tsurayya Ulfah, Valentinus Priyo Bintoro
Department of Food Technology, Faculty of Animal and Agricultural Sciences, Diponegoro University, Semarang
*Corresponding author ([email protected])
Abstract Received: 29 May 2018 Article information:
Accepted:30 June 2018 Available online:
5 July 2018
Keywords: Basil Color Cracker Crispiness linear expansion organoleptic
© 2018 Indonesian Food Technologists All rights reserved
This is an open access article under the CC BY-NC-ND license
doi: 10.17728/jaft.3839 Basil contains flavonoid, saponin, tannin, and essential oils namely
sineol and eugenol. Basil has been known as appetite stimulant, laxative, fragrance, and breast milk stimulator. This study aimed to determine the effect of basil addition to linear expansion, crispiness, color, and organoleptic of basil cracker. Complete Randomized Design was used in this research with 4 treatments and 5 replications i.e. T1 (10% basil, 90% tapioca), T2 (15% basil, 85% tapioca), T3 (20% basil, 80% tapioca), T4 (25% basil, 75% tapioca). Linear expansion was measured using ruler, hardness/crispiness using texture analyzer, color using digital colormeter, and organoleptic testing was done by 25 panelists. The research showed that basil cracker had linear expansion of 166-235%; hardness of 1264.8-1837.6 gF; L* value of 22,47-40,40 and a* value of -20.73 to -12.67. Variation of basil proportion gave significant effects to linear expansion, crispiness, and color of basil cracker. The best treatment was T2 (15% basil, 85% tapioca) because it had high linear expansion and bright color, was crispy, and preferred by panelists.
Introduction
Crackers are popular snack in Indonesia and often consumed as side dish. The raw material for crackers are easy to obtain and the production process is simple (Suprapti, 2005). Crackers are typically made from starch as the main ingredient which is mixed with water. The resulted dough is molded and then boiled or steamed. Subsequently, the dough is cooled, sliced, dried until the water content reaches approximately 10%, and fried (Zulfahmi et al., 2014).
Flavor-inducing raw materials such as shrimp and mackerel are commonly added to crackers’ dough in order to increase its palatability, thus the crackers are named shrimp cracker and mackerel cracker, accordingly. Flavor improvement can also be obtained from vegetal sources. Using plant based material has some advantages as it is cheaper, non allergenic and it may also act as food diversification. Basil leaf (locally
known as Kemangi), has strong and distinctive odor hence it is suitable to be used in crackers’ flavor improvement.
Basil contains essential oils which also responsible for its specific odor. The composition of the essential oils is influenced by its growing environment (Sulianti, 2008). In addition to sineol and eugenol essential oils, basil contains range of flavonoids, saponins, and tannins. Basil is known to be able to inhibit the growth of pathogenic bacteria such as Candida albicans, Streptococcus mutans, and Lactobacillus casei
in an in-vitro set up (Harmely et al., 2014). In the field of health, basil has shown effects as appetite stimulant, laxative, fragrances, and breast milk stimulator (Sulianti, 2008).
expansion, crispiness, color, and organoleptic aspects of basil crackers. The benefit of this research was to provide best formula in the production of basil crackers.
Materials and methods
Basil Crackers Production
Basil leaves were separated from the stalk and then weighed according to the desired weight and then washed and drained. The leaves were then pulverized and mixed with tapioca flour according to the treatment, which were T1 (10% basil, 90% tapioca), T2 (15% basil, 85% tapioca), T3 (20% basil, 80% tapioca), T4 (25% basil, 75% tapioca). The resulted mixture were subsequently added with 2% (w/w) of salt, 2% (w/w) of baking powder, 2% (w/w) of beaten egg and 100% (v/w) of water. The dough was put into a mold that has already been oiled and then steamed for 45 minutes. During the steaming process, the container was covered with perforated aluminum foil. The steamed dough was cooled to room temperature for 10 hours then put in the freezer for 2 hours before it was sliced into 2 mm thick. The slices were dried in oven at 45°C for 20 hours. The dried slices (pellets) were deep fried at 190°C for 25 seconds (Zulfahmi et al., 2014).
Linear Expansion
The expansion of the crackers was analyzed by comparing the area (length x width) of cracker before and after frying according to Mustofa and Suyantono (2011). The crackers’ linear expansion was calculated by the following formula, where A was area of cracker before frying (cm2) and B was area of cracker after frying (cm2):
Linear expansion= B - A
A ×100%
Hardness
Basil cracker hardness was measured using a
Brookfield CT3 texture analyzer with a cylinder probe according to Kusnandar et al. (2010). The equipment was set with a 4.5 g trigger; deformation of 5.0 mm; and speed of 2.5 mm/s. Hardness is expressed as gram force (gF).
Color
The color of fried basil crackers was measured using a digital color meter FL-03-12 and expressed in L* for its lightness and a* for its greenness according to Akbar et al. (2017).
Organoleptic Test Procedures
The organoleptic test of basil cracker was done by ranking and hedonic test according to Setyaningsih et al.
(2010). The analysis involved 25 semi-trained panelists.
Each sample was randomly coded. In the ranking test, panelists were asked to sort the sample according to their intensity of pre-determined parameters. The hedonic test shows the level of consumer acceptance. Panelists were required to provide a personal response to the likes or dislikes of the samples presented. No similar score was allowed in ranking test whereas panelists were allowed to give similar score in hedonic test on a scale of 1-5 (very dislike – very like).
Data Analysis
Data were statistically analyzed with SPSS software using ANOVA at 5% significance level to evaluate the effect of variation of basil proportion. If the effect of basil proportion variation was significant then the analysis was continued with Duncan post-hoc test to find out the difference effect of variation of basil proportion on basil cracker characteristics (Hardianto et al., 2012). The results of organoleptic test were analyzed using non-parametric Kruskal-Wallis test and then followed by Mann-Whitney test for post-hoc test (Raffo et al., 2018).
Results and Discussion
Linear Expansion
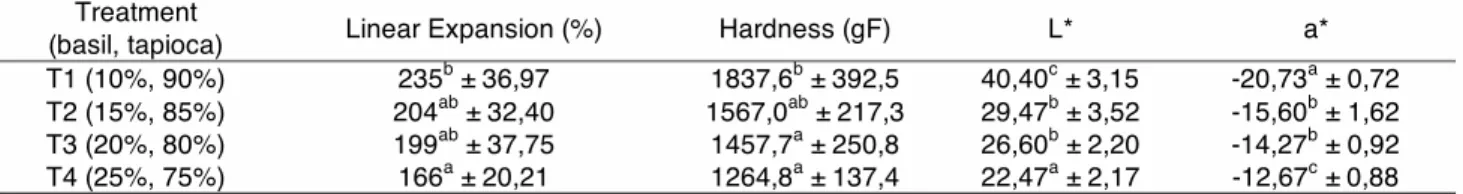
According to Table 1, it can be seen that T1, T2, T3, and T4 had linear expansion of 235%, 204%, 199%, and 166%, respectively. The increasing proportion of basil and the reduced proportion of tapioca starch resulted in a significant decrease in the linear expansion based on the ANOVA test. The expansion of crackers was caused by a vapor expansion process which was trapped in the raw cracker structure. The sudden expansion of water vapor caused by rising temperature when crackers are being fried will push the starch gel and cause the formation of hollow structures so that the volume is enlarged (Mulyana et al., 2014). Decrease in linear expansion occurs due to the decrease in total amylopectin in crackers in line with the decrease in the proportion of tapioca starch (Nurul et al., 2009). Amylopectin has a less compact structure so it is not strong enough in resisting the puffing when crackers being fried (Wahyuningtyas et al., 2014).
One of the phenomena that occur in the manufacture of crackers is gelatinization. This occurs when the starch is heated with water so that the starch granules swell, the viscosity of the dough will be higher and become more transparent (Parker and Pace, 2017). The higher the amylopectin content, the linear expansion product increases because amylopectin is easy to trap
water (Ramadhani and Murtini, 2017) thus
accommodates the gelatinization process.
Tabel 1. Result of Physical Properties Analysis of Basil Cracker with Different Basil Proportion Treatment
(basil, tapioca) Linear Expansion (%) Hardness (gF) L* a*
T1 (10%, 90%) 235b ± 36,97 1837,6b ± 392,5 40,40c ± 3,15 -20,73a ± 0,72
T2 (15%, 85%) 204ab ± 32,40 1567,0ab ± 217,3 29,47b ± 3,52 -15,60b ± 1,62
T3 (20%, 80%) 199ab ± 37,75 1457,7a ± 250,8 26,60b ± 2,20 -14,27b ± 0,92
T4 (25%, 75%) 166a ± 20,21 1264,8a ± 137,4 22,47a ± 2,17 -12,67c ± 0,88
Fiber in the formula reduces the volume of crackers (Ahmed and Abozed, 2015). In addition to the reduced proportion of tapioca, the decrease in the linear expansion process is also due to the increasing amount of fiber as the proportion of basil increases. The linear expansion of T1 cracker was significantly different from T4. The addition of basil proportions up to 20% has no significant effect on the linear expansion crackers while the addition of 25% basil proportion significantly decreased the expansion of crackers.
Hardness and Crispiness
Crispiness is related to the sound produced when the food is chewed (Paula and Silva, 2014). Food structure is one of the factors that affect the crispiness. A little force given to crunchy food will lead to fragile structures resulting in vibration and sound formation (Saeleaw and Schleining, 2011). In products that processed by frying, crispiness is one of the important parameters that need to be controlled.
Hardness is related to the force required by the teeth to suppress food (Paula and Silva, 2014). Hardness on crackers can be determined by sensory test using the term of crispiness. The value of crispiness is the opposite of hardness hence low hardness value reflects high crispiness (Nurul et al., 2009).
Based on Table 1, it can be seen that T1, T2, T3, and T4 had hardness of 1837.6 gF; 1567.0 gF; 1457.7 gF; and 1264.8 gF, respectively. The increasing proportion of basil and the reduced proportion of tapioca starch resulted in a significant decrease in hardness against basil crackers based on ANOVA test. The decrease of hardness was evidently shown in the addition of basil as much as 20% and 25%. This indicates that crackers are quantitatively crispier with the addition of basil.
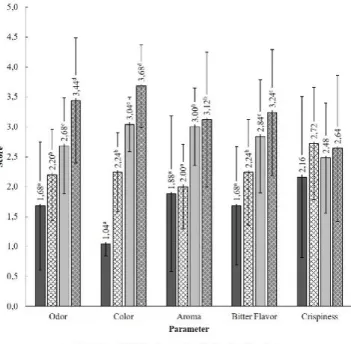
However, based on Figure 1, it can be seen that the difference in value of crispiness in the ranking test was not significant. This suggests that the panelists could not differentiate the crispiness on crackers with different basil proportions despite the crispiness of basil crackers was significantly different in quantitative analysis. The addition of basil proportions up to 25% had no significant (negative) effect on the crispiness of crackers by organoleptic test. The result is favorable because normally the addition of plant based material affects the crispiness, even according to hardness analysis the crackers become crispier with the addition of basil. Hedonic test result in Figure 2 shows that T2 crackers with an average value of 4.16 was the most favored crispiness by panelists.
Crispiness is affected by the difference of size and cavity density in the cracker structure. The cavities that formed make the crackers become less hard and crispy. The formation of a cavity structure also determines the linear expansion of crackers. The larger the cavities are formed, the greater linear expansion. In general, crispiness will increase along with the increasing degree of puffing/linear expansion (Nurul et al.,2009). However, in this study the increase in linear expansion was not in line with the increase of crispiness. The presence of fiber due to the addition of basil is speculated to damage the
compactness of the starch structure so that the dough becomes brittle and less hard hence the crispiness increases.
Color
The results of the color ranking test showed significant differences (p<0.05) in value (Figure 1). This indicates that the panelists can distinguish colors on crackers with different basil proportions. The results of organoleptic test showed that the greenest to the least green crackers were sequentially T4, T3, T2, and T1. Based on Figure 2, T2 crackers with an average value of hedonic test 4.00 had the most favored green color by panelists (p<0.05). In general, panelists like basil crackers that have less dark green color and not too bright.
The color measurement with the model L*a*b* shows the result in 3 dimensions. L* (lightness) indicates brightness. The value ranges from 0-100, 0 indicates black color and 100 white color. The a* value represents the red-green profile where a* with a negative value indicates that the basil crackers are green. The b* value describes the yellow-blue profile. The yellow color expressed as b+ whereas blue b- (Akbar et al., 2017).
The green color on the basil crackers is influenced by the presence of chlorophyll contained in basil. Chlorophyll is a special pigment of green plants (Dumbrava et al., 2012). The more basil proportions are added, the green color of the crackers gets darker. However, in accordance with the results of quantitative analysis (Table 1), the addition of the number of basil proportions caused the value of a* closer to zero. This indicates the intensity of the green color on cracker was reduced. On the other hand, the L* value decreased with the addition of basil portion which indicates that the cracker's brightness level decreased. It turned out that the formation of dark green color due to the addition of basil is the result of a combination of decreasing brightness (getting darker) and the intensity of green color that is getting faded quantitatively. This was in contrast to panelist perceptions. Panelists consider that the most concentrated green crackers were the greenest crackers (dark green).
Using sensory analysis in order to evaluate the characteristic of product is lack in accuracy and tends to be subjective. Therefore, quantitative analysis is generally more preferred. This study has shown however that using quantitative analysis result only will fail to interpret the real phenomena occurred in basil crackers and leads to wrong conclusion of fading greenness due to the addition of basil.
Odor
greenest color (dark green) were a cracker that has the most distinctive smell of basil. In order to overcome the bias, organoleptic test should be conducted using red lighting as color masking (Braghieri et al., 2016). The result of hedonic test (Figure 2) shows that panelists like the crackers with less basil odor. T2 crackers odor with an average value of 2.84 in hedonic test values was the most preferred by panelists.
Figure 1. Ranking test chart
Note for score: Odor (1. Less typical basil, 4. More typical basil), Color (1. Less green, 4. More green), Aroma (1. Less typical basil, 4. More typical basil), Bitter Flavor (1. Less bitter, 4. More bitter), Crispiness (1. Less crisp, 4. More crisp)
Figure 2. Hedonic test chart
Note for score : 1. Very dislike, 2. Dislike, 3. Rather like, 4. Like, 5. Very like
Aroma and Bitterness
The results of the ranking test in Figure 1 show that the difference in aroma was significant (p<0.05). However, the panelists could not differentiate the aroma between T1 and T2 of basil crackers and could not distinguish between T3 and T4. Panelists like crackers that have a less-distinctive aroma of basil. Crackers with a very distinctive aroma of basil tend to be disliked by panelists. T2 crackers with an average value on rank test of 2.00 and the average value of hedonic test 3.88 were the cracker with the most preferred aroma.
Similarly, the panelists were able to distinguish the difference in bitter taste of basil crackers samples (p<0.05). T1 crackers with an average value on ranking test of 1.68 and an average value on hedonic test value of 3.84 were the least bitter and most preferred crackers by panelists. The greater amount of basil proportions added makes the basil crackers to be disliked more by the panelists due to the increase of bitter taste.
A typical aroma of basil crackers is caused by the presence of essential oils with different chemical compositions. In addition, basil also contains various kinds of phenolic compounds (Dumbrava et al., 2012). The presence of phenolic compounds in high concentrations leads to a bitter taste (Rudnitskaya et al., 2010).
Conclusion
The increase proportion of basil led to a significant decrease in the linear expansion, hardness, brightness, and greenness (a* value) of basil crackers. Meanwhile, the change in brightness and greenness were collectively interpreted to be increase in greenness by ranking test. The crackers made by different basil proportion were distinguishable in terms of color, aroma, odor and bitterness. From the physical properties and consumer acceptance, the best treatment was cracker with a composition of T2 (15% basil, 85% tapioca) because it has a high linear expansion, crispy, bright colored and favored panelists.
References
Ahmed, Z.S., Abozed, S.S. 2015. Functional and antioxidant properties of novel snack crackers incorporated with Hibiscus sabdariffa by-product. Journal of Advanced Research 6:79–87. DOI: 10.1016/j.jare.2014.07.002.
Akbar, Y.M., Masithoh, R.E., Khuriyati, N. 2017. Application of multivariate analysis based on color to predict brix and pH on Banana. Agritech 37(1): 108-114. DOI: 10.22146/agritech.17022. (In Bahasa Indonesia).
Braghieri, A., Piazzolla, N., Galgano, F., Condelli, N., Rosa, G.D., Napolitano, F. 2016. Effect of preservative addition on sensory and dynamic profile of Lucanian dry-sausages as assessed by quantitative descriptive analysis and temporal dominance of sensations. Meat Science 122:68– 75. DOI: 10.1016/j.meatsci.2016.07.020.
basilicum L.) and rosemary (Rosmarinus officinalis L.) leaves extracts. Journal of Agroalimentary Processes and Technologies 18(3): 253-258.
Hardianto, Suarjana, I.G.K., Rudyanto, M.D. 2012. Effect of temperature and length of storage on the kampong chicken eggs quality reviewed from total plate number of bacteria. Indonesia Medicus Veterinus 1(1): 71-84. (In Bahasa Indonesia). Harmely, F., Deviarny, C., Yenni, W.S. 2014.
Formulation and evaluation of edible film preparation from basil leaf extract (Ocimum americanum L.) as mouth freshener. Jurnal Sains Farmasi dan Klinis 1(1):38-47. DOI: 10.29208/jsfk. 2014.1.1.10. (In Bahasa Indonesia).
Kusnandar, F., Adawiyah, D.R., Fitria, M. 2010. Shelf life estimation of biscuit products by acceleration method based on critical water content approach. Jurnal Teknologi dan Industri Pangan 21(2): 117-122. (In Bahasa Indonesia).
Mulyana, Susanto, W.H., Purwantiningrum, I. 2014. Influence of proportion (semangit tempe flour : tapioca starch) and water addition to the characteristics of semangit tempe cracker. Jurnal Pangan dan Agroindustri 2(4):113-120. (In Bahasa Indonesia).
Mustofa, K.A., Suyantono, A. 2011. Levels of calcium, linear expansion, and organoleptic properties of
onggok cassava cracker with variations addition of crab shell flour (Portunus Pelagicus). Jurnal Pangan dan Gizi 2(3):1-14. (In Bahasa Indonesia). Nurul, H., Boni, I., Noryati, I. 2009. The effect of different ratios of Dory fish to tapioca flour on the linear expansion, oil absorption, colour and hardness of fish crackers. International Food Research Journal 16: 159-165.
Parker, R., Pace, M. 2017. Introduction to food science & food systems. Second Edition, Cengage Learning, Boston.
Paula, A.M., Silva, A.C.C., 2014. Texture profile and correlation between sensory and instrumental analyses on extruded snacks. Journal of Food Engineering 121: 9–14. DOI: 10.1016/j.jfoodeng. 2013.08.007.
Raffo, A., Carcea, M., Moneta, E., Narducci, V., Nicoli, S., Peparaio, M., Sinesio, F., Turfani, V. 2018. Influence of different levels of sodium chloride and of a reduced-sodium salt substitute on volatiles formation and sensory quality of wheat bread. Journal of Cereal Science 79:518-526. DOI: 10.1016/j.jcs.2017.12.013.
Ramadhani, F., Murtini, E.S., 2017. Effect of flour type and addition of filling to physicochemical and organoleptic characteristics of egg cork cheese cake. Jurnal Pangan dan Agroindustri 5(1): 38-47. (In Bahasa Indonesia).
Rudnitskaya, A., Nieuwoudt, H.H., Muller, N., Legin, A., Toit, M.D., Bauer, F.F., 2010. Instrumental measurement of bitter taste in red wine using an electronic tongue. Analytical and Bioanalytical Chemistry 397: 3051-3060. DOI: 10.1007/ s00216-010-3885-3.
Saeleaw M., Schleining, G. 2011. Effect of frying parameters on crispiness and sound emission of cassava crackers. Journal of Food Engineering 103: 229-236. DOI: 10.1016/j.jfoodeng.2010. 10.010.
Setyaningsih, D., Apriyantono, A., Sari, M.P. 2010. Analisis Sensori untuk Industri Pangan dan Agro. IPB Press. Bogor.
Sulianti, S.B., 2008. Phytochemical study of Ocimum spp.: chemical components of essential oils of Kemangi and Ruku-Ruku. Berita Biologi 9(3): 237-241. (In Bahasa Indonesia).
Suprapti, M.L. 2005. Kerupuk Udang Sidoarajo. Kanisius, Yogyakarta.
Wahyuningtyas, N., Basito, Atmaka, W. 2014. Assessment of physicochemical and sensory characteristics of cracker made from wheat flour, tapioca flour and yellow kepok banana flour. Jurnal Teknosains Pangan 3(2): 76-85. (In Bahasa Indonesia).