Credit Classification Using Grammatical Evolution
Anthony Brabazon
University College Dublin, Ireland. E-mail: [email protected] Michael O’Neill
University of Limerick, Ireland. E-mail: [email protected]
Keywords: grammatical evolution, credit rating, bond rating
Received: May 25, 2004
Grammatical Evolution (GE) is a novel data driven, model induction tool, inspired by the biological gene-to-protein mapping process. This study provides an introduction to GE, and demonstrates the methodology by applying it to model the corporate bond-issuer credit rating process, using information drawn from the financial statements of bond-issuing firms. Financial data and the associated Standard & Poor’s issuer-credit ratings of 791 US firms, drawn from the year 1999/2000 are used to train and test the model. The best developed model was found to be able to discriminate in-sample (out-of-sample) between investment-grade and junk bond ratings with an average accuracy of 87.59 (84.92)% across a five-fold cross validation.
Povzetek: Metoda gramatiˇcne evolucije je uporabljena za klasificiranje kreditov.
1
Introduction
Grammatical Evolution (GE) [1], represents an evolution-ary automatic programming methodology, and can be used to evolve rule sets. These rule sets can be as general as a functional expression which produces a good mapping be-tween a series of known input-output data vectors. A par-ticular strength of the methodology is that the form of the model need not be specified a priori by the modeler. This is of particular utility in cases where the modeler has a the-oretical or intuitive idea of the nature of the explanatory variables, but a weak understanding of the functional rela-tionship between the explanatory and the dependent vari-able(s). GE does not require that the model form is linear, nor does the method require that the measure of model er-ror used in model construction is a continuous or differen-tiable function. Neither is GE a black box method. As such the evolved rules (taking the form of symbolic expressions in this instance) are amenable to human interpretation and consequently have the potential to enhance our understand-ing of the problem domain.
A key element of the methodology is the concept of a Grammar, which governs the creation of the rule sets. This paper describes the GE methodology, and applies the methodology to accurately model the corporate bond rating process.
Most large firms employ both share and debt capital to provide long-term finance for their operations. The debt capital may be provided by a bank, or may be obtained by selling bonds directly to investors. As an example of the scale of US bond markets, the value of bonds issued in the first quarter of 2003 totalled $1.70 trillion [2]. A bond can
be defined as a ‘debt security which constitutes a promise by the issuing firm, to pay a stated rate of interest based on the face value of the bond, and to redeem the bond at this face value at maturity.’ When a publicly-traded company wants to issue traded debt (bonds), it must obtain a credit rating for the issue from at least one recognised rating agency (Standard and Poor’s (S&P), Moody’s or Fitches’). The credit rating represents the rating agency’s opinion, at a specific date, of the creditworthiness of a borrower in gen-eral (an issuer credit rating), or in respect of a specific debt issue (a bond credit rating). Therefore it serves as a sur-rogate measure of the risk of non-payment of interest or capital of a bond. These ratings impact on the borrowing cost and the marketability, of issued bonds.
1.1
Motivation for study
There are a number of reasons to suppose a priori that the use of an evolutionary automatic programming (EAP) ap-proach such as GE, can prove fruitful in this domain.
variables, in an attempt to recover the model used by the rating agencies. This produces a high-dimensional combi-natorial problem, as the modeller is attempting to uncover a good set of model inputs, and model form, giving rise to particular potential for an evolutionary automatic program-ming methodology such as GE. In this initial application of GE to modelling credit rating, we restrict attention to the binary classification case (discriminating between invest-ment grade vs junk grade ratings). This will be extended to the multi-class case in future work. It is noted that a limited number of studies have applied a grammar-based method-ology to constrain the search space for classification rules [3, 4, 5, 6]. This study extends this methodology into the domain of bond-rating.
The rest of this contribution is organized as follows. The next section provides an overview of the literature on bond rating, followed by a section which describes Grammatical Evolution. We then outline the data set and methodology utilised. The following sections provide the results of the study followed by a number of conclusions.
2
Bond rating
Several categories of individuals would be interested in a model that could produce accurate estimates of bond rat-ings. Such a model would be of interest to firms that are considering issuing debt as it would enable them to esti-mate the likely return investors would require if the debt was issued, thereby providing information for the pricing of the bonds. The model could also be used to assess the credit-worthiness of firms that have not issued debt and hence do not already have a published bond rating. This information would be useful to bankers or other companies that are considering whether they should extend credit to that firm. Much rated debt is publicly traded on stock mar-kets, and bond ratings are typically changed infrequently. An accurate bond-rating prediction model could indicate whether the current rating of a bond is still justified. To the extent that an individual investor could predict a bond rerating before other investors foresee it, this may provide a trading edge. In addition, the recent introduction of credit-risk derivatives allows investors to buy protection against the risk of the downgrade of a bond [7]. The pricing of such derivative products requires a quality model for esti-mating the likelihood of a credit rating change.
2.1
Bond Rating Notation
Although the precise notation used by individual rating agencies to denote the creditworthiness of a bond or issuer varies, in each case the rating is primarily denoted by a discrete, mutually exclusive, ‘letter grade’. Taking the rat-ing structure of S&P as an example, the ratrat-ings are broken down into 10 broad classes. The highest rating is denoted AAA, and the ratings then decrease in the following order, AA, A, BBB, BB, B, CCC, CC, C, D. Ratings between
AAA and BBB (inclusive) are deemed to represent
invest-ment grade, with lower quality ratings deemed to represent
debt issues with significant speculative characteristics (junk
bonds). A ‘C’ grade represents a case where a bankruptcy
petition has been filed, and a ‘D’ rating represents a case where the borrower is currently in default on their finan-cial obligations. As would be expected, the probability of default depends strongly on the initial rating which a bond receives (see table 1).
Initial Rating Defaults (%)
AAA 0.52
AA 1.31
A 2.32
BBB 6.64
BB 19.52
B 35.76
CCC 54.38
Table 1: Rate of default by initial rating category (1987-2002)(from [8]).
Ratings from AAA to CCC can be modified by the ad-dition of a + or a -, to indicate at which end of the rating category the bond rating falls.
An initial rating is prepared when a bond is being issued, and this rating is periodically reviewed thereafter by the rating agency. Bonds (or issuers) may be re-rated upwards (upgrade) or downwards (downgrade) if firm or environ-mental circumstances change. A re-rating of a bond below investment grade to junk bond status (such bonds are col-orfully termed ‘a fallen angel’) may trigger a significant sell-off as many institutional investors are only allowed, by external or self-imposed regulation, to hold bonds of in-vestment grade. The practical affect of a bond (or issuer) being assigned a lower rather than a higher rating is that its perceived riskiness in the eyes of potential investors in-creases, and consequently the required interest yield of the bond rises.
2.2
Prior Literature
pre-dictive target and reported good classification accuracies. For example, [14] used a neural network to predict AA or non-AA bond ratings, and obtained an accuracy of approx-imately 83.3%. However, a small sample size (47 compa-nies) was adopted in the study, making it difficult to gener-alise strongly from its results.
3
Grammatical evolution
Evolutionary algorithms (EAs) operate on principles of evolution, usually being coarsely modelled on the theories of survival of the fittest and natural selection [15]. In gen-eral, evolutionary algorithms can be characterized as:
x[t+ 1] =r(v(s(x[t]))) (1) where x[t] is the population of solutions at iteration t , v(.)is the random variation operator (crossover and mu-tation),s(.)is the selection for reproduction operator, and r is the replacement operator which determines which of the parents and children survive into the next generation. Therefore the algorithm turns one population of candidate solutions into another, using selection, crossover and mu-tation. Selection exploits information in the current pop-ulation, concentrating interest on ‘high-fitness’ solutions. Crossover and mutation perturb these solutions in an at-tempt to uncover better solutions, and these operators can be considered as general heuristics for exploration.
GE is a grammatical approach to Genetic Programming (GP) that can evolve computer programs (or rulesets) in any language, and a full description of GE can be found in [1, 16, 17, 18]. Rather than representing the programs as syntax trees, as in Koza’s GP [19], a linear genome rep-resentation is used. Each individual, a variable length bi-nary string, contains in its codons (groups of 8 bits) the information to select production rules from a Backus Naur Form (BNF) grammar. In other words, an individual’s bi-nary string contains the instructions that direct a develop-mental process resulting in the creation of a program or rule. As such, GE adopts a biologically-inspired, genotype-phenotype mapping process.
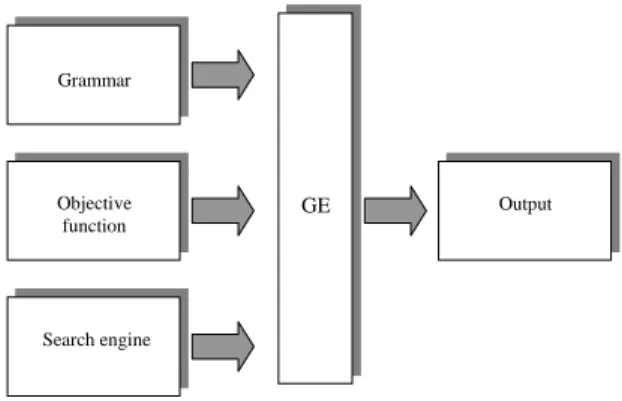
At present, the search element of the system is carried out by an evolutionary algorithm, although other search strategies with the ability to operate over binary or integer strings have also been used [1, 5]. The GE system pos-sesses a modular structure (see figure 1) which will allow future advances in the field of evolutionary algorithms to be easily incorporated.
3.1
The Biological Approach
The GE system is inspired by the biological process of gen-erating a protein from the genetic material of an organism. Proteins are fundamental in the proper development and operation of living organisms and are responsible for traits such as eye color and height [20].
The genetic material (usually DNA) contains the in-formation required to produce specific proteins at differ-ent points along the molecule. For simplicity, consider DNA to be a string of building blocks called nucleotides, of which there are four, named A, T, G, and C, for ade-nine, tyrosine, guaade-nine, and cytosine respectively. Groups of three nucleotides, called codons, are used to specify the building blocks of proteins. These protein building blocks are known as amino acids, and the sequence of these amino acids in a protein is determined by the sequence of codons on the DNA strand. The sequence of amino acids is very important as it determines the final three-dimensional structure of the protein, which in turn has a role to play in determining its functional properties.
In order to generate a protein from the sequence of nu-cleotides in the DNA, the nucleotide sequence is first transcribed into a slightly different format, that being a sequence of elements on a molecule known as mRNA. Codons within the mRNA molecule are then translated to determine the sequence of amino acids that are contained within the protein molecule. The application of produc-tion rules to the non-terminals of the incomplete code be-ing mapped in GE is analogous to the role amino acids play when being combined together to transform the growing protein molecule into its final functional three-dimensional form.
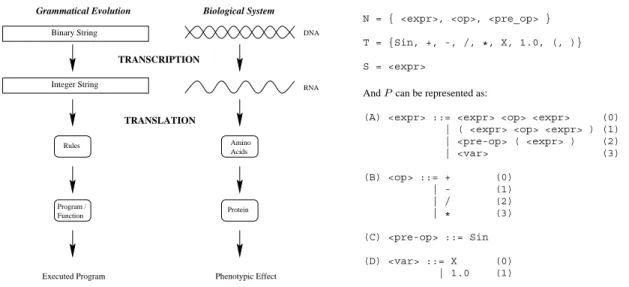
The result of the expression of the genetic material as proteins in conjunction with environmental factors is the phenotype. In GE, the phenotype is a sentence or sentences in the language defined by the input grammar. These sen-tences can take the form, for example, of functions, pro-grams, or as in the case of this study, rule sets. The pheno-type is generated from the genetic material (the genopheno-type) by a process termed a genotype-phenotype mapping. This is unlike the standard method of generating a solution di-rectly from an individual in an evolutionary algorithm by explicitly encoding the solution within the genetic mate-rial. Instead, a many-to-one mapping process is employed within which the robustness of the GE system lies. Fig-ure 2 compares the mapping process employed in both GE
Grammar
Objective function
Search engine
Output
GE
TRANSCRIPTION
TRANSLATION
DNA
RNA
Acids Rules
Grammatical Evolution
Protein
Integer String Binary String
Amino
Biological System
Phenotypic Effect
Program / Function
Executed Program
Figure 2: A comparison between the grammatical evolu-tion system and a biological genetic system. The binary string of GE is analogous to the double helix of DNA, each guiding the formation of the phenotype. In the case of GE, this occurs via the application of production rules to gen-erate the terminals of the compilable program. In the bi-ological case by directing the formation of the phenotypic protein by determining the order and type of protein sub-components (amino acids) that are joined together.
and biological organisms.
3.2
The Mapping Process
When tackling a problem with GE, a suitable BNF (Backus Naur Form) grammar definition must first be defined. The BNF can be either the specification of an entire language or, perhaps more usefully, a subset of a language geared towards the problem at hand.
In GE, a BNF definition is used to describe the output language to be produced by the system. BNF is a notation for expressing the grammar of a language in the form of production rules. BNF grammars consist ofterminals, which are items that can appear in the language, e.g. bi-nary operators +, -, ubi-nary operators Sin, constants 1.0 etc.
andnon-terminals, which can be expanded into one
or more terminals and non-terminals. For example from the grammar detailed below,<expr>can be transformed into one of four rules, i.e it becomes <expr><op><expr>,
(<expr><op><expr>)(which is the same as the first, but surrounded by brackets), <pre-op>(<expr>), or
<var>. A grammar can be represented by the tuple
{N, T, P, S}, whereN is the set of non-terminals, T the set of terminals,P a set of production rules that maps the elements of N toT, and S is a start symbol which is a member ofN. When there are a number of productions that can be applied to one element ofN the choice is de-limited with the ‘|’ symbol. For example,
N = { <expr>, <op>, <pre_op> }
T = {Sin, +, -, /, *, X, 1.0, (, )}
S = <expr>
AndPcan be represented as:
(A) <expr> ::= <expr> <op> <expr> (0) | ( <expr> <op> <expr> ) (1) | <pre-op> ( <expr> ) (2)
| <var> (3)
(B) <op> ::= + (0)
| - (1)
| / (2)
| * (3)
(C) <pre-op> ::= Sin
(D) <var> ::= X (0)
| 1.0 (1)
The program, or sentence(s), produced will consist of el-ements of the terminal set T. The grammar is used in a developmental approach whereby the evolutionary process evolves the production rules to be applied at each stage of a mapping process, starting from the start symbol, until a complete program is formed. A complete program is one that is comprised solely from elements ofT.
As the BNF definition is a plug-in component of the system, it means that GE can produce code in any lan-guage thereby giving the system a unique flexibility. For the above BNF, table 2 summarizes the production rules and the number of choices associated with each.
Rule no. Choices
A 4
B 4
C 1
D 2
Table 2: The number of choices available from each pro-duction rule.
The genotype is used to map the start symbol onto termi-nals by reading codons of 8 bits to generate a corresponding integer value, from which an appropriate production rule is selected by using the following mapping function:
Rule=Codon V alue%N o. Rule Choices (2)
where % is the MOD function which returns the remainder after a division operation (e.g. 4 % 3 = 1). Consider the following rule from the given grammar for the non-terminal op. There are four possible production rules for this non-terminal.
(B) <op> :: = + (0)
| - (1)
| / (2)
| * (3)
If we assume the codon being read produces the integer 6, then
would select rule(2), the operator /. Each time a produc-tion rule has to be selected to transform a non-terminal, another codon is read. In this way the system traverses the genome.
During the genotype-to-phenotype mapping process, it is possible for individuals to run out of codons, and in this case we wrap the individual and reuse the codons. This is quite an unusual approach in EAs, as it is entirely possible for certain codons to be used two or more times. This tech-nique of wrapping the individual draws inspiration from the gene-overlapping phenomenon that has been observed in many organisms [20].
In GE, each time the same codon is expressed it will al-ways generate the same integer value, but, depending on the current non-terminal to which it is being applied, it may result in the selection of a different production rule. This feature is referred to as intrinsic polymorphism. Crucially, however, each time a particular individual is mapped from its genotype to its phenotype, the same output is generated. This is the case because the same choices are made each time. However, it is possible that an incomplete mapping could occur, even after several wrapping events, and in this case the individual in question is given the lowest possible fitness value. The selection and replacement mechanisms then operate accordingly to increase the likelihood that this individual is removed from the population.
An incomplete mapping could arise if the integer values expressed by the genotype were applying the same produc-tion rules repeatedly. For example, consider an individual with three codons, all of which specify rule 0 from below,
(A) <expr> :: = <expr><op><expr> (0) |(<expr><op><expr>) (1) |<pre-op>(<expr>) (2)
|<var> (3)
even after wrapping the mapping process would be in-complete and would carry on indefinitely unless stopped. This occurs because the nonterminal <expr> is being mapped recursively by production rule 0, so it becomes
<expr><op><expr>. Therefore, the leftmost<expr>
after each application of a production would itself be mapped to a
<expr><op><expr>, resulting in an
ex-pression continually growing as follows:
<expr><op><expr><op><expr><op><expr>
and so on.
Such an individual is dubbed invalid as it will never un-dergo a complete mapping to a set of terminals. For this reason we impose an upper limit on the number of wrap-ping events that can occur. It is clearly essential that stop sequences are found during the evolutionary search in or-der to complete the mapping process to a functional pro-gram. The stop sequence being a set of codons that result in the non-terminals being transformed into elements of the grammars terminal set.
Beginning from the left hand side of the genome then, codon integer values are generated and used to select rules
from the BNF grammar, until one of the following situa-tions arise:
1. A complete program is generated. This occurs when all the non-terminals in the expression being mapped are transformed into elements from the terminal set of the BNF grammar.
2. The end of the genome is reached, in which case the
wrapping operator is invoked. This results in the
re-turn of the genome reading frame to the left hand side of the genome once again. The reading of codons will then continue, unless an upper threshold repre-senting the maximum number of wrapping events has occurred during this individual’s mapping process. 3. In the event that a threshold on the number of
wrap-ping events has occurred and the individual is still in-completely mapped, the mapping process is halted, and the individual is assigned the lowest possible fit-ness value.
To reduce the number of invalid individuals being passed from generation to generation, a steady state replacement mechanism is employed. One consequence of the use of a steady state method is its tendency to maintain fit indi-viduals at the expense of less fit, and in particular, invalid individuals.
4
Experimental approach
The dataset consists of financial data of 791 non-financial US companies drawn from the S&P Compustat database. The associated S&P overall credit rating for each corporate bond issuer is also obtained from the database.1
Of these companies, 57% have an investment rating (AAA, AA, A, or BBB), and 43% have a junk rating. To allow time for the preparation of year-end financial state-ments, the filing of these statements with the Securities and Exchange Commission (S.E.C), and the development of a bond rating opinion by Standard and Poor rating agency, the bond rating of the company as at 30 April 2000, is matched with financial information drawn from their finan-cial statements as at 31 December 1999. A subset of 600 firms was randomly sampled from the total of 791 firms, to produce two groups of 300 ‘investment’ grade and 300 junk rated firms. The 600 firms were randomly allocated to the training set (420) or the hold-out sample (180), ensur-ing that each set was equally balanced between investment and non-investment grade ratings.
A total of eight financial variables was selected for in-clusion in this study. The selection of these variables was guided both by prior literature in bankruptcy pre-diction [21, 22, 23], literature on bond rating prepre-diction 1S&P is one of the largest credit rating agencies in the world, currently
[14, 24, 25], resulting in an initial judgemental selection of a subset of accounting ratios. These ratios were then further filtered using statistical analysis.
Five groupings of explanatory variables, drawn from fi-nancial statements, are given prominence in prior literature as being the prime determinants of bond issue quality and default risk:
i. Liquidity ii. Debt iii. Profitability
iv. Activity / Efficiency v. Size
Liquidity refers to the availability of cash resources to meet short-term cash requirements. Debt measures focus on the relative mix of funding provided by shareholders and lenders. Profitability considers the rate of return generated by a firm, in relation to its size, as measured by sales rev-enue and/or asset base. Activity measures consider the op-erational efficiency of the firm in collecting cash, manag-ing stocks and controllmanag-ing its production or service process. Firm size provides information on both the sales revenue and asset scale of the firm and also provides a proxy met-ric on firm history. The groupings of potential explanatory variables can be represented by a wide range of individ-ual financial ratios, each with slightly differing informa-tion content. The groupings themselves are interconnected, as weak (or strong) financial performance in one area will impact on another. For example, a firm with a high level of debt, may have lower profitability due to high interest costs. Following the examination of a series of financial ratios under each of these headings, the following inputs were selected:
i. Current ratio
ii. Retained earnings to total assets iii. Interest coverage
iv. Debt ratio v. Net margin
vi. Market to book value vii. Log (Total assets) viii. Return on total assets
The objective in selecting a set of proto-explanatory vari-ables is to choose financial varivari-ables that vary between companies in different bond rating classes, and where in-formation overlaps between the variables are minimised. Comparing the means of the above ratios for the two groups of ratings (see table 3), reveals a statistically significant dif-ference between the two groups at both the 5% and the 1% level, and as expected, the financial ratios in each case, for the investment ratings are stronger than those for the junk ratings. The only exception is the current ratio, which is stronger for the junk rated companies, possibly indicating a preference for these companies to hoard short-term liq-uidity, as their access to long-term capital markets is weak.
A correlation analysis between the selected ratios (see table 4) indicates that most of the cross-correlations are less than
|0.20|, with the exception of the debt ratio and (Retained Earnings/Total Assets) ratio pairing, which has a correla-tion of -0.64.
In this study, the GE algorithm uses a steady state re-placement mechanism, such that, two parents produce two children the best of which replaces the worst individual in the current population, if the child has greater fitness. The standard genetic operators of bit mutation (probability of 0.01), and variable-length one-point crossover (probability of 0.9) are adopted. A series of functions, are pre-defined as are a series of mathematical operators. A population of initial rule-sets (programs) are randomly generated, and by means of an evolutionary process, these are improved. No explicit model specification is assumed ex-ante, although the choice of mathematical operators defined in the gram-mar do place implicit limitations on the model specifica-tions amongst which GE can search. The grammar adopted in this study is as follows:
<lc> ::= if( <expr> <relop> <expr> ) class=’’Junk’’;
else
class=’’Investment Grade’’;
<expr> ::= ( <expr> ) + ( <expr> ) | <coeff> * <var>
<var> ::= Current_Ratio
| Retained_Earnings_to_total_assest | Interest_Coverage | Debt_Ratio | Net_Margin | Market_to_book_value | Total_Assets | ln(Total_Assets) | Return_on_total_assets
<coeff> ::= ( <coeff> ) <op> ( <coeff> ) | <float>
<op> ::= + | - | *
<float> ::= 9 | 8 | 7 | 6 | 5 | 4 | 3 | 2 | 1 | -1 | .1
<relop> ::= <=
5
Results
Investment grade Junk bond
Current ratio 1.354 1.93
Ret. earn/Tot assets 0.22 -0.12
Interest coverage 7.08 1.21
Debt ratio 0.32 0.53
Net margin 0.07 -0.44
Market to book value 18.52 4.02
Total assets 10083 1876
Return on total assets 0.10 0.04
Table 3: Means of input ratios for investment and junk bond groups of companies.
CR RE/TA IC DR NM MTB TA ROA
CR 1 -0.08 -0.01 0.06 -0.27 0.01 -0.18 -0.15
RE/TA -0.08 1 0.27 -0.64 0.14 0.15 0.15 0.48
IC -0.01 0.27 1 -0.28 0.06 0.31 0.15 0.41
DR 0.06 -0.64 -0.28 1 -0.05 -0.19 -0.20 -0.27
NM -0.27 0.14 0.06 -0.05 1 0.01 0.03 0.22
MTB 0.01 0.15 0.31 -0.19 0.01 1 0.04 0.14
TA -0.18 0.15 0.15 -0.20 0.03 0.04 1 0.07
ROA -0.15 0.48 0.41 -0.27 0.22 0.14 0.07 1
Table 4: Correlations between financial ratios.
In our experiments, fitness is defined as the number of correct classifications obtained by an evolved discriminant rule. The results for the best individual of each cut of the dataset, where 30 independent runs were performed for each cut, averaged over all five randomisations of the dataset, for both the 500 and 1000 population sizes, are given in table 5. In each case the overall classification accuracy is provided, and this is then subdivided into the number of true positivesNtp, the number of true negatives Ntn, and the number of false positives, and false negatives respectively (Nf p,Nf n).
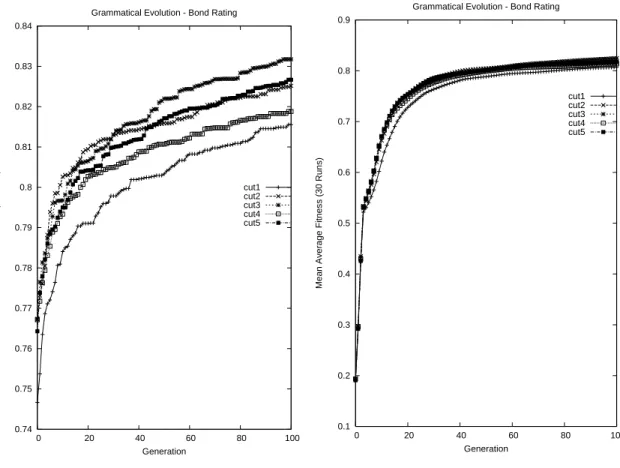
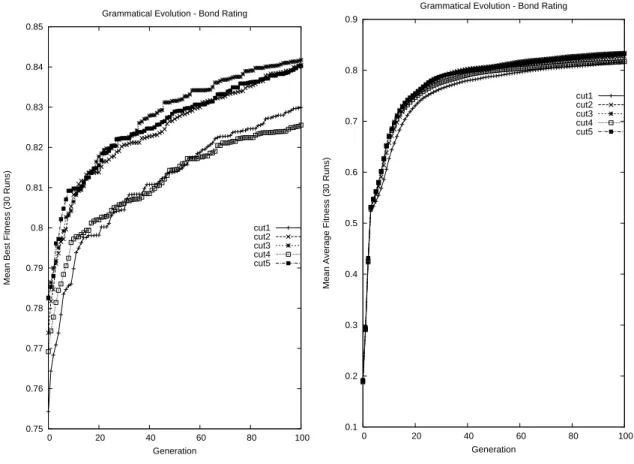
To assess the overall hit-ratio of the developed models (out-of-sample), Press’s Q statistic [26] was calculated for each model. In all cases, the null hypothesis, that the out-of sample classification accuracies are not significantly better than those that could occur by chance alone, was rejected at the 1% level. A t-test of the hit-ratios also rejected a null hypothesis that the classification accuracies were no better than chance at the 1% level. Across all the data re-cuts, the best individual achieved an 87.56 (84.36)% ac-curacy in-sample (out-of-sample) when the population size was 500, with the best individual across all data recuts in the population=1000 case obtaining an accuracy of 87.59 (84.92)% accuracy in-sample (out-of-sample). Although the average out-of-sample accuracy obtained for popula-tion=1000 slightly exceeds that for population=500, the difference was not found to be statistically significant. A plot of the best and average fitness on each cut of the in-sample dataset, for the population=500 case, can be seen in figure 3, and for case where population=1000 in figure 4. Examining the structure of the best individual in the case where the initial fitness function was utilised and where population=500 shows that the evolved discriminant func-tion had the following form:
IF (10 + 16 var6 -9 var4 -2 var9)≥0 THEN ‘Junk’ ELSE ‘Investment Grade’
where var6 isDebt Ratio, var4 isRetained EarningsT otal Assets , and var9 isT otal Assets.
In the case where population=1000 the best evolved dis-criminant function had a similar form to the above:
IF (5 + 8 var6 -4 var4 - var9)≥0 THEN ‘Junk’ ELSE ‘Investment Grade’
Examining the signs of the coefficients of the evolved rules does not suggest that they conflict with common finan-cial intuition. The rules indicate that low/negative retained earnings, low/negative total assets or high levels of debt fi-nance are symptomatic of a firm that has a junk rating. It is noted that similar risk factors have been identified in pre-dictive models of corporate failure which utilise financial ratios as explanatory inputs [3, 4]. Conversely, low lev-els of debt, a history of successful profitable trading, and high levels of total assets are symptomatic of firms that have an investment grade rating. Although the two dis-criminant functions have differing coefficient values, they are in essence very similar, as the differing coefficient val-ues are balanced by the differing constant term which has been evolved in each function.
Fitness TP TN FP FN Train GEBOND500 0.861 185.4 176.4 33.6 24.6 Train GEBOND1000 0.867 183.4 180.8 29.2 26.6
Out-Sample GEBOND500 0.854 77.8 76 14 12.2
Out-Sample GEBOND1000 0.860 78 76.8 13.2 12
Train MLP 0.8690 181.8 183.2 26.8 28.2
Out-sample MLP 0.8500 75.8 77.2 12.8 14.2
Table 5: Performance of the best evolved rules on their training and out-of-sample datasets, averaged over all five ran-domisations, compared with the classification performance of an MLPs on same datasets.
0.74 0.75 0.76 0.77 0.78 0.79 0.8 0.81 0.82 0.83 0.84
0 20 40 60 80 100
Mean Best Fitness (30 Runs)
Generation
Grammatical Evolution - Bond Rating
cut1 cut2 cut3 cut4 cut5
0.1 0.2 0.3 0.4 0.5 0.6 0.7 0.8 0.9
0 20 40 60 80 100
Mean Average Fitness (30 Runs)
Generation
Grammatical Evolution - Bond Rating
cut1 cut2 cut3 cut4 cut5
0.75 0.76 0.77 0.78 0.79 0.8 0.81 0.82 0.83 0.84 0.85
0 20 40 60 80 100
Mean Best Fitness (30 Runs)
Generation
Grammatical Evolution - Bond Rating
cut1 cut2 cut3 cut4 cut5
0.1 0.2 0.3 0.4 0.5 0.6 0.7 0.8 0.9
0 20 40 60 80 100
Mean Average Fitness (30 Runs)
Generation
Grammatical Evolution - Bond Rating
cut1 cut2 cut3 cut4 cut5
Figure 4: Best and average fitness values of 30 runs on the five recuts of the in-sample dataset with a population size of 1000.
5.1
Benchmarking the Results
To provide a benchmark for the results obtained by GE, we compare them with the results obtained on the same recuts of the dataset, using a fully-connected, three-layer, feedfor-ward multi-layer perceptron (MLP) trained using the back-propagation algorithm, and with the results obtained using linear discriminant analysis.
The developed MLP networks utilised all the explana-tory variables. The optimal number of hidden-layer nodes was found following experimentation on each separate data recut, and varied between two and four nodes. The classi-fication accuracies for the networks, averaged over all five recuts is provided in table 5.
The levels of classification accuracy obtained with the MLP are competitive with earlier research, with for example [14] obtaining an out-of-sample classification accuracy of ap-proximately 83.3%, although it is noted that the size of the dataset in this study was small. Comparing the results from the MLP with those of GE on the initial fitness function suggests that GE has proven highly competitive with an MLP methodology, producing a similar classification ac-curacy on the training data, and slightly out-performing the MLP out-of-sample.
Utilising the same dataset recuts as GE, LDA produced
results (averaged across all five recuts) of 82.74% in-sample, and 85.22% out-of-sample. Again, GE is com-petitive against these results in terms of classification ac-curacy. Comparing the results obtained by the linear clas-sifiers (LDA and GE) against those of an MLP suggests that strong non-linearities between the explanatory vari-ables and the dependent variable are not present.
6
Conclusions & future work
In this paper a novel methodology, GE, was described and applied for the purposes of prediction of bond ratings. It is noted that this novel methodology has general utility for rule-induction applications. GE was found to be able to evolve quality classifiers for bond ratings from raw finan-cial information. Despite using data drawn from compa-nies in a variety of industrial sectors, the developed mod-els showed an impressive capability to discriminate be-tween investment and junk rating classifications. The GE-developed models also proved highly competitive with a series of MLP models developed on the same datasets.
input variables. A related possibility would be to concen-trate on building rating models for individual industrial sec-tors. The study can also be extended to encompass the multi-class rating prediction problem. As already noted, there are multiple methodologies available for the genera-tion of classificagenera-tion rules / regression models [27, 28]. Fu-ture work could extend this study by examining the general utility of GE vs other methods of generating classification rules, by comparing the performance of a range of methods on a wider range of datasets.
References
[1] O’Neill M. and Ryan C. (2003) Grammatical
Evo-lution: Evolutionary Automatic Programming in an Arbitrary Language. Kluwer Academic Publishers
2003.
[2] Bond Market Statistics (2003). New York: The Bond Market Association.
[3] Brabazon, A. and O’Neill. M. (2004). Diagnosing Corporate Stability using Grammatical Evolution,
International Journal of Applied Mathematics and Computer Science, 14(3), pp. 363-374.
[4] Brabazon, A. and O’Neill, M. (2003). Anticipat-ing Bankruptcy Reorganisation from Raw Financial Data using Grammatical Evolution, Proceedings of EvoIASP 2003, Lecture Notes in Computer Science
(2611): Applications of Evolutionary Computing,
edited by Raidl, G., Meyer, J.A., Middendorf, M., Cagnoni, S., Cardalda, J. J. R., Corne, D. W., Got-tlieb, J., Guillot, A., Hart, E., Johnson, C. G., Mar-chiori, E., pp. 368-378, Berlin: Springer-Verlag.
[5] O’Neill, M. and Brabazon, A. (2004). Grammatical Swarm, in Proceedings of the Genetic and
Evolu-tionary Computation Conference GECCO 2004,
Lec-ture Notes in Computer Science (3102), Deb et. al. (eds.), Seattle, USA, June 26-30, 2004, 1, pp. 163-174, Berlin: Springer-Verlag.
[6] Shan, Y., McKay, R., Baxter, R., Abbass, H., Essam, D. and Nguyen, H. (2003). Grammar Model Based Program Evolution, in Proceedings of the 2004 IEEE
Congress on Evolutionary Computation, 1, pp.
478-485, IEEE Press: New Jersey.
[7] Altman, E. (1998). The importance and subtlety of credit rating migration, Journal of Banking &
Fi-nance, 22, pp. 1231-1247.
[8] Standard and Poor’s (2002). Standard and Poor’s Rat-ing Services, Statement at US SEC Public HearRat-ing
on the Role and Function of Credit Rating Agencies in the US Securities Markets, 15 November 2002.
[9] Horrigan, J. (1966). The determination of long term credit standing with financial ratios, Journal of
Ac-counting Research, (supplement 1966), pp. 44-62.
[10] Pinches, G. and Mingo, K. (1973). A multivariate analysis of industrial bond ratings, Journal of
Fi-nance, 28(1), pp. 1-18.
[11] Ederington, H. (1985). Classification models and bond ratings, Financial Review, 20(4), pp. 237-262. [12] Gentry, J., Whitford, D. and Newbold, P. (1988).
Pre-dicting industrial bond ratings with a probit model and funds flow components, Financial Review, 23(3), pp. 269-286.
[13] Maher, J. and Sen, T. (1997). Predicting bond ratings using neural networks: a comparison with logistic re-gression, Intelligent Systems in Accounting, Finance
and Management, 6, pp. 23-40.
[14] Dutta, S. and Shekhar, S. (1988). Bond rating: a non-conservative application of neural networks,
Proceed-ings of IEEE International Conference on Neural Net-works, II, pp. 443-450.
[15] Fogel, D. (2000). Evolutionary Computation:
To-wards a new philosophy of machine intelligence, New
York: IEEE Press.
[16] O’Neill, M. (2001). Automatic Programming in an Arbitrary Language: Evolving Programs in Gram-matical Evolution. PhD thesis, University of Limer-ick, 2001.
[17] O’Neill M. and Ryan C. (2001) Grammatical Evolu-tion, IEEE Trans. Evolutionary Computation. 2001. [18] Ryan C., Collins J.J. and O’Neill M. (1998).
Gram-matical Evolution: Evolving Programs for an Arbi-trary Language. Lecture Notes in Computer Science
1391, Proceedings of the First European Workshop on Genetic Programming, pp. 83-95, Springer-Verlag.
[19] Koza, J. (1992). Genetic Programming. MIT Press. [20] Lewin, Benjamin. (2000). Genes VII. Oxford
Univer-sity Press.
[21] Altman, E. (1993). Corporate Financial Distress and
Bankruptcy, New York:John Wiley and Sons Inc.
[22] Morris, R. (1997). Early Warning Indicators of
Cor-porate Failure: A critical review of previous research and further empirical evidence, London: Ashgate
Publishing Limited.
[23] Altman, E. (1968). Financial Ratios, Discriminant Analysis and the Prediction of Corporate Bankruptcy,
[24] Kamstra, M., Kennedy, P. and Suan, T.K. (2001). Combining Bond Rating Forecasts Using Logit, The
Financial Review , 37, pp. 75-96.
[25] Singleton, J. and Surkan, A. (1991). Modeling the Judgment of Bond Rating Agencies: Artificial Intel-ligence Applied to Finance, Journal of the Midwest
Finance Association, 20, pp. 72-80.
[26] Hair, J., Anderson, R., Tatham, R. and Black, W. (1998). Multivariate Data Analysis, Upper Saddle River, New Jersey: Prentice Hall.
[27] Breiman, L., Freidman, J., Olshen, R. and Stone, C. (1984). Classification and Regression Trees, New York: Chapman and Hall.
![Table 1: Rate of default by initial rating category (1987- (1987-2002)(from [8]).](https://thumb-us.123doks.com/thumbv2/123dok_us/8047158.2130872/2.892.534.748.293.442/table-rate-default-initial-rating-category.webp)