Area-level poverty, race/ethnicity & dialysis
star ratings
Abhijit V. Kshirsagar1*, Raj N. Manickam2, Yi Mu2, Jennifer E. Flythe1, Andrew I. Chin3,4,
Heejung Bang2,5,6
1 UNC Kidney Center, Division of Nephrology and Hypertension, University of North Carolina, Chapel Hill,
North Carolina, United States of America, 2 Graduate Group in Epidemiology, University of California, Davis, Davis, California, United States of America, 3 Division of Nephrology, University of California, Davis School of Medicine, Sacramento, California, United States of America, 4 Division of Nephrology, Sacramento VA Medical Center, VA Northern California Health Care Systems, Mather Field, California, United States of America, 5 Division of Biostatistics, Department of Public Health Sciences, University of California, Davis, Davis, California, United States of America, 6 Center for Healthcare Policy and Research, School of Medicine, University of California, Sacramento, Sacramento, California, United States of America *[email protected]
Abstract
The Centers for Medicare and Medicaid Services recently released a five star rating system as part of ‘Dialysis Facility Compare’ to help patients identify and choose high performing clinics in the US. Eight dialysis-related measures determine ratings. Little is known about the association between surrounding community sociodemographic characteristics and star ratings. Using data from the U.S. Census and over 6000 dialysis clinics across the country, we examined the association between dialysis clinic star ratings and characteristics of the local population: 1) proportion of population below the federal poverty level (FPL); 2) propor-tion of black individuals; and 3) proporpropor-tion of Hispanic individuals, by correlapropor-tion and regres-sion analyses. Secondary analyses with Quality Incentive Program (QIP) scores and population characteristics were also performed. We observed a negligible correlation between star ratings and the proportion of local individuals below FPL; Spearman coeffi-cient, R = -0.09 (p<0.0001), and a stronger correlation between star ratings and the propor-tion of black individuals; R = -0.21 (p<0.0001). Ordered logistic regression analyses yielded adjusted odds ratio of 0.91 (95% confidence interval [0.80–1.30], p = 0.12) and 0.55 ([0.48– 0.63], p<0.0001) for high vs. low level of proportion below FPL and proportion of black indi-viduals, respectively. In contrast, a near-zero correlation was observed between star ratings and the proportion of Hispanic individuals. Correlations varied substantially by country region, clinic profit status and clinic size. Analyses using clinic QIP scores provided similar results. Sociodemographic characteristics of the surrounding community, factors typically outside of providers’ direct control, have varying levels of association with clinic dialysis star ratings.
a1111111111 a1111111111 a1111111111 a1111111111 a1111111111
OPEN ACCESS
Citation: Kshirsagar AV, Manickam RN, Mu Y, Flythe JE, Chin AI, Bang H (2017) Area-level poverty, race/ethnicity & dialysis star ratings. PLoS ONE 12(10): e0186651.https://doi.org/10.1371/ journal.pone.0186651
Editor: Vivekanand Jha, Postgraduate Medical Institute, INDIA
Received: May 11, 2017
Accepted: September 25, 2017
Published: October 17, 2017
Copyright:©2017 Kshirsagar et al. This is an open access article distributed under the terms of the Creative Commons Attribution License, which permits unrestricted use, distribution, and reproduction in any medium, provided the original author and source are credited.
Data Availability Statement: Data are publicly available at CMS and US Census websites. The minimal underlying dataset used in this study is available as Supporting Information files.
Introduction
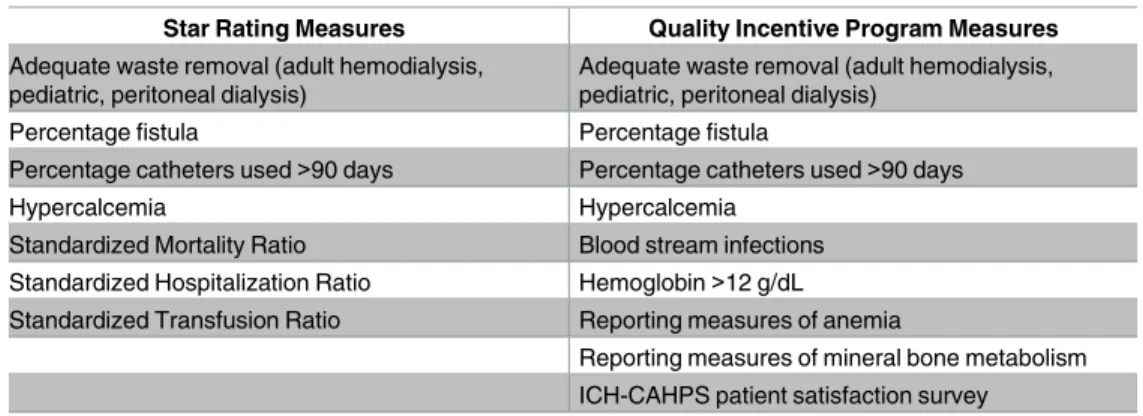
In 2014, the Centers for Medicare and Medicaid Services (CMS) introduced a Five-Star Qual-ity Rating System as part of Dialysis FacilQual-ity Compare (DFC) to help inform patients and care-givers in choosing a dialysis clinic in the United States (US). Released to the public in 2015 and updated in 2016, DFC uses a composite score generated from 8 individual clinical measures to
quantify quality on a scale of 1 to 5 stars [1]: (1) standardized mortality ratio; (2) standardized
transfusion ratio; (3) standardized hospitalization ratio; (4) adequate waste removal for hemo-dialysis; (5) adequate waste removal for peritoneal hemo-dialysis; (6) hypercalcemia; (7) percentage
fistula; and (8) percentage catheters used>90 days. These measures are similar to those
included in the more established End Stage Renal Disease (ESRD) Quality Incentive Program
(QIP) [2].
While some of the measures are adjusted for case-mix, sociodemographic factors and other characteristics of the community surrounding the dialysis center are not considered. However, social determinants of health are known to contribute to disparities in outcomes in chronic
kidney disease [3,4]. For example, it is plausible that inadequate community-level
infrastruc-ture and associated poor access to care may negatively influence quality measures. To date, there has been no assessment of the association of characteristics of the community surround-ing dialysis clinics and dialysis clinic star ratsurround-ing scores.
In this paper, we examined the association of area-level poverty and other local population characteristics with dialysis clinic star ratings. Given the complexity of socioeconomic status and sociodemographic characteristics (e.g., race and ethnicity) in the US, a single benchmark
may not be adequate [5]. Thus, we evaluated the relationship of the star ratings with the
pro-portion of the population within the dialysis clinic census tract for each of the following: 1) below the federal poverty level (FPL); 2) black race; and 3) Hispanic ethnicity. Historically, black race and Hispanic ethnicity are two of the largest disadvantaged racial/ethnic groups in the US. Additionally, we examined the correlation of these 3 population characteristics with the dialysis star ratings by region of the country, dialysis clinic size and clinic profit status. In secondary analyses, we repeated the analyses with clinic QIP scores in place of star ratings. We hypothesized that area-level poverty and minority race/ethnicity, individually, inversely corre-late with the DFC star ratings and QIP scores, and that differences in correlation strengths exist across U.S. regions, dialysis clinic sizes and profit status type.
Materials and methods
Study design and data sources
We used data from the Dartmouth Atlas that defines the dialysis facility area (year 2015) along
with corresponding US Postal Zip codes [1]. Subsequently, geographical mapping was
per-formed with Census Bureau Zip Code Tabulation Areas from the Uniform Data System Map-per,http://udsmapper.org/zcta-crosswalk.cfm. Data on poverty and race were retrieved from the American Community Survey by the Census Bureau, 5-year estimates in 2010–2014. The degrees of poverty and minority populations in a given census tract were determined by the percentage of the population below the FPL, percentage of black population, and percentage of Hispanic population.
Regions were categorized into Northeast, South, Midwest and West based on ESRD net-works. Northeast included Networks 1,2,3, and 4; South included Networks 5,6,7,8,13, and 14; Midwest included Networks 9,10,11, and 12; and West included Networks 15,16,17, and 18. Size of each facility, data available on the DFC website, was categorized into Small, Medium and Large based on the number of total stations (using tertiles; cut-off points of 12 and 20). Inc., Renal Ventures, American Renal Associates,
American Society of Nephrology, Baxter and numerous universities and research funding for studies unrelated to the present study from the Renal Research Institute, a subsidiary of Fresenius Medical Care, North America. The funders had no role in the design and conduct of the study; collection, management, analysis, and interpretation of the data; preparation, review, or approval of the manuscript; and decision to submit the manuscript for publication. The interpretation and reporting of the data are the responsibility of the authors and in no way should be seen as an official policy or interpretation of the US government.
For-profit or non-profit designation was also retrieved from the DFC website,https://data. medicare.gov/data/dialysis-facility-compare.
Three of the seven individual metrics used to calculate the star ratings were adjusted for case-mix. Standardized mortality ratio, standardized hospitalization ratio, and standardized transfusion ratio were adjusted for the following patient characteristics at the level of the dialy-sis clinic: patient age, race, ethnicity, sex, diabetes, duration of ESRD, nursing home status, patient comorbidities at incidence (atherosclerotic heart disease, other cardiac disease, diabe-tes, congestive heart failure, inability to ambulate, chronic obstructive pulmonary disease, inability to transfer, malignant neoplasm, cancer, peripheral vascular disease, cerebrovascular disease, current smoker, alcohol dependence, and drug dependence), calendar year, body mass
index at incidence [6–8]. The institutional review board at the University of California, Davis,
determined the study to be exempt from full IRB review. We included raw data; seeS1 File.
Statistical analyses
Descriptive statistics (including mean, standard deviation, median, inter-quartile range (IQR)) were used to summarize the variables. Spearman correlation coefficients were computed between the DFC star rating and each of the sociodemographic measures (as covariates). All analyses were based on non-missing data; i.e., no imputation was employed. We used simple (bivariate) correlation, unadjusted for other covariates as we were interested in the correlations with ‘final, publicly available’ outcomes that already adjusted for case-mix and other factors. We computed correlation in the entire sample and within different strata/subgroups, pre-defined based on region, profit status, and size.
We used star rating as primary outcome and QIP’s total performance score as secondary
outcome [2]. Both are integer-based scores with star ratings ranging 1–5 and QIP scores
rang-ing 0–100. For both, a higher value is better. See the DFC website, references [2] andTable 1
for more information.
Line graphs were drawn to illustrate the overall relationships between the outcome and key covariates. Simple and multiple linear regressions were fitted to associate the covariates (i.e., percentage of population below the FPL, percentage of black individuals, percentage of His-panic individuals, profit status, region and size) with the number of stars in order to assess relative importance, impact of collinearity and robustness of associations (e.g., direction, mag-nitude, and statistical significance).
Table 1. Comparison of star rating and Quality Incentive Program Measures for payment year 2016. Star Rating Measures Quality Incentive Program Measures
Adequate waste removal (adult hemodialysis, pediatric, peritoneal dialysis)
Adequate waste removal (adult hemodialysis, pediatric, peritoneal dialysis)
Percentage fistula Percentage fistula
Percentage catheters used>90 days Percentage catheters used>90 days
Hypercalcemia Hypercalcemia
Standardized Mortality Ratio Blood stream infections Standardized Hospitalization Ratio Hemoglobin>12 g/dL Standardized Transfusion Ratio Reporting measures of anemia
Ordered logistic regression was performed to assess the association of star ratings and sociodemographic characteristics to account for the ordinal nature of the star ratings. We used SAS 9.4 (SAS Institute, Cary, NC, USA) for data set-up and analyses.
Results
Data for 6,032 dialysis clinics were available for analysis. Summary statistics of clinic and
com-munity characteristics are presented inTable 2. The mean star rating was 3.34 with a median
of 3 (IQR of 3–4) and the median QIP was 60 (IQR 62–76). The Spearman’s correlation coeffi-cient between star rating and QIP score was 0.60. The median proportion of individuals below the FPL was 16.6%, and the median household income was $46,950. The percentage of black and Hispanic individuals had median values of 7.9 and 7.4%, respectively.
Overall, there was a negligible inverse correlation between the dialysis star rating and
per-centage of the population below the FPL, correlation coefficient, R = -0.09 (p<0.0001); see
Table 3. The correlation of star rating and the percentage of black population was R = -0.21
Table 2. Dialysis facility rating and surrounding area-level characteristics.
Variable N Mean (SD) Median (IQR)
Facility Star Rating (primary outcome) 6032 3.34 (1.1) 3 (3–4)
QIP Score (secondary outcome) 5998 68.7 (11.3) 69 (62–76)
Percentage Below Federal Poverty Level 6628 18.25 (10.2) 16.6 (10.5–23.8)
Household Income (US $) 6627 51,599 (20,360) 46,950 (37,788–61,346)
Percentage Black Population 6634 17.7 (22.1) 7.9 (2.4–24.6)
Percentage Hispanic Population 6634 16.6 (21.3) 7.4 (3.1–20.8) SD: standard deviation; IQR: interquartile range; QIP: Quality Incentive Program. QIP file available in the Dialysis Facility Compare website includes 6245 records/provider IDs but 5998 have non-missing QIP scores.
https://doi.org/10.1371/journal.pone.0186651.t002
Table 3. Correlation of dialysis facility rating with measures of surrounding community.
Percentage Below Federal Poverty Level Percentage Black Population Percentage Hispanic Population
Dialysis Star Rating, Overall -0.09 -0.21 0.04 (0.001)
Regions
• Midwest (N = 1490) -0.11 -0.28 0.06 (0.02)
• Northeast (N = 885) -0.18 -0.15 -0.04 (0.27)
• South (N = 2563) -0.04 (0.04) -0.08 0.006 (0.77)
• West (N = 1072) 0.02 (0.5) -0.23 -0.12 (0.0001)
Profit Status
• For Profit (N = 5264) -0.09 -0.19 0.04 (0.002)
• Not For Profit (N = 746) -0.08 -0.33 0.04 (0.24)
Size
• Small (N = 1502a) 0.009 (0.72) -0.26 -0.003 (0.91)
• Medium (N = 2497) -0.08 -0.17 0.07 (0.004)
• Large (N = 2011) -0.13 -0.17 0.09
If P0.0001, actual p-value is indicated in the parenthesis; If P<0.0001, p-value is omitted. P-values are unadjusted. With adjustment for multiple comparisons, a conservative threshold can be used for significance, p = 0.0017 (e.g., 0.05/30). P-value should be interpreted with caution when sample sizes are different.
a
(p<0.0001). The correlation between star rating and percentage of Hispanic individuals was weaker; R = 0.04. The average percentage of population below the FPL in 1 to 5 stars was 19.7, 20.4, 18.4, 17.5 and 17.0%, respectively. The average percentage of black individuals was 22.3,
22.8, 19.2, 15.8 and 11.1%, respectively; seeS1 Fig.
The correlation between clinic star rating and area-level poverty and race composition
dif-fered according to other characteristics (Table 3). The correlation strength varied by region of
the country. In the Northeast, R = -0.18 (p<0.0001) for the star rating and poverty, while in
the West, a near null value was observed, R = 0.02 (p = 0.5). Among small clinics, correlation
with poverty was R0.0 (p = 0.72), while R = -0.13 (p<0.0001) among large clinics. With
regard to star rating and black population, the South showed the lowest correlation and the Midwest/West showed the highest correlation in the absolute scale (R = -0.08 vs. -0.28/-0.23, respectively). Reported profit status of the dialysis clinic also affected the correlation strength between start rating and race: R = -0.33 among non-profit clinics and -0.19 among for-profit clinics. The correlations between star ratings and percentage of black population were gener-ally greater than correlations between star ratings and percentage of population below FPL as
well as between start ratings and percentage of Hispanic individuals (p<0.0001 overall and
within all subgroups).
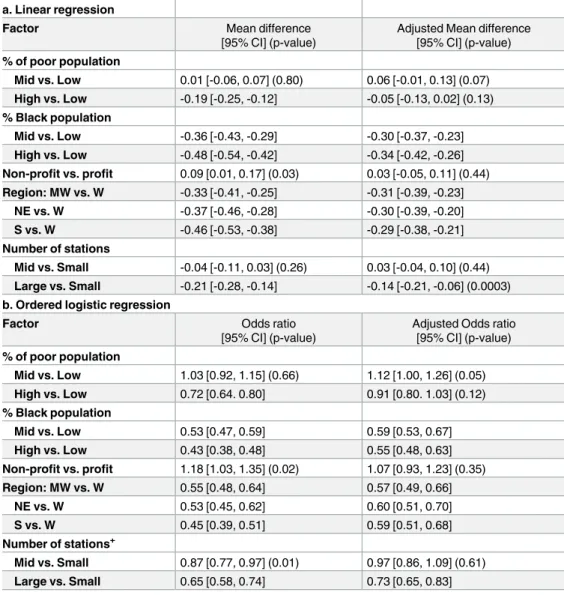
Table 4summarizes the unadjusted (Simple) and adjusted (Multiple) linear regression models with the star rating as continuous outcome and the five covariates. Collinearity appeared to be modest or negligible in that direction of the association was unchanged except for one coefficient near 0, the null value. The percentage of black population yielded a
stron-ger, monotonic association with the outcome, compared to poverty (p<0.0001 for both of
middle vs. low and high vs. low percentage, with difference of0.30 point in average scores of
star ratings). Poverty and size of clinic exhibited some nonlinearity, with smaller differences in
scores (0.01–0.21 in absolute scale), which are also demonstrated inS1 Fig. Non-profit clinics
had slightly higher scores on average (difference of 0.09 with p = 0.03) but when other factors were adjusted in the model, the difference was smaller and no longer statistically significant (0.03 with p = 0.44). Regions of Midwest, Northeast and South showed comparable ratings, all
significantly lower (approximately -0.30, p<0.0001) than the West as referent. Also, large clinic
size was associated with a lower rating, while middle vs. small size comparison showed
statisti-cally non-significant differences (p>0.25).
When we repeated the analyses with the QIP score (Table 1) in place of star rating, we
reached qualitatively similar results. For example, the correlations with percentages of the
pop-ulation below the FPL, black individuals and Hispanic individuals were -0.09 (p<0.0001) and
-0.21(p<0.0001) and 0.02 (p = 0.19), respectively. In addition, when we fitted the ordered
logistic models for star ratings, differences in effect sizes were more pronounced across clinic characteristics. For high and middle level of proportion black, the odds of higher rating versus
lower rating were ~0.57 (p<0.0001) times lower than for low level of proportion black, given
the other variables were held constant. Similar decreases in odds were observed for each of the
three regions vs. West (odds ratio (OR) = 0.57–0.60, p<0.0001). In comparison, the
propor-tion below FPL yielded reduced and inconsistent results (e.g., OR = 0.91 and 1.12, p0.05).
Discussion
To our knowledge, no previous study has examined the association between the surrounding community characteristics and the dialysis star ratings and QIP scores. Programs like the DFC star rating system are part of The National Quality Strategy (NQS) to encourage effective
pub-lic reporting for improving health care [9]. Patients, the target audience for the NQS, are both
the surrounding community, via adjustment or stratification, is not typically factored in these programs over the concern that it may allow clinics providing inferior care to remain under-achieving. Rather, the goal of these programs is to raise all clinics to a high level of care.
Despite recent findings that the proportion of ESRD patients living in communities with poverty is high, our data suggest a weak correlation between dialysis star ratings and
income-based poverty measures [10]. From a clinical and policy perspective, these findings suggest
that there is perhaps a negligible impact of the surrounding community on clinic star ratings. The majority of dialysis patients have Medicare as their primary insurance since the passage of
public law 92–603 in 1972 [11]. Medicare has provided near universal access to dialysis services
for citizens of the US; as such, the ESRD program has been a force to reduce variations in access to care, ostensibly by combining insurance with delivery of comprehensive, clinically
appropriate care [12,13].
Table 4. Simple and multiple regression with outcome of the number of stars (N = 6032). a. Linear regression
Factor Mean difference
[95% CI] (p-value)
Adjusted Mean difference [95% CI] (p-value)
% of poor population
Mid vs. Low 0.01 [-0.06, 0.07] (0.80) 0.06 [-0.01, 0.13] (0.07)
High vs. Low -0.19 [-0.25, -0.12] -0.05 [-0.13, 0.02] (0.13)
% Black population
Mid vs. Low -0.36 [-0.43, -0.29] -0.30 [-0.37, -0.23]
High vs. Low -0.48 [-0.54, -0.42] -0.34 [-0.42, -0.26]
Non-profit vs. profit 0.09 [0.01, 0.17] (0.03) 0.03 [-0.05, 0.11] (0.44)
Region: MW vs. W -0.33 [-0.41, -0.25] -0.31 [-0.39, -0.23]
NE vs. W -0.37 [-0.46, -0.28] -0.30 [-0.39, -0.20]
S vs. W -0.46 [-0.53, -0.38] -0.29 [-0.38, -0.21]
Number of stations
Mid vs. Small -0.04 [-0.11, 0.03] (0.26) 0.03 [-0.04, 0.10] (0.44)
Large vs. Small -0.21 [-0.28, -0.14] -0.14 [-0.21, -0.06] (0.0003)
b. Ordered logistic regression
Factor Odds ratio
[95% CI] (p-value)
Adjusted Odds ratio [95% CI] (p-value)
% of poor population
Mid vs. Low 1.03 [0.92, 1.15] (0.66) 1.12 [1.00, 1.26] (0.05)
High vs. Low 0.72 [0.64. 0.80] 0.91 [0.80. 1.03] (0.12)
% Black population
Mid vs. Low 0.53 [0.47, 0.59] 0.59 [0.53, 0.67]
High vs. Low 0.43 [0.38, 0.48] 0.55 [0.48, 0.63]
Non-profit vs. profit 1.18 [1.03, 1.35] (0.02) 1.07 [0.93, 1.23] (0.35)
Region: MW vs. W 0.55 [0.48, 0.64] 0.57 [0.49, 0.66]
NE vs. W 0.53 [0.45, 0.62] 0.60 [0.51, 0.70]
S vs. W 0.45 [0.39, 0.51] 0.59 [0.51, 0.68]
Number of stations+
Mid vs. Small 0.87 [0.77, 0.97] (0.01) 0.97 [0.86, 1.09] (0.61)
Large vs. Small 0.65 [0.58, 0.74] 0.73 [0.65, 0.83]
If P0.0001, actual p-value is indicated in the parenthesis; If P<0.0001, p-value is omitted. High vs. Mid vs. Low were categorized using tertiles. CI: confidence interval.
On the other hand, these data demonstrate complexity with regard to the influence of the surrounding community on clinic quality scores. When race composition of surrounding communities is examined, there is stronger, albeit modest, inverse association with the star rat-ings with black race. For example, we found a surrounding community population of black race of 22% in clinics with the lowest star rating versus 11% in the highest star rating. The direction and absolute value of correlations remain consistent across most regions, clinic sizes, and profit status types suggesting that even with closer to universal access to health care via Medicare, differences by race might still exist. In contrast, we observed negligible associations of poverty status and Hispanic ethnicity with star ratings. Such findings are similar to those
previously demonstrated for other quality metrics [14–16].
Also, previous studies have demonstrated differences by race in Medicare beneficiaries; one study showed higher than expected mortality in dialysis facilities that served large numbers of
black patients [17], while another study in a different Medicare population demonstrated that
black beneficiaries had increased mortality and lower use of services [18]. In other single payer
systems with universal coverage like the Veterans Affairs system, similar black-white
dispari-ties exist, though these differences may be decreasing [19,20]. Surprisingly, the strongest
corre-lation coefficient (in absolute value) appeared in areas that traditionally have a low proportion
of blacks—the Midwest and West, while the correlation was weaker in the South (>0.2 vs.
<0.1 in absolute value). We speculate a degree of neighborhood segregation by race might
play a role in our findings; however, further delineation of this issue was beyond study scope
[21].
Over the last decade, participants in the ESRD program have been at the forefront of the transition from traditional fee-for-service to value-based care. As such, dialysis providers and networks have faced an environment of pay-for-performance, including expanded capitated reimbursement (the ESRD Prospective Payment System) and a QIP with quality measures
updated every few years [2,22,23]. While the goal of the DFC star rating system is to promote
informed patient choice, it may affect payments in two ways. First and most directly, clinics may lose patients in a market where other choices exist, especially in high population metro-politan areas. However, the extent of loss may be tempered by recent data showing
consolida-tion of dialysis clinics and perhaps less choice [24]. Second, the star rating metrics have
considerable overlap with those of the QIP. Dialysis clinics receive penalties of up to 2% of pay-ment for services for failing to meet national or within-facility improvepay-ment targets in the QIP. Vascular access, anemia, bone and mineral metabolism, and dialysis adequacy represent measures in both DFC and QIP. Of these 4 areas, anemia management may be controlled by providers and dialysis facility decisions regarding erythropoiesis stimulating agents and iron administration. The other three–vascular access, bone and mineral metabolism, and dialysis adequacy–may be more susceptible to the impact of community infrastructure such as limited
food choices and lack of specialty surgical care [25–29]. Furthermore, the type of vascular
access leads to down-stream effects that also determine QIP metrics, including adequacy,
cath-eter rates, hospitalizations and mortality [30,31].
correlations and associations, not causation. However, it is widely perceived that
sociodemo-graphic and economic status is an important social determinant of health outcomes [32].
Fourth, we merged and analyzed publically available data, so we could not investigate the rea-sons for missing data and impact of possible selection bias. However, the missing data of star ratings and QIP scores were higher in non-profit and small facilities and lowest in the West
region based on descriptive statistics; SeeS1 Tablefor more information. Finally, we used a
single measure of FPL for all states–for a family of 4 in 2016, $24,300 per year. While this mea-sure is the most widely used and updated for inflation using the Consumer Price Index, the FPL has different implications for different regions of the country. In areas with very high cost of living, this would pose a greater challenge than less costly regions, and may underestimate the impact of poverty on star ratings. Along the same line, zip codes are not perfect proxies for the sociodemographic characteristics of neighborhoods; homogeneity within a zip code is not necessarily the case.
Conclusion
In summary, the DFC star rating is a new program meant to facilitate patient choice and reduce variation in the quality of care at dialysis clinics. This study suggests some characteris-tics of the community surrounding the dialysis clinic might influence the ratings, such as pro-portion of individuals of black race and geographic region in the country. We also identified factors that seem to have minimal influence on the rating (e.g., poverty, Hispanic, profit status and size of clinic). The practical implications of the observed effect sizes (the degree of correla-tion, odds ratio, difference in star rating) are unclear given some weak associations; thus more discussions are warranted. Additional analyses using more granular data are needed to more fully understand the influence of local area characteristics on star ratings and other clinical quality measures in dialysis. As healthcare in the US continues to move towards value-based purchasing and the incorporation of the patient voice, it is vital to understand the execution of programs like DFC in real-world settings.
Supporting information
S1 Fig. Star ratings in different subgroups.
a) Percents of poor and black populations per star rating
b) Star rating per percent poor (below Federal Poverty Level) or black population;
c) Star rating per dialysis clinic profit status (P = for profit; NP = not for profit) and size; and
d) Star rating per region. (DOCX)
S1 Table. Characteristics in groups with missing vs. non-missing star rating.
a) by profit status;
b) by size;
c) by region; and
d) for continuous variables (poverty-level, % of black, % of Hispanic, median income). (DOCX)
Author Contributions
Conceptualization: Abhijit V. Kshirsagar.
Data curation: Raj N. Manickam.
Formal analysis: Raj N. Manickam, Heejung Bang.
Investigation: Yi Mu, Andrew I. Chin.
Methodology: Raj N. Manickam, Yi Mu, Heejung Bang.
Supervision: Abhijit V. Kshirsagar, Jennifer E. Flythe, Andrew I. Chin, Heejung Bang.
Writing – original draft: Abhijit V. Kshirsagar.
Writing – review & editing: Abhijit V. Kshirsagar, Raj N. Manickam, Yi Mu, Jennifer E. Flythe, Andrew I. Chin, Heejung Bang.
References
1. Dialysis Facilities Compare Ratings Refresh. https://www.cms.gov/Medicare/End-Stage-Renal-Disease/ESRDGeneralInformation/Downloads/2016-Dialysis-Facility-Compare-Star-Ratings-Refresh. pdf. Accessed May 9, 2017.
2. Centers for Medicare and Medicaid Services (CMS), HHS. Medicare program; end-stage renal disease prospective payment system, quality incentive program, and bad debt reductions for all Medicare pro-viders; proposed rule. Fed Regist. 2012; 77(133):40952–1000.
3. World Health Organization. Social determinants of health.http://www.who.int/topics/social_ determinants/en/. Accessed May 9, 2017.
4. Norton JM, Moxey-Mims MM, Eggers PW, Narva AS, Star RA, Kimmel PL, Rodgers GP. Social deter-minants of racial disparities in CKD. J Am Soc Nephrol 2016; 27:2576–95.https://doi.org/10.1681/ASN. 2016010027PMID:27178804
5. Krumholz HM, Bernheim SM. Considering the role of socioeconomic status in hospital outcomes mea-sures. Ann Intern Med 2014; 161:833–4.https://doi.org/10.7326/M14-2308PMID:25437411 6. Measure information form: Standardized Mortality Ratio.https://dialysisdata.org/sites/default/files/
content/ESRD_Measures/SMR_MIF.pdfAccessed May 9, 2017.
7. Report for the standardized transfusion ratio. https://www.cms.gov/Medicare/Quality-Initiatives-Patient-Assessment-Instruments/ESRDQIP/Downloads/
MeasureMethodologyReportfortheProposedSTrRMeasure.pdfAccessed May 9, 2017.
8. Technical notes on the standarized hospitalization ratio.https://dialysisdata.org/sites/default/files/ content/Methodology/SHRDocumentation.pdf. Accessed May 9, 2017.
9. Agency for Healthcare Quality and Research. About the National Quality Strategy.https://www.ahrq. gov/workingforquality/about.htm. Accessed May 9, 2017.
10. Garritty BH, Kramer H, Vellnki K, Leehey D, Brown J, Shoham DA. Time trends in the association of ESRD incidence with area-level povery in the US population. Hemodial Int 2016; 20:78–83.https://doi. org/10.1111/hdi.12325PMID:26094617
11. Compilation of Social Security Laws.https://www.ssa.gov/OP_Home/comp2/F092-603.html. Accessed May 9, 2017.
12. Daumit GL, Hermann JA, Coresh J, Powe NR. Use of cardiovascular procedures among black persons and white persons: a 7-year nationwide study in patients with renal disease. Ann Intern Med 1999; 130:173–82. PMID:10049195
13. Cook NL, Mensah GA. Eliminating health disparities. What can we learn from the Veterans Health Administration? Circulation 2015; 132:1519–21.https://doi.org/10.1161/CIRCULATIONAHA.115. 018953PMID:26384520
14. Bernheim SM, Parzynski CS, Horwitz L, Lin Z, Araas MJ, Ross JS, et al. Accounting for patients’ socio-economic status does not change hospital readmission rates. Health Affairs. 2016; 8:1461–70.
16. Manickam RN, Mu Y, Kshirsagar A, Bang H. Area-level poverty and excess hospital readmission ratio. Am J Med. 2017; 130(4):e153–5.https://doi.org/10.1016/j.amjmed.2016.08.047PMID:28325228 17. Hall YN, Xu P, Chertow GM, Himmelfarb J. Characteristics and performance of minority serving dialysis
facilities. Health Serv Res 2014; 49:971–91.https://doi.org/10.1111/1475-6773.12144PMID:
24354718
18. Gornick ME, Eggers PW, Reilly TW, Mentnech RM, Fitterman LK, Kucken LE, Vladeck BC. Effects of race and income on mortality and use of services among Medicare beneficiaries. N Engl J Med 1996; 335:791–99.https://doi.org/10.1056/NEJM199609123351106PMID:8703185
19. Saha S, Freeman M, Toure J, Tippens KM, Weeks C. Racial and ethnic disparities in the VA healthcare system: A systematic seview. J Gen Intern Med 2008; 23:654–71. https://doi.org/10.1007/s11606-008-0521-4PMID:18301951
20. Kovesdy CP, Norris KC, Boulware LE, Lu JL, Ma JZ, Streja E, et al. Association of race with mortality and cardiovascular events in a large cohort of US Veterans. Circulation 2015; 132:1538–48.https://doi. org/10.1161/CIRCULATIONAHA.114.015124PMID:26384521
21. Iceland J, Sharp G, Timberlake JM. Sun belt rising: regional population change and the decline in black residential segregation, 1970–2009. Demography 2013; 50:97–123. https://doi.org/10.1007/s13524-012-0136-6PMID:22965374
22. ESRD Quality Incentive Program. https://www.cms.gov/Medicare/Quality-Initiatives-Patient-Assessment-Instruments/ESRDQIP/Downloads/ESRDQIPSummaryPaymentYears2014-2018.pdf. Accessed May 9, 2017.
23. Centers for Medicare & Medicaid Services (CMS), HHS, Medicare program: 42 CFR Parts 410, 413 and 414 Medicare Program; End-Stage Renal Disease Prospective Payment System; Final Rule and Proposed Rule. Fed Regist 2010; 75(155):49030–214.
24. Erickson KF, Zheng Y, Winkelmayer WC, Ho V, Bhattacharya J, Chertow GM. Consolidation in the dial-ysis industry, patient choice, and local market competition. Clin J Am Soc Nephrol 2017; 12:536–45.
https://doi.org/10.2215/CJN.06340616PMID:27831510
25. Walker RE, Keane CR, Burke JG. Disparities and access to healthy food in the United States: A review of food deserts literature. Health Place 2010; 16:876–84.https://doi.org/10.1016/j.healthplace.2010.04. 013PMID:20462784
26. Moore LV, Diez Roux AV. Associations of neighborhood characteristics with the location and type of food stores. Am J Public Health 2006; 96:325–31.https://doi.org/10.2105/AJPH.2004.058040PMID:
16380567
27. Hilmers A, Hilmers DC, Dave J. Neighborhood disparities in access to healthy foods and their effects on environmental justice. Am J Public Health 2012; 102:1644–54.https://doi.org/10.2105/AJPH.2012. 300865PMID:22813465
28. Bower KM, Thorpe RJ Jr, Rohde C, Gaskin DJ. The intersection of neighborhood racial segregation, poverty, and urbanicity and its impact on food store availability in the United States. Prev Med 2014; 58:33–9.https://doi.org/10.1016/j.ypmed.2013.10.010PMID:24161713
29. Nee R, Moon DS, Jindal RM, Hurst FP, Yuan CM, Agodoa LY, Abbott KC. Impact of poverty and health care insurance on arteriovenous fistula use among incident hemodialysis patients. Am J Nephrol 2015; 42:328–36.https://doi.org/10.1159/000441804PMID:26569600
30. Astor BC, Eustace JA, Powe NR, Klag MJ, Fink NE, Coresh J. Type of vascular access and survival among incident hemodialysis patients: the Choices for Healthy Outcomes in Caring for ESRD (CHOICE) Study. J Am Soc Nephrol 2005; 16:1449–55.https://doi.org/10.1681/ASN.2004090748
PMID:15788468
31. Chand DH, Teo BW, Fatica RA, Brier M. Influence of vascular access type on outcome measures in patients on maintenance hemodialysis. Nephron Clin Pract 2008; 108:c91–8.https://doi.org/10.1159/ 000113525PMID:18212514