DEVELOPMENT, REFINEMENT, AND APPLICATION OF ELECTROCHEMICAL
METHODS FOR EVALUATING FUEL-FORMING CATALYSTS
Katherine J. Lee
A dissertation submitted to the faculty of the University of North Carolina at Chapel Hill
in partial fulfillment of the requirements for the degree of Doctor of Philosophy in the
Department of Chemistry.
Chapel Hill
2020
Approved by:
Jillian Dempsey
Joseph Templeton
Gerald Meyer
Matthew Lockett
ABSTRACT
Katherine J. Lee: Development, Refinement, and Application of Electrochemical Methods for Evaluating Fuel-Forming Catalysts
(Under the direction of Jillian L. Dempsey)
The growing impact of climate change has fueled decades of research into renewable
energy-based alternatives to fossil fuels. Homogeneous, molecular transition metal complexes have potential
widespread application as fuel-forming catalysts as well as charge carriers in electrochemical energy
storage technologies. One particularly appealing aspect of these complexes is their tunable ligand
architecture which, when coupled with rigorous mechanistic analysis, can afford a high degree of control
over molecular properties. Unfortunately, the electrochemical data that is the bedrock of this rigorous
mechanistic analysis is often complicated by extrinsic factors or side reactivity. While recent advances in
electroanalytical strategies have left us well-poised to evaluate catalytic mechanisms and kinetics, the
question of how these tools can be exploited to identify side reactivity has been rendered comparatively
out of vogue leaving it difficult to deconvolute and develop strategies to avoid these side pathways.
This work has sought to improve the toolbox available for molecular electrochemists working with
homogeneous transition metal complexes. One aspect of this research focuses on critically evaluating
side reactivities which can greatly complicate electrochemical analysis of seemingly well-behaved
systems. This work documents the challenges of reversible in situ solubility changes under
electroanalytical conditions, where a change in redox state or the addition of substrate instigates the
aggregation and precipitation of the transition metal complex while maintaining the integrity of the
molecular core. A second aspect has been exploring new strategies for studying multi-electron
fuel-forming transformations using rotating disc electrochemistry. As a whole, this research has been built on
a single fundamental premise: that electrochemical analysis of transition metal complexes is often
ACKNOWLEDGEMENTS
My time in graduate school has been wonderful, stressful, and generally bizarre. I write this while
sitting on my floor in the midst of a global pandemic a day after it was a declared a class 2 misdemeanor
to leave the house for non-essential purposes. Through all of the ups and downs, there have been many
wonderful people who have supported me and who have helped me become the researcher and person I
am today.
I would like to thank all of the amazing friends and mentors who supported me during my
undergraduate years. Bridget Connor and Katie Fisher, thank you for showing me the importance of
camaraderie and selflessness in science. Oliver, it cannot be overemphasized how much you helped me
become the chemist I am today. To all the professors who let me into their labs, those experiences were
some of the best in my life and the lessons I learnt – both chemistry and otherwise – will stick with me for
the rest of my life.
My lab is filled with some of the most amazing and supportive people on the planet and nothing
has helped crystallize how insanely lucky I am to work with them than pulling together a thesis during a
pandemic. The sheer outpouring of support from my lab mates helped me get through one of the most
crazy and stressful experiences of my life and their unwavering encouragement and support has made
my entire grad school journey infinitely better. Melody, your kindness, patience, and bravery are second
to none and I have truly cherished our friendship. Carolyn, you are the most adult person I have ever met
and your leadership in lab has helped me so much over the years. Tayliz, your ability to balance sass with
a genuine desire to foster a supportive environment is a rare skill which has made the lab a far more fun
and welcoming place. Dan, your enthusiasm for science is contagious and has always been a breath of
fresh air in an environment so often filled with cynicism. Robin and Thomas, you made that first year a ton
of fun and served as incredible (and glittery) role models. Tao, your enthusiasm and patience as a mentor
have given so much to this lab and your dedication, attention to detail, and mentorship has made it a far
better place. Kedy, you have a smile that can light up a room and a big heart to match it, thanks for being
so awesome!
To all members of team echem, past and present, you will always hold a special place in my
heart. I was incredibly fortunate during my first two years here to work with some of the best
electrochemists and people in the world. Brian, Eric, and Noémie, I would have accomplished a fraction of
what I have if I hadn’t had all of you to look up to and learn from. I have done my best to carry on your
legacy and have spent five years striving to be half the electrochemist and mentor that all of you are.
Debanjan, it was beyond a blessing to have you join the lab and I am so thankful that I have had the
opportunity to work alongside you. Your skills as a teacher are second only to your generosity. Sean, I am
so thankful that you came into our lab. You have made the last year here infinitely better (if for no other
reason than saving me from doing that god forsaken ligand synthesis). Aldo, it has been a pleasure to
see you grow as a person and a chemist over the last two years. Brittany, it was approximately five
minutes after meeting you that I decided I had to have you as heir apparent and you have not
disappointed. You are one of the nicest, most dedicated, and most supportive mentees and lab mates
one could hope for. I sleep far better at night knowing that the fate of team echem is in your hands. And
thanks for the sword!
I have had the opportunity to work with two amazing undergraduates during my time here. Cole,
your work ethic is insane and it was amazing to work with you on the RDE paper (now go get some
sleep). Kunal, agreeing to mentor you was one of the best choices I made during graduate school and
has made me a better chemist and person. I was initially hesitant to adopt an undergraduate, so the
amount I have enjoyed my time mentoring you is truly a testament to both your skills as a chemist and the
content of your character. You have a bright future ahead and can’t wait to see where you end up!
I’d like to thank the many people outside of my lab who have made my world a far better place.
Sara, living with you those first two years was probably the only thing that kept me mildly sane and I will
forever cherish our time together. Andrew Camp, you are a literal saint who has always been there for me
when I needed you most. Your general level of Zen is probably one of the few things that has helped
an immense amount of fun collaborating with you over the years. Working with you afforded me a number
of unique experiences that I will forever be thankful for; graduate school certainly would have been far
less interesting without you (and thanks for the ducks!). To Jean-Michel Savéant, you have absolutely no
idea who I am, but you have served as an inspiration for both my chemistry and my naming of stuffed
animals that sat at my desk and judged me.
Heather and Thomas, I actually don’t think I could have done this (in both a physical and logistical
sense) without your support and generosity. Your decision to let Kevin and I into your home may have
actually saved us from death and definitely saved us from being bankrupted by Airbnb. You are both truly
amazing people and I feel so lucky to have had you (and your puppies) in my life. Kevin, we went through
hell and back and came out the other side with nothing but a few bruises (and a sword!). You helped keep
me centered when work seemed overwhelming and were always there for me when I needed you most.
Love you to the moon and back!
My Dad always taught me the importance of family and at no time has this been truer than during
graduate school. I want to thank my Mum for always having the time to listen to my problems and my Dad
for cutting me off and forcing me to come up with solutions. You two have been my bedrock throughout
my life and I would not have made it this far without your unwavering love and support. Angela, your
kindness, thoughtfulness, and compassion have never failed to make my life brighter even in times of
adversity. You are already one of my best friends and I am so excited for you to become my sister! To
Angela’s mum, I would like to thank you for your amazing lasagna and the amazing spirit you have to
match. Andrew, it is impossible to put into words how much you helped make me who I am and how
thankful I am that you are my brother. To my entire family, near and far, please know that each and
everyone one of you has brought me so much joy and I am astoundingly lucky to have you in my life.
Jillian, thank you for being an amazing mentor and person. The lessons you have taught me
extend far beyond chemistry. Most importantly, you taught me that being successful as a woman in
science does not require discarding our empathy, kindness, and commitment to family. Your unwavering
support has meant more to me than you can ever know and I can only hope that one day I can be as
And last, but certainly not least, I would like to thank that one bookstore owner who – when I was
in the middle of an existential crisis – gave me the Island of the Sequined Love Nun which serves as a
TABLE OF CONTENTS
LIST OF TABLES ... xiv
LIST OF FIGURES ... xv
LIST OF SCHEMES ... xl LIST OF ABBREVIATIONS... xli LIST OF SYMBOLS ... xliii CHAPTER 1. Introduction ... 1
1.1 Fundamentals of Electrochemical Analysis of Redox Reactions ... 2
1.1.1 Mass Transfer ... 2
1.1.2 Overview of Potential Sweep Methods: Cyclic Voltammetry and Linear Sweep Voltammetry .... 3
1.1.3 Fundamentals of Voltammetry: Electron Transfer to a Homogeneous Analyte ... 4
1.1.4 Coupled Homogeneous Chemical Reactions ... 6
1.1.5 Overview of Potential Step Methods ... 8
1.2 Evaluation of Molecular Catalysts for Electrochemical Reactions via Cyclic Voltammetry ... 8
1.2.1 Dimensionless Parameters for an EC′ Catalytic Responses ... 9
1.2.2 Plateau Current Analysis... 10
1.2.3 Foot-of-the-Wave Analysis ... 11
1.2.4 Peak Shift Analysis ... 13
1.3 Solubility Changes During Electrochemical Trials ... 14
1.3.1 Modification of the Electrode Properties upon Deposition ... 14
1.3.2 Identifying Electrodeposition Under Catalytic Conditions ... 15
1.3.3 Rinse Tests and Metastable Material ... 21
1.4 Rotating Disc Electrode Voltammetry: Analysis of Homogeneous Species and Catalysts ... 24
1.4.1 Fundamentals of Rotating Disc Electrodes ... 24
1.4.3 Analysis of EC′ Catalytic Mechanisms via RDE Voltammetry ... 27
1.5 Dissertation Overview ... 32
CHAPTER 2. Identification of an Electrode-Adsorbed Intermediate in the Catalytic H2 Evolution Mechanism of a Cobalt Dithiolene Complex ... 33
2.1 Introduction ... 33
2.2 Results and Discussion ... 34
2.2.1 Electrochemistry of [NBu4][Co(bdt)2] in CH3CN ... 34
2.2.2 Optical Monitoring and Rinse Tests Reveal Protonation-Initiated Heterogenization ... 38
2.2.3 Investigating the Structure of the Black Precipitate and Film ... 42
2.2.4 Mechanistic Considerations ... 46
2.3 Conclusion ... 49
2.4 Experimental ... 49
2.4.1 General Considerations ... 49
2.4.2 Electrochemical Methods ... 50
CHAPTER 3. Reversing the Electrochemically-Driven Heterogenization of Molecular Transition Metal Complexes via Redox Mediators ... 51
3.1 Introduction ... 51
3.2 Reduction-initiated chemical reactivity of [Ni(PPh2NPh2)2]2+ ... 52
3.2.1 Cyclic voltammetry of [Ni(PPh2NPh2)2]2+ ... 52
3.2.2 Formation of [Ni(PPh2NPh2)2] leads to heterogeneous deposits on electrode surface ... 54
3.2.3 Mechanism of electrodeposition ... 56
3.2.4 Electrochemistry of modified electrodes reveals precipitation of [Ni(PPh2NPh2)2] ... 58
3.3 Redox-Mediators Enhance Oxidation of Heterogeneous [Ni(PPh2NPh2)2] ... 60
3.3.1 Electrochemistry of [Ni(PPh2NPh2)2]2+ in the Presence of Ferrocene ... 61
3.3.2 Ferrocene-catalyzed film removal ... 63
3.3.3 Competition between electrochemical and Fc-mediated oxidation ... 67
3.4 Conclusion ... 69
3.5 Experimental ... 70
3.5.2 Electrochemical Methods. ... 70
3.5.3 Spectroelectrochemistry Methods. ... 70
CHAPTER 4. Analysis of multistep homogeneous catalysis by rotating disc electrode voltammetry ... 72
4.1 Introduction ... 72
4.2 Waveshape analysis and mathematical modelling for homogeneous catalysis ... 73
4.2.1 Theoretical approaches for modeling electrochemical processes at the RDE ... 73
4.2.2 Current-potential behavior calculated by the Nernst Diffusion Layer and Hale approach ... 76
4.2.3 Governing parameters for an ECEC′ process ... 78
4.2.4 Additional considerations for multistep processes – Incomplete catalysis ... 80
4.3 Experimental analysis of a HER catalyst by RDEV ... 81
4.3.1 Mechanism of H2 production by Co(dmgBF2)2(CH3CN)2 ... 82
4.3.2 Electrochemistry of Co(dmgBF2)2(CH3CN)2 ... 83
4.3.2 Electrochemistry of Co(dmgBF2)2(CH3CN)2 in the presence of acid ... 83
4.3.3 Qualitative trends upon varying acid pKa, acid concentration, and rotation rate ... 85
4.3.5 Plateau current and foot-of-the-wave analysis for multi-step catalysis at the RDE ... 88
4.3.6 Avenues for future work ... 91
4.4 Obstacles to the application of RDEV to homogeneous catalysis ... 93
4.4.1 Evolution of solution ... 93
4.4.2 Modification of glassy carbon electrodes ... 97
4.4.3 Inclined plateau currents introduce quantitative uncertainty ... 101
4.5 Conclusions ... 103
4.6 Experimental ... 104
4.6.1 General Considerations. ... 104
4.6.2 Electrochemical Methods ... 105
CHAPTER 5. Exploring the Reactivity and Stability of Platinum(III) Diimine Cation Radicals ... 106
5.1 Introduction ... 106
5.2 Results and Discussion ... 110
5.2.2 One-electron oxidation of (bpy)Pt(CH3)2 induces methyl transfer... 114
5.2.3 Possible oxidative disproportionation pathways, evaluating the role of solvent ... 117
5.2.4 Monitoring chemical oxidation via NMR indicates more complex reactivity ... 120
5.3 Conclusion ... 121
5.4 Experimental ... 122
5.4.1 General Considerations. ... 122
5.4.2 Electrochemical Methods. ... 122
5.4.3 Spectroelectrochemistry Methods. ... 122
APPENDIX A | SUPPLEMENTAL INFORMATION FOR CHAPTER 2 ... 123
A.1 Electrochemistry of [NBu4][Co(bdt)2] with Para-Substituted Aniliniums ... 123
Cyclic Voltammograms of [NBu4][Co(bdt)2] with Varying Anilinium Concentrations ... 123
Scan Rate Dependence of [NBu4][Co(bdt)2] with One Equivalent Anilinium ... 124
Cyclic Voltammograms of [NBu4][Co(bdt)2] with Para-substituted Aniliniums ... 125
Cyclic Voltammograms of [NBu4][Co(bdt)2] Concentration Dependence Trials ... 128
A.2 Spectroscopic Monitoring of Precipitation and Visualization of Film in Acidic Solutions ... 131
A.3 Rinse Test Data ... 133
Control Experiment After Pretreating in a Solution Containing Only Anilinium ... 133
Rinse Test After Pretreating in Solution Containing Only [NBu4][Co(bdt)2] ... 134
Rinse Test After Pretreating in Solution Containing [NBu4][Co(bdt)2] and 4-chloroanilinium ... 134
Rinse Tests To Determine Whether Deposition is Unique to 4-chloroanilinium ... 135
Rinse Tests with Scanning Solution of 2.5 mM para-substituted Aniliniums Series ... 137
A.4 Reactivity with N,N,N-trimethylbenzenaminium tetrafluoroborate ([An-(CH3)3][BF4]) ... 139
Control Experiment After Pretreating in a Solution Containing Only ([An-(CH3)3][BF4]) ... 139
Rinse Test After Pretreating in Solution Containing [NBu4][Co(bdt)2] and ([(An-CH3)3][BF4]) ... 139
Cyclic Voltammogram of [NBu4][Co(bdt)2] with ([An-(CH3)3][BF4]) ... 140
Optically Monitoring Degradation with [An-(CH3)3][BF4] ... 141
A.5 X-Ray Photoelectron Spectroscopy Data ... 142
Determining Film Stability Under Acidic Conditions ... 150
Determining Film Stability Under Basic Conditions... 150
Determining Film Stability Under Reducing Conditions ... 151
Large Scale Rinse Tests using Glassy Carbon Plates for UV-vis Analysis ... 152
Binding of Isolated Black Particulates to Glassy Carbon Working Electrodes ... 153
APPENDIX B | SUPPLEMENTAL INFORMATION FOR CHAPTER 3 ... 155
B.1 Cyclic voltammetry of [Ni(PPh 2NPh2)2]2+ ... 155
Variable scan rate cyclic voltammograms ... 155
Cathodic peak currents as a function of scan rate ... 156
Diffusion coefficient of [Ni(PPh2NPh2)2]2+ ... 158
Concentration dependence voltammetry ... 160
B.2 Establishing the mechanism of deposition ... 161
Additional evidence for EEC reactivity ... 161
Additional evidence of film formation ... 163
B.3 Evidence for metastability of the deposited material ... 165
Deposited material is weakly-adsorbed ... 165
Partial oxidation decreases film stability ... 166
B.4 Additional information for induction period studies ... 168
Determining whether complete passivation is observed during induction periods ... 168
Monitoring the loss of the ferrocene cathodic peak during ferrocene titrations ... 169
APPENDIX C | MATHEMATICAL BACKGROUND FOR CHAPTER 4 ... 171
C.1 Modeling an ECEC′ Mechanism at the RDE: The Hale and Nernst Diffusion Layer Approach ... 171
Convection-diffusion equations for an ECEC′ mechanism ... 171
Derivation of the Hale Approach ... 173
Derivation of the Nernst Diffusion Layer Approach ... 175
C.2 Overview of Numerical Methods ... 177
Computational Details Associated with the Hale Approach ... 177
C.3 Convergence of the Nernst Diffusion Layer and Hale Approach ... 180
C.4 Derivations of Plateau Current and FOWA for an ECEC′ Mechanism at the RDE ... 183
APPENDIX D | SUPPLEMENTAL EXPERIMENTAL DATA FOR CHAPTER 4 ... 186
D.1 Determination of Diffusion Coefficient via RDEV and Comparison to Stationary Methods ... 186
D.2 Effects of Acid Identity, Concentration, and Rotation Rate on Catalytic Voltammograms ... 187
Extracting figures of merit from catalytic voltammograms ... 187
Plateau currents as a function of acid concentration ... 188
D.3 Extracting kinetic information using foot-of-the-wave analysis... 194
Evaluation of simulated voltammograms using FOWA ... 194
Impact of relative rate constants on FOWA for simulated voltammograms ... 200
Application of FOWA to experimental data ... 208
D.4 Evolution of Solution Composition ... 210
D.5 Electrochemical Monitoring of Electrode Properties ... 212
Intermediate stationary voltammograms recorded during variable rotation rate trials ... 212
Evaluating electrode modification in the absence of RDEV ... 217
D.6 Electrochemical reduction of acids by glassy carbon ... 219
APPENDIX E | SUPPLEMENTAL EXPERIMENTAL DATA FOR CHAPTER 5 ... 222
E.1 Electrochemistry of (bpy)Pt(CH3)2 in acetonitrile ... 222
Diffusion Coefficient of (bpy)Pt(CH3)2 ... 222
Peak shift analysis for anodic feature A ... 222
Evaluating the role of trace water ... 224
E.2 Mechanistic Analysis ... 224
Spectroelectrochemistry ... 224
Monitoring the chemical oxidation via 1H NMR ... 227
LIST OF TABLES
Table 4.1 Ψ∞ values for variable rotation rate studies (42 – 262 rad sec-1) ... 85
Table A.1 XPS elemental analysis summary of atomic ratio percentages ... 149
Table B.1 Linear fits for ip,c[NiII/I] vs. υ1/2 and calculated diffusion coefficients... 159
Table D.1kFOWA for case A1 ... 196
Table D.2kFOWA for case A2 ... 197
Table D.3kFOWA for case A3 ... 198
Table D.4 Comparison of rate constants calculated using FOWA for simulations varying ΔE ... 200
Table D.5kFOWA for case B1 ... 202
Table D.6kFOWA for case B2 ... 203
Table D.7kFOWA for case B3 ... 204
Table D.8 Comparison of rate constants calculated using FOWA for RDE simulations varying k1/k2 ... 205
Table D.9kFOWA for 4-methoxyanlinium RDE simulations ... 207
Table D.10 kFOWA for simulations of 4-methoxyanilinium and 4-trifluoromethoxyanilinium ... 208
LIST OF FIGURES
Figure 1.1 Cyclic voltammogram for the reversible, one-electron reduction of a diffusional species. As the potential is scanned in the negative direction, reduction of the analyte results in a cathodic current which peaks at a potential Ep,c with a current ip,c. The formal
reduction potential (Eo′) is denoted by the dashed green line. As commonly employed,
the non-IUPAC convention for potential and current axes is used throughout this
manuscript. ... 5
Figure 1.2 Example of the impact of heterogeneous electron transfer kinetics on a one-electron redox couple. A fully reversible redox couple with a ΔEp of 57 mV is observed
with a ks value of 10000 cm s-1 (grey). Peak-to-peak separation increases for ks values
of 0.01 (red) and 0.001 (blue) cm s-1. Scan rate for all voltammograms set to 0.1 V s-1,
electron transfers with α = 0.5, and diffusion coefficients of all species as 1 x 10⁻⁵ cm2 s
-1. Simulated using DigiElch 8. ... 6
Figure 1.3 Example of chemical irreversibility for an ErCi reaction with a ke value of 0 (grey),
0.01 (red), 0.2, (green), and 1 s-1 (blue). A scan rate of 0.1 V s-1 used for all
voltammograms. Electron transfers were set as 10000 cm s-1 with α = 0.5, species P
concentration as 1 mM, and diffusion coefficients of all species as 1 x 10⁻⁵ cm2 s-1.
Simulated using DigiElch 8... 7
Figure 1.4 Kinetic zone diagram for a catalytic EC′ mechanism. The kinetic zone diagram
pictorially describes the expected voltammetric responses for an EC′ mechanism. The compass rose depicts the parameters that can be changed to tune λ and γ in order to move between these zones which include the initial concentration of catalyst (𝐶𝑃0), the initial concentration of substrate (𝐶𝐴0), scan rate (υ), and the rate constant for
homogenous electron transfer from the reduced catalyst to the substrate (ke). ... 10
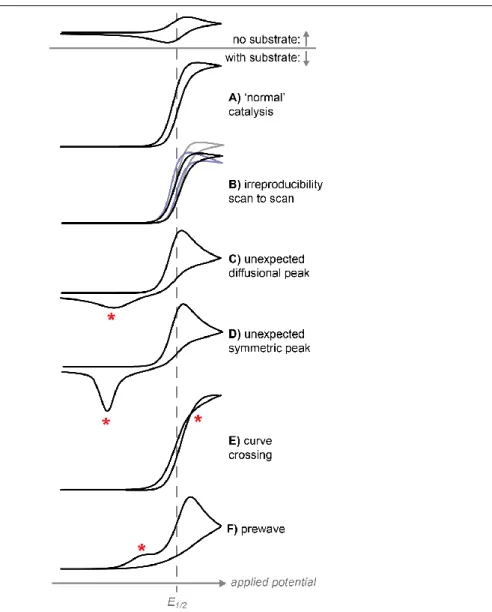
Figure 1.5 Qualitative signs of catalyst transformation or decomposition in cyclic
voltammetry. Lee, K. J.; McCarthy, B. D.; Dempsey, J. L., Chem. Soc. Rev., 2019, 48,
2927-2945 – Reproduced by permission of The Royal Society of Chemistry. ... 16
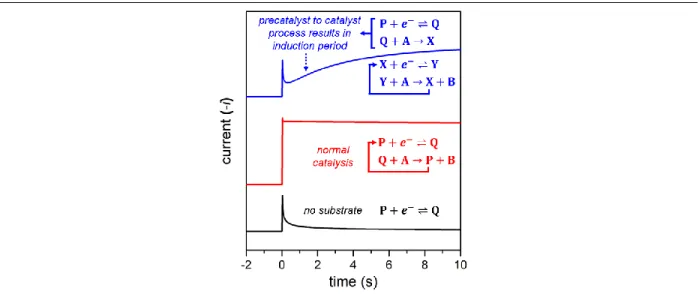
Figure 1.6 Simulated CAs of a catalyst without substrate (black trace), catalyst with
substrate undergoing simple redox catalysis (blue trace), and conversion of precatalyst to active catalyst (red trace). Reaction sequences shown in figure are color-coded to correspond to their simulated CA. Electron transfers were set as 1 cm s-1 with α = 0.5,
catalytic steps with a rate constant of 100 M-1 s-1, species P concentration as 1 mM,
substrate A concentration as 500 mM, diffusion coefficients of all species as 1 x 10⁻⁵
cm2 s-1, rate of 𝑄 + 𝐴 → 𝑋 as 1 M-1 s-1, the potential step as 0.3 V negative relative to
the E1/2 of the P/Q couple, and the X/Y couple as 0.1 V positive relative to the P/Q
couple. Simulated using DigiElch 7. Lee, K. J.; McCarthy, B. D.; Dempsey, J. L., Chem. Soc. Rev., 2019, 48, 2927-2945 – Reproduced by permission of The Royal Society of
Chemistry. ... 19
Figure 1.7 Examples of how prewaves in simulated cyclic voltammograms. Bottom panel contains a simulated CVs of a precatalyst in the absence of substrate undergoing reversible electron transfer (black trace). The top panel contains simulated CV of the conversion of precatalyst to active catalyst when the E1/2 of the X/Y couple is 0.2 V
negative of the P/Q couple. The red and blue asterisks (*) denotes the prewave associated with irreversible transformation of the precatalyst into the active catalyst when the rate of the chemical step is slow (kc = 500 M-1 s-1, red trace) and fast (kc =
1x10⁻⁶ M-1 s-1, blue trace), respectively. Chemical and electron transfer steps shown in
the panels correspond to the simulated CV(s). Electron transfers were set at 1 cm s-1
substrate A as 0.5 and 5 mM, respectively, scan rate as 0.1 V/s, and diffusion coefficients of all species as 1 x 10⁻⁵ cm2 s-1. Simulated using DigiElch 8. Lee, K. J.;
McCarthy, B. D.; Dempsey, J. L., Chem. Soc. Rev., 2019, 48, 2927-2945 – Reproduced
by permission of The Royal Society of Chemistry. ... 20
Figure 1.8 Illustration of procedure and anticipated results for the first primary rinse test variant. A typical three-electrode set-up containing a working electrode (WE), counter electrode (CE), and reference electrode (RE) is used to collect a CV or LSV in a solution of catalyst and substrate. In this example, two voltammetric features can be observed: a catalytic wave preceded by a prewave which corresponds to precatalyst transformation (see Part 1). After collecting the CV or LSV, the WE is disconnected and rinsed with fresh solvent to remove soluble components that are only weakly
physiosorbed to the surface. A second CV or LSV is then run using the same electrode under the same conditions in a substrate-only solution. If a strongly adsorbed
electrocatalytic material was generated in step 1 (blue trace), then a catalytic response will be observed in the substrate-only solution with concomitant loss of the prewave feature. If no electrocatalytic material is generated or the electrode-bound species is removed during rinsing (green trace), then the CV in the substrate-only solution will resemble that of a freshly polished electrode. Lee, K. J.; McCarthy, B. D.; Dempsey, J. L., Chem. Soc. Rev., 2019, 48, 2927-2945 – Reproduced by permission of The Royal
Society of Chemistry ... 23
Figure 1.9 Forced convection changes the shape of the current-potential response for the one-electron, reversible redox couple from the canonical duck shaped collected at a stationary electrode (black) to a sigmoidal steady-state response (blue) with a limiting
plateau described by the Levich equation (equation 1.4.3). ... 26
Figure 1.10 (A) Example of the impact of heterogeneous electron transfer kinetics on a one-electron redox couple for RDEV at a constant rotation rate (ω = 377 rad s-1). The
mass-transport limited sigmoid is observed with a ks value of 10000 cm s-1 (red). However, as
the rate of electron transfer decreases from 10 to 0.01 cm2 s-1 (grey to blue) the sigmoid
is increasingly elongated along the potential axis. (B) Example of how distortions due slow electron transfer kinetics will result in waveforms which are rotation rate
dependent. Rate of electron transfer set at 0.05 cm2 s-1 and rotation rate varied from 42
(red) to 377 rad s-1 (blue). Simulated voltammograms normalized to ω1/2 Scan rate for
all simulations voltammograms set to 0.01 V s-1, electron transfers with α = 0.5, and
diffusion coefficients of all species as 1 x 10⁻⁵ cm2 s-1. Simulated using DigiElch 8. ... 27
Figure 1.11 Simulated voltammograms showing how the EC′ catalytic waveform will
approach its kinetically limited maximum – denoted in both panels by the dashed grey line – by decreasing the kinetic parameter λ. λ, which is proportional to 𝑘𝜔 in RDEV and
𝑘𝜐 in stationary CV, can be lowered by increasing rotation rate (for RDEV) or scan rate (for stationary CV) or by decreasing k. (A) RDE voltammograms collected at rotation rates of 50 (black), 100 (green), 500 (blue), and 10,000 (red) rad s-1, keeping the
excess factor (γ = 1000, 𝐶𝑃0 = 0.001 M, 𝐶𝐴0 = 1 M) and kinetics of the chemical step (ke = 3.86x10⁵ M-1 s-1) constant. For all RDE simulations, scan rate set as 0.001 V s-1
and kinematic viscosity set as 0.01 cm2 s-1. (B) Analogous voltammograms collected
under stationary conditions. In this case, λ was varied using scan rate: υ = 0.025 (black), 0.1 (green), 1 (blue), and 100 V s-1 (red). The mass-transport independent
plateau current is achieved at 10,000 rad s-1 and 100 V s-1 for RDEV and stationary CV,
respectively. For all simulations, electron transfers were set at 10000 cm s-1 with α = 0.5
and diffusion coefficients of all species set as 1 x 10⁻⁵ cm2 s-1. Simulated using DigiElch
8.FD. Lee, K. J.; Gruninger, C. T.; Lodaya, K. M.; Qadeer, S.; Griffith, B.E.; Dempsey, J. L., Analyst2020, 145, 1258-1278 – Reproduced by permission of The Royal Society of
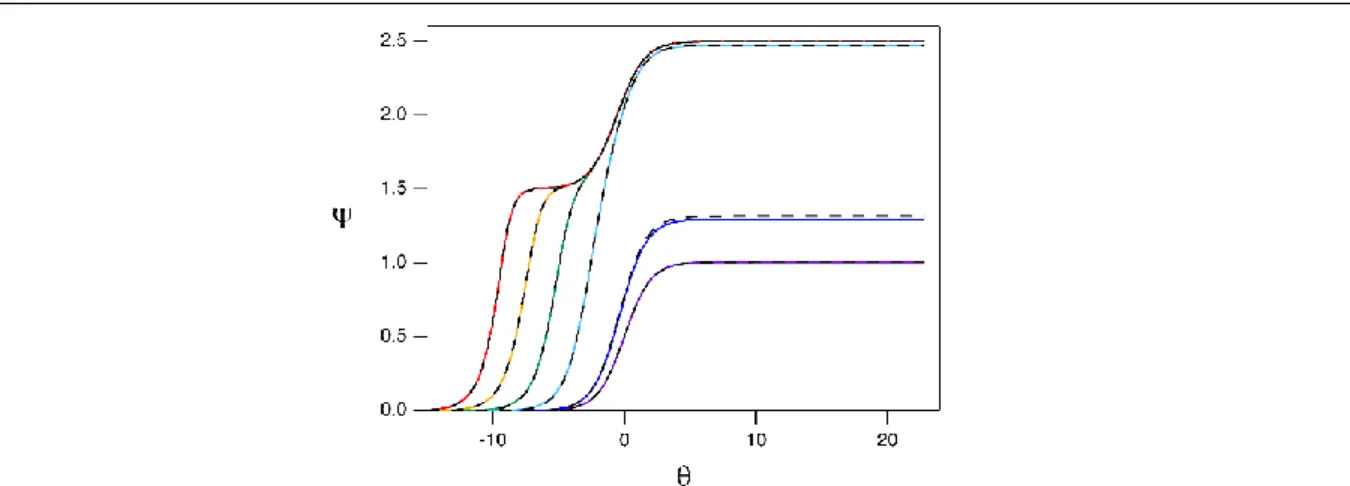
Figure 1.12 Simulated RDE voltammograms depicting how an EC′ catalytic waveform varies with λ in the total catalysis regime when γ is constant. In the absence of substrate,
𝛹∞ = 1 for the catalyst’s reversible one-electron redox couple (black trace). Simulated catalytic voltammograms collected at log(λ) values of 2 (blue), 3 (dark green), 4 (light green), 5 (yellow), 6 (orange), and 7 (red) for γ = 1.5. For all simulations, scan rate set as 0.001 V s-1, kinematic viscosity set as 0.01 cm2 s-1, electron transfers were set at
10000 cm s-1 with α = 0.5 and an E1/2 of 0V, and diffusion coefficients of all species set
as 1 x 10⁻⁵ cm2 s-1. Simulated using DigiElch 8.FD. Lee, K. J.; Gruninger, C. T.; Lodaya,
K. M.; Qadeer, S.; Griffith, B.E.; Dempsey, J. L., Analyst2020, 145, 1258-1278 –
Reproduced by permission of The Royal Society of Chemistry. ... 30
Figure 1.13 Simulated RDE voltammograms for an EC′ catalytic mechanism showing how
slow reaction kinetics limit the plateau current at intermediate γ values. In the absence of substrate, 𝛹∞ = 1 for the catalyst’s reversible, one-electron redox couple (black trace). For γ = 1.5, voltammograms simulated with log(λ) = 6 (blue) exhibit behavior consistent with total catalysis. At the same excess factor, reduced reaction kinetics give a single feature with 𝛹∞ < 𝛾 + 1 as shown in voltammograms simulated at log(λ) values of 0.25 (red), 0.5 (orange), 0.75 (yellow), 1 (light green), and 1.25 (dark green). The transition to total catalysis can be observed at log(λ) = 2 (light blue). For all simulations, scan rate set as 0.001 V s-1, kinematic viscosity set as 0.01 cm2 s-1,
electron transfers were set at 10000 cm s-1 with α = 0.5 and E1/2 of 0 V, and diffusion
coefficients of all species set as 1 x 10⁻⁵ cm2 s-1. Simulated using DigiElch 8.FD. Lee, K.
J.; Gruninger, C. T.; Lodaya, K. M.; Qadeer, S.; Griffith, B.E.; Dempsey, J. L., Analyst
2020, 145, 1258-1278 – Reproduced by permission of The Royal Society of Chemistry. ... 32
Figure 2.1 (A) Cyclic voltammogram of 2.5 mM [Co(bdt)2]- recorded in 0.25 M [NBu4][PF6]
acetonitrile solution at 200 mV s-1. The E1/2 of the [Co(bdt)2]-/2- couple is –1.24 V. (B)
Cyclic voltammogram of 1 mM [Co(bdt)2]- in 0.25 M [NBu4][PF6] acetonitrile at 200 mV s -1 with 0 to 2 equivalents anilinium. (C) The cathodic peak current of A for a solution of 1
mM [Co(bdt)2]- plotted versus added anilinium concentration gives a linear relationship
indicating that substrate diffusion governs the catalytic response. ... 35
Figure 2.2 (A) Voltammograms of 0.5 mM [Co(bdt)2]- with 1 equivalent 4-tert-butylanilinium,
pKa = 11.1 (red); anilinium, pKa = 10.62 (green); 4-chloroanilinium, pKa = 9.7 (blue)
recorded at 200 mV/s in 0.25 M [NBu4][PF6] acetonitrile. (B) Plot of the difference
between [Ep,c(A)] and E1/2([Co(bdt)2]-) versus acid pKa gives a line with a slope of 76
mV/pKa unit. Experimental data indicated by blue dots, experimental averages by red
dots along with associated standard deviation. Acid identities: (1) anilinium, (2) chloroanilinium, (3) bromoanilinium, (4) trifluoromethoxyanilinium, (5)
4-iodoanilinium, (6) 4-methylbenzoateanilinium, and (7) 4-trifluoromethylanilinium. (C) Plot of the difference between [Ep,c(A)] and E1/2([Co(bdt)2]-) versus logarithm of [Co(bdt)2-]
concentration using one equivalent 4-chloroanilinium. Experimental data represented by
blue dots, averages and standard deviations shown in red. ... 37
Figure 2.3 UV-vis absorbance spectra of 0.25 mM [Co(bdt)2]- in acetonitrile 30 minutes after
the addition of p-cyanoanilinium under atmospheric conditions. Solutions were filtered prior to obtaining spectra to reduce scattering arising from the formation of black
particles. ... 38
Figure 2.4 (A) Cyclic voltammogram recorded in an electrolyte only solutionusing a freshly polished electrode (blue trace) and an electrode treated in a solution of 2.5 mM [Co(bdt)2]- and 2.5 mM 4-chloroanilinium for 30 min (black trace). (B) Cyclic
voltammograms recorded in a 2.5 mM 4-chloroanilinium electrolyte solution using electrodes treated with 2.5 mM [Co(bdt)2]- and 2.5 mM 4-chloroanilinium. Pretreatment
Figure 2.5(A) Cyclic voltammogram of 2.5 mM [Co(bdt)2]- and 2.5 mM 4-chloroanilinium
pre-treatment solution (black trace) overlayed with cyclic voltammogram of 2.5 mM 4-chloroanilinium solution obtained with an electrode that had been pre-treated 10 min (blue trace). (B) Rinse test current (blue) and potential (red) of peak E recorded as a function of pre-treatment time. Dashed lines indicate the current and potential of prewave A for the 2.5 mM [Co(bdt)2]- and 2.5 mM 4-chloroanilinium solution used to
pretreat the electrodes. Cyclic voltammogram of pre-treatment solution obtained with an
electrode that was submerged in the solution for less than 90 seconds. ... 41
Figure 2.6 High resolution XPS spectra of the (A) Co 2p region and (B) S 2p region for dropcast [Co(bdt)]- (blue trace), film formed with 1 equivalent p-cyano-anilinium (green
trace), film formed with 2 equivalents p-cyano-anilinium (black trace), and dropcast
black particles (red trace). ... 43
Figure 2.7(A) Electrochemistry of a film-modified electrode. A 10 cm x 20 cm x 2 cm glassy carbon plate was soaked in a solution of [Co(bdt)2]- and p-cyanoanilinium for 1 week
and rinsed with acetonitrile. Linear sweep voltammogram collected in 0.25 M
[NBu4][PF6] acetonitrile shows a large, amorphous stripping current (blue). If the same
plate is used to collect a second linear sweep voltammogram in the same solution, the resulting wave resembles that of a diffusion-controlled species (red). Background voltammogram of a freshly polished and pretreated plate shown for comparison (grey). All voltammograms collected at 0.2 V s-1 in 0.25 M [NBu
4][PF6] acetonitrile and are not
referenced to Fc+/0. (B) Normalized UV-vis absorbance spectrum of electrolyte solution
after application of reducing potentials to a 10 cm x 20 cm x 2 cm glassy carbon plate that had been soaked in a solution of [Co(bdt)2]- and p-cyanoanilinium for 1 week (blue)
overlaid with spectrum of 0.25 mM solution of [Co(bdt)2]- in CH3CN (red). (C) UV-vis
absorbance spectrum of a solution of benzophenone radical anion and black particles in CH3CN shows regeneration of [Co(bdt)2]- upon chemical reduction of black particles,
formed with either 5 mM [Co(bdt)2]- and 2 equivalents p-cyanoanilinium (blue) or 0.5
mM [Co(bdt)2]- and 100 equivalents TFA. ... 44
Figure 2.8 Comparison of rinse test data for of films formed with para-substituted anilinium and non-anilinium acids. Working electrodes were pretreated in a solution of 2.5 mM [Co(bdt)2]- and 1 equivalent of either 4-chloroanilinium (blue), (trifluoro)acetic acid
(green), or HCl (purple). Electrodes were then rinsed with acetonitrile and used to collect a cyclic voltammogram in a solution containing 2.5 mM of either (1) anilinium, (2) chloroanilinium, (3) bromoanilinium, (4) trifluoromethoxyanilinium, (5)
4-methylbenzoateanilinium. The peak potential for feature E is plotted as a function of the pKa of the anilinium acid used in the scanning solution. Rinse tests with TFA and HCl
were not performed with (2) or (4). All voltammograms were collected at 0.2 V s-1 in
0.25 M [NBu4][PF6] acetonitrile. ... 46
Figure 3.1 (A) Concentration dependence studies for [Ni(PPh2NPh2)2]2+. Cyclic
voltammograms recorded in a solution of 0.5 mM [Ni(PPh
2NPh2)2]2+ (red) contain two
chemically reversible redox couples. The reversibility of these couples is increasingly lost as the concentration is increased up to 2 mM (grey to blue). Voltammograms obtained in 0.25 M [NBu4][PF6] acetonitrile at 0.1 V s-1 and normalized to concentration
of [Ni(PPh
2NPh2)2]2+. (B) Scan rate dependence studies collected in a solution of 3 mM
[Ni(PPh2NPh2)2]2+. The reversibility of both redox couples is regained as the scan rate is
increased from 0.1 V s-1 (blue) up to 5 V s-1 (grey to red). Voltammograms obtainedin
0.25 M [NBu4][PF6] acetonitrile and normalized to υ12. ... 53
Figure 3.2 (A) Comparison of an experimentally obtained cyclic voltammogram at 10 mM [Ni(PPh2NPh2)2]2+ (red) to the theoretical voltammogram that would be obtained in the
one-electron reductions of a species P with redox couples at E1/2 = -0.83 and -1.03 V.
Both electron transfers set at 10000 cm s-1 with α = 0.5, scan rate as 0.1 V s-1, and
concentration of P as 0.01 M. Diffusion coefficient of all species set at the
experimentally determined value of 5.9 x 106 cm2 s-1 (Appendix B.1). Simulated with
DigiElch 8.FD. (B) Scan rate dependence studies at 10 mM [Ni(PPh2NPh2)2]2+. Cyclic
voltammograms recorded across scan rates ranging from 0.025 V s-1 to 5 V s-1 (red to
blue) and normalized to υ1/2. All experimental voltammograms recorded in 0.25 M
[NBu4][PF6] acetonitrile. ... 54
Figure 3.3 Repetitive cycling experiments confirm that the electrode properties can be modified over the course of a single electrochemical measurement. Electrodes were polished and pretreated at the start of the data set and all subsequent voltammograms were collected using the same electrode without polishing between scans. The solution was stirred between scans to refresh the diffusion layer. Rapid changes can be
observed in each subsequent voltammogram collected at 10 mM [Ni(PPh
2NPh2)2]2+:scan
1 (grey), 2 (dark blue), 3 (light blue), 4 (green), 5 (yellow), 6 (orange), and 7 (red).
Voltammograms recorded in 0.25 M [NBu4][PF6] acetonitrile at 0.1 V s-1. ... 56
Figure 3.4 Scan rate dependence studies at 10 mM [Ni(PPh
2NPh2)2]2+ highlighting the
oxidative electrochemistry of the deposited material. Scan rates range from 0.025 V s-1
to 1 V s-1 (red to blue). Voltammograms recorded in 0.25 M [NBu4][PF6] acetonitrile and
normalized to υ1/2. ... 59
Figure 3.5 UV-vis absorbance spectrum of a solution of 4 mM [Ni(PPh2NPh2)2]2+ in 0.25 M
[NBu4][PF6] acetonitrile during spectroelectrochemistry experiments. Spectra collected
in the absence of an applied potential (blue), after holding the honeycomb electrode at -1.4 V for 30 seconds (grey), and after stepping the fouled honeycomb to 0.3 V for 30
seconds (red). ... 59
Figure 3.6 Cyclic voltammograms of 0.5 mM (red), 1 mM (light red), 1.25 mM (grey), 1.5 mM (light blue), and 2 mM (blue) [Ni(PPh2NPh2)2]2+with 1 equivalent ferrocene. If the potential
is not first swept through the NiII/I and NiI/0 waves, no current enhancement is observed
at the Fc+/0 redox couple (black trace). Voltammograms obtained at 0.1 V s-1 in 0.25 M
[NBu4][PF6] acetonitrile and normalized to concentration of [Ni(PPh2NPh2)2]2+. ... 62
Figure 3.7 UV-vis absorbance spectrum of a solution of 4 mM [Ni(PPh2NPh2)2]2+ and 0.33 mM
ferrocene in 0.25 M [NBu4][PF6] acetonitrile during spectroelectrochemistry
experiments. Spectra collected in the absence of an applied potential (blue), after holding the honeycomb electrode at -1.4 V for 60 seconds (grey), and after stepping the
fouled honeycomb to 0.3 V for 60 seconds (red). ... 63
Figure 3.8 Cyclic voltammograms of 3 mM [Ni(PPh
2NPh2)2]2+ and 0.65 mM ferrocene after
induction periods at a resting potential of -1.5 V vs Fc+/0. The length of the induction
period was increased from 1 (red) to 20 seconds (grey to blue), resulting in a clear increase in ip,a[Fc+/0]along with a subtle decrease in the magnitude of the cathodic
feature for this couple. Voltammograms obtained at 0.1 V s-1 in 0.25 M [NBu 4][PF6]
acetonitrile. ... 64
Figure 3.9 Ferrocene titrations show how varying γ using CP0 will influence the Fc+/0 redox
couple. Cyclic voltammograms collected in a solution of 5 mM [Ni(PPh
2NPh2)2]2+with (A)
0.1 (red), 0.2 (orange), 0.3 (yellow), 0.4 (green), and 0.6 (blue) mM ferrocene and (B)
14 (red), 21 (orange), 35 (yellow), 48 (green), and 75 (blue) μM ferrocene conform to trend 2 and trend 3, respectively. Voltammograms recorded at 0.1 V s-1 in 0.25 M
[NBu4][PF6] acetonitrile using an induction period of 5 (A) or 10 (B) seconds with a
Figure 3.10 Cyclic voltammograms of 5 mM [Ni(PPh2NPh2)2]2+ with 0.1 mM ferrocene after a 5
second induction period at a resting potential of -1.5 V. Scan rate varied from 0.05 (red) 0.1 (orange), 0.2 (yellow), 0.3 (green), 0.5 (light blue), 1 (blue), and 2 (grey) V s-1.
Voltammograms recorded in 0.25 M [NBu4][PF6] acetonitrile and have been normalized
to υ12. ... 67
Figure 3.11 Cyclic voltammograms of 10 mM [Ni(PPh2NPh2)2]2+ with 1 mM ferrocene recorded
at 0.025 (red), 0.05 (orange), 0.1 (yellow), 0.2 (light green), 0.5 (dark green), 1 (light blue) and 5 (dark blue) V s-1. All voltammograms obtained in 0.25 M [NBu4][PF6]
acetonitrile and normalized to υ1/2. ... 68
Figure 4.1 Simulated RDE voltammograms for an ECEC′ catalytic mechanism utilizing the
Hale transformation approach (dotted lines) and the Nernst Diffusion Layer
approximation approach (solid lines). Here γ = 1.5, and dimensionless rate parameters for both models were equal. Voltammograms were collected at log(λ) values of -2 (dark purple), 0 (dark blue), 2 (light blue), 4 (green), 6 (light orange), and 8 (dark red)
corresponding to the transition between no observed catalysis to total catalysis. Simulations generated using custom MATLAB scripts. Lee, K. J.; Gruninger, C. T.; Lodaya, K. M.; Qadeer, S.; Griffith, B.E.; Dempsey, J. L., Analyst2020, 145, 1258-1278
– Reproduced by permission of The Royal Society of Chemistry. ... 77
Figure 4.2 Simulated ECEC′ RDE waveforms displaying the effects of electron transfer
kinetics on both the shape and half-wave potential in the total catalysis regime. Split wave voltammograms are observed in simulations modelling Nernstian electron transfer kinetics (red, log[ks] = 3), as anticipated for a voltammogram in the total catalysis
regime. As electron transfer kinetics become increasingly slow, the distinction between the split-wave is lost and the potential for the features shifts to more negative potentials. RDE voltammograms depicting non-Nernstian electron transfer collected with log(ks)
values of -6 (blue), -3 (green), and -1 (orange). The excess parameter, 𝛾, was set to 1.5 and log(λ) for both chemical steps set to 7 to simulate total catalysis. Simulations generated using custom MATLAB scripts. Lee, K. J.; Gruninger, C. T.; Lodaya, K. M.; Qadeer, S.; Griffith, B.E.; Dempsey, J. L., Analyst2020, 145, 1258-1278 – Reproduced
by permission of The Royal Society of Chemistry. ... 78
Figure 4.3 Simulated RDE voltammograms illustrating parameters that govern the shape of the voltammogram for an ECEC′ catalytic reaction where the second electron transfer is more thermodynamically favorable, the first chemical step is not rate limiting, and Nernstian electron transfer kinetics are operative. Simulated voltammogram for the one-electron redox couple of the catalyst (E1/2 = 0 V) in the absence of substrate shown in
grey. Catalytic RDE voltammograms show that changing the potential difference between E1 and E2, the k1/k2 ratio, and/or λ1 while keeping γ (𝐶𝑃0 = 0.001 M; 𝐶𝐴0 = 0.1
M) and λ2 constant (k2 = 10 M s-1; ω = 100 rad sec-1) leads to drastic deviations in the
shape of the catalytic wave at potentials positive of the plateau region. The values for k1/k2 and λ1 were varied at a constant ΔE value (E1 = 0 V; E2 = 0.4 V) by modulating k1
from 1x10⁷ M-1 s-1 (red) to 1x10⁶ M-1 s-1 (blue). Alternatively, k1/k2 and λ1 value were
kept constant (k1 = 1x10⁷ M-1 s-1) and ΔE was modulated by changing E2 from 0.4 (red)
to 0.02 V (green) while maintaining a constant E1 (E1 = 0 V). The dashed grey line
denotes the start of the plateau region where all three catalytic voltammograms display the same limiting current value. The plateau current is governed by the kinetic
parameter for the rate-limiting step λ2 and excess factor γ. At potentials positive of the
plateau region, three additional parameters influence the waveform: the kinetic parameter for the first chemical step (λ1), the difference in formal potential for electron
transfer steps (ΔE), and the ratio of the rate constants for the chemical steps (k1/k2).
Electron transfers were set at kS = 1x105 cm s-1 with α = 0.5, respectively, scan rate as
viscosity as 0.0045 cm2 s-1. Simulated using DigiElch 8.FD. Lee, K. J.; Gruninger, C. T.;
Lodaya, K. M.; Qadeer, S.; Griffith, B.E.; Dempsey, J. L., Analyst2020, 145, 1258-1278
– Reproduced by permission of The Royal Society of Chemistry. ... 79
Figure 4.4 Stationary cyclic voltammogram (black) and RDE voltammograms of 0.5 mM Co(dmgBF2)2(CH3CN)2 in 0.25 M [NBu4][PF6] acetonitrile solution at 0.025 and 0.01 V s -1, respectively. Rotation rates for RDE voltammograms range from 42 rad sec-1 (red) to
377 rad sec-1 (blue). Lee, K. J.; Gruninger, C. T.; Lodaya, K. M.; Qadeer, S.; Griffith,
B.E.; Dempsey, J. L., Analyst2020, 145, 1258-1278 – Reproduced by permission of
The Royal Society of Chemistry. ... 83
Figure 4.5 RDE voltammograms of 0.5 mM Co(dmgBF2)2(CH3CN)2 in the absence of acid
(grey) and in the presence of 0.5 mM (dashed lines) or 5 mM (solid lines) 4-trifluoromethoxyanilinium (blue), anilinium (green), and 4-methoxyanilinium (red) illustrate how the degree of current enhancement increases with stronger acids and higher acid concentrations. In all cases, the catalytic wave falls at potentials positive of the CoII/I redox couple. All voltammograms obtained in 0.25 M [NBu4][PF6] acetonitrile at
0.01 V s-1 and recorded at 42 rad sec-1. The vertical axis has been converted to
dimensionless current. Lee, K. J.; Gruninger, C. T.; Lodaya, K. M.; Qadeer, S.; Griffith, B.E.; Dempsey, J. L., Analyst2020, 145, 1258-1278 – Reproduced by permission of
The Royal Society of Chemistry. ... 84
Figure 4.6 Variation in Ψ∞ as a function of rotation rate for RDE voltammograms of 0.5 mM Co(dmgBF2)2(CH3CN)2 in the presence of either 0.5 (hollow circles) or 5 (solid circles)
mM 4-methoxyanilinium (blue), anilinium (green), and 4-trifluoromethoxyanilinium (red). Dashed grey line represents 𝛹∞ for 0.5 mM Co(dmgBF2)2(CH3CN)2 in the absence of
substrate. Voltammograms recorded at 0.01 V sec-1 in 0.25 M [NBu4][PF6] acetonitrile.
Rotation rates varied from 42-262 rad sec-1 in ascending order. All 𝛹∞ values
calculated using the baseline corrected catalytic plateau currents. See Appendix D.2 for RDE voltammograms and further information on experimental parameters. Lee, K. J.; Gruninger, C. T.; Lodaya, K. M.; Qadeer, S.; Griffith, B.E.; Dempsey, J. L., Analyst
2020, 145, 1258-1278 – Reproduced by permission of The Royal Society of Chemistry. ... 86
Figure 4.7 Two limiting scenarios will result in catalytic voltammograms with plateau current values of 1 < Ψ∞ < 2. (A) If the kinetics for the first protonation step (k1) are slow
relative to rotation rate, the singly reduced Co(I) species will be swept away from the electrode surface before protonation can occur. This limits the amount of EC product Co(III)-H available for reduction at the electrode surface. (B) Alternatively, the current may be limited by the rate of electron transfer from the electrode to the EC product Co(III)-H. In this case, only a fraction of the Co(III)-H is reduced at the electrode surface before being swept into the bulk solution. Lee, K. J.; Gruninger, C. T.; Lodaya, K. M.; Qadeer, S.; Griffith, B.E.; Dempsey, J. L., Analyst2020, 145, 1258-1278 – Reproduced
by permission of The Royal Society of Chemistry. ... 87
Figure 4.8 (A) RDE voltammograms of 0.5 mM Co(dmgBF2)2(CH3CN)2 in the absence of
acid (grey) and in the presence of 0.181 (black), 0.5 (blue), 0.55 (green), 1 (yellow), 4 (orange), and 5.5 (red) mM 4-trifluoromethoxyanilinium. All voltammograms obtained in 0.25 M [NBu4][PF6] acetonitrile at 0.01 V s-1 and recorded at 42 rad sec-1. (B) FOW plot
obtained by converting the current to the ic/il ratio and converting potential to the FOW
axis 1/(1+exp[θ]). Solid lines represent converted trace and are color-coded to
correspond with their RDE voltammogram. Grey dashed are the linear fit of the foot of the wave. FOWA plot expanded to focus on linear region at the foot of the wave. Lee, K. J.; Gruninger, C. T.; Lodaya, K. M.; Qadeer, S.; Griffith, B.E.; Dempsey, J. L., Analyst
Figure 4.9 (A) RDE voltammograms of 0.5 mM Co(dmgBF2)2(CH3CN)2 in the absence of
acid (grey) and in the presence of 0.5 mM 4-methoxyanilinium at rotation rates of 42 (red), 94 (orange), 128 (yellow), 168 (green), 212 (light blue), and 262 rad sec-1 (blue)
with the vertical axis converted to dimensionless current. Voltammograms obtained in 0.25 M [NBu4][PF6] acetonitrile at 0.01 V s-1. (B) Plots of θ1/2 vs ln[ω1/2] for
voltammograms of 0.5 mM Co(dmgBF2)2(CH3CN)2 in the presence of 0.5 mM
4-methoxyanilinium are linear in the rotation rate range 94-262 rad sec-1 where 𝛹∞
values ranged from 1.06 to 1.04. Experimental data points are denoted by blue circles and the linear fit of the five fastest rotation rates (94-262 rad sec-1) shown as a blue
dashed line. Lee, K. J.; Gruninger, C. T.; Lodaya, K. M.; Qadeer, S.; Griffith, B.E.; Dempsey, J. L., Analyst2020, 145, 1258-1278 – Reproduced by permission of The
Royal Society of Chemistry. ... 93
Figure 4.10 RDE voltammograms of 2 mM ferrocene were collected at 5 rotation rates: 42 (red), 94 (orange), 168 (yellow), 262 (green), and 316 (blue) rad sec-1. Three
voltammograms were recorded at each rotation rate – first (solid line) and third (dashed line) voltammograms are shown, second voltammogram omitted for clarity. RDE voltammograms recorded at 0.005 V s-1 in 0.25 mM [NBu
4][PF6] acetonitrile and OCP
measurements were collected between voltammograms. Stationary voltammogram (grey trace) collected at 0.05 V s-1 prior to RDE trials. Lee, K. J.; Gruninger, C. T.;
Lodaya, K. M.; Qadeer, S.; Griffith, B.E.; Dempsey, J. L., Analyst2020, 145, 1258-1278
– Reproduced by permission of The Royal Society of Chemistry. ... 95
Figure 4.11 Data extracted from RDE voltammograms and OCP measurements obtained in 2 mM Fc in 0.25 M [NBu4][PF6] acetonitrile. Three voltammograms were collected at
each rotation rate where the potential was swept from –0.45 V to 0.4 V back to –0.45 V. OCP was related to the ratio of [Fc+]/[Fc] using the Nernst equation: 𝐸 = 𝐸12 +
𝑅𝑇𝑛𝐹𝑙𝑛 ( 𝐹𝑐 + 𝐹𝑐). (A) Rotation rate-normalized baseline current for RDE
voltammograms plotted as a function of the [Fc+]/[Fc] ratio determined from the OCP
measurement taken directly prior to the start of the voltammogram. (B) The ratio of [Fc+]/[Fc] determined via OCP as a function of the charge passed in all previous RDE
voltammograms. (C) The moles of Fc+ linearly depends on the total charge passed
during all prior scans with a slope of 8.25e-06 mol C-1, which is in reasonably good
aggreement with the predicted value of (1/nF). Lee, K. J.; Gruninger, C. T.; Lodaya, K. M.; Qadeer, S.; Griffith, B.E.; Dempsey, J. L., Analyst2020, 145, 1258-1278 –
Reproduced by permission of The Royal Society of Chemistry. ... 96
Figure 4.12 RDE voltammograms of 0.5 mM Co(dmgBF2)2(CH3CN)2 with 5 mM
4-trifluoromethoxyanilinium and 0.5 mM decamethylferrocene. Rotation rates increased from 42 (blue) to 513 (red) rad sec-1. Voltammograms started at -0.25 V and recorded at
0.01 V sec-1 in 0.25 M [NBu4][PF6] acetonitrile. Lee, K. J.; Gruninger, C. T.; Lodaya, K.
M.; Qadeer, S.; Griffith, B.E.; Dempsey, J. L., Analyst2020, 145, 1258-1278 –
Reproduced by permission of The Royal Society of Chemistry. ... 97
Figure 4.13 Stationary cyclic voltammogram of 0.5 mM Co(dmgBF2)2(CH3CN)2 in the
presence of 5 mM 4-trifluoromethoxyanilinium collected with a freshly polished working electrode (red) contains a reversible CoIII/II couple (E
1/2 = 0.075 V). This feature is
replaced by an irreversible wave for catalytic voltammograms recorded with working electrodes previously subjected to variable rotation rate studies in a solution of 4-trifluormethoxyanilinium (blue). Voltammograms recorded at 0.1 V s-1 in 0.25 M
[NBu4][PF6] acetonitrile using a decamethylferrocene internal standard [E0'(Fc*+/0) =
-0.505 V]. Lee, K. J.; Gruninger, C. T.; Lodaya, K. M.; Qadeer, S.; Griffith, B.E.; Dempsey, J. L., Analyst2020, 145, 1258-1278 – Reproduced by permission of The
Figure 4.14 (A) Stationary cyclic voltammograms of 0.5 mM Co(dmgBF2)2(CH3CN)2 with 5
mM 4-trifluoromethoxyanilinium collected before variable rotation rate trials (blue) and after RDE voltammograms obtained at 42 – 513 rad sec-1 (grey to red). Voltammograms
obtained at 0.1 V s-1 in 0.25 M [NBu4][PF6] acetonitrile using a decamethylferrocene
internal standard. (B) Expansion of CoIII/II redox couple shows monotonic increase in
peak separation over the course of the variable rotation rate trials. Lee, K. J.; Gruninger, C. T.; Lodaya, K. M.; Qadeer, S.; Griffith, B.E.; Dempsey, J. L., Analyst
2020, 145, 1258-1278 – Reproduced by permission of The Royal Society of Chemistry. ... 100
Figure 4.15 (A) Stationary voltammograms of 0.5 mM Co(dmgBF2)2(CH3CN)2 in the
presence of 5 mM anilinium collected before RDE trials (dark blue trace), after RDE trials (dark red), and in between each RDE trial during variable rotation rate studies. Voltammograms divided into 3 subsets: voltammograms collected after trials at 42–131 (light blue), 168 (black), and 199–513 rad sec-1 (light red). Voltammograms obtained at
0.1 V s-1 in 0.25 M [NBu4][PF6] acetonitrile using a Fc* internal standard. (B)𝛹∞ values
for the catalytic wave and (C) and ΔEp[CoIII/II] couple as a function of the rotation rate for
the RDE trial collected prior to the stationary voltammogram. Rotation rates were traversed in ascending order, such that moving from left to right across the x-axis represents both an increase in ω and trial number. Grey dashed line represents the voltammogram collected after the RDE trial at 168 rad sec-1, corresponding to the black
trace in panel A, and demarcates the onset of observable electrode passivation. For voltammograms collected prior to this trial, an increase in Ψ∞ is observed with little to no change in ΔEp[CoIII/II]. For all voltammograms collected subsequent to this trial, a
decrease in 𝛹∞ and a monotonic increase in ΔEp[CoIII/II] is observed. Lee, K. J.;
Gruninger, C. T.; Lodaya, K. M.; Qadeer, S.; Griffith, B.E.; Dempsey, J. L., Analyst
2020, 145, 1258-1278 – Reproduced by permission of The Royal Society of Chemistry. ... 101
Figure 4.16 (A) RDE voltammogram of 1.25 mM 4-trifluoromethoxyanilinium recorded at 377 (blue) rad sec-1 overlaid with the background scan collected in 0.25 M [NBu
4][PF6]
acetonitrile (red). Voltammograms obtained at 0.01 V s-1 using a ferrocene internal
standard. We have not identified the sharp feature observed on the anodic scan at Ep ~
0.85V vs. Fc+/0, but note it is consistent with deposition of a heterogeous species on the
electrode surface (see 3.2).62(B) Stationary cyclic voltammograms of 1.25 mM
4-trifluoromethoxyanilinium (blue) overlaid with the background scan collected in 0.25 M [NBu4][PF6] acetonitrile (red). Voltammograms recoreded at 0.1 V s-1 using a ferrocene
internal standard. Lee, K. J.; Gruninger, C. T.; Lodaya, K. M.; Qadeer, S.; Griffith, B.E.; Dempsey, J. L., Analyst2020, 145, 1258-1278 – Reproduced by permission of The
Royal Society of Chemistry. ... 103
Figure 5.1 (1) Generic structure for the platinum(II)-bipyridine platform to be explored in this work. (2) Periana-Catalytica system previously shown to catalyze CH4 oxidation using
stoichiometric oxidants. (3) Tethered platinum(II) complexes shown to catalyze CH4
oxidation when tethered to conductive carbon. ... 108
Figure 5.2 Cyclic voltammograms of 1 mM (bpy)Pt(CH3)2 recorded at 0.1 V s-1 in a 0.25 M
[NBu4][PF6] acetonitrile solution. (A) Traversing the cathodic feature of the reversible
[(bpy)Pt(CH3)2]0/- redox couple results in a bipyridine-based reduction to generate a
bipyridine anion radical bonded to the platinum metal center. (B) The anodic feature A
is assigned to the chemically irreversible oxidation of (bpy)Pt(CH3)2. Multiple new redox
features (B, C, D, E, F) are observed on the return sweep of the cyclic voltammogram if
and only if the anodic feature A is initially scanned through. ... 110
Figure 5.3 (A) Concentration dependence studies show a positive shift in the anodic peak potential for feature A upon decreasing concentration. Cyclic voltammograms of 0.25 (red), 0.5 (light red), 1 (light blue), and 2.5 (blue) mM (bpy)Pt(CH3)2 recorded in 0.25 M
concentration. (B) Scan rate dependence studies show a positive shift in Epa(A) upon
increasing scan rate. Cyclic voltammograms of 2.5 mM (bpy)Pt(CH3)2 recorded in 0.25
M [NBu4][PF6] acetonitrile at 0.05 (red), 0.1 (orange), 0.2 (yellow), 0.5 (light green), 0.75
(dark green), 5 (light blue), and 10 V s-1 (blue). Voltammograms normalized by υ1/2. ... 112
Figure 5.4 (A) The magnitude and number of cathodic features on the return sweep depends on the vertex potential for cyclic voltammograms recorded in 1 mM
(bpy)Pt(CH3)3. For voltammograms collected with a vertex potential of 0.05 V (red) a
sharp feature B is observed on the return scan. Upon sweeping up 0.6 V (blue), additional poorly-defined features can be observed at potentials positive of A. The return sweep no longer contains a sharp feature B, but a new feature at -1.05 V can be observed. Voltammograms recorded at 0.2 V s-1 in 0.25 M [NBu
4][PF6]. varying the
vertex potential. (B) Multiple cycling experiments which first sweep anodically through feature A show a decrease in the magnitude of feature B along with a positive shift in the potential of A, consistent with the deposition of an inhibition material. Cyclic voltammograms collected in 1 mM (bpy)Pt(CH3)2 and correspond to scan 1 (red), scan
2 (orange), scan 3 (yellow), scan 4 (light green), scan 6 (dark green), scan 7 (light blue), scan 9 (blue), and scan 10 (dark blue). Voltammograms recorded in 0.25 M
[NBu4][PF6] acetonitrile at 0.2 V s-1. ... 114
Figure 5.51H NMR of the product mixture generated upon the chemical oxidation of
(bpy)Pt(CH3)2 with 1 equivalent [Fc][PF6] in CD3CN. Integrations for the Pt-Me peak of
[(bpy)Pt(CH3)(CH3CN)]+ at 0.89 ppm and the Pt-Meax feature of
[(bpy)Pt(CH3)3(CH3CN)]+ are shown. ... 115
Figure 5.6 Cyclic voltammograms of (bpy)Pt(CH3)2 (grey) and the chemically isolated
oxidative disproportionation products [(bpy)Pt(CH3)(CH3CN)][PF6] (blue) and
[(bpy)Pt(CH3)3(CH3CN)][PF6] (red). Voltammograms of (bpy)Pt(CH3)2 and
[(bpy)Pt(CH3)(CH3CN)][PF6] recorded at 0.2 V s-1 using a 1 mM solution.
Voltammogram of [(bpy)Pt(CH3)3(CH3CN)][PF6] recorded at 0.1 V s-1 using a 2.5 mM
solution. All voltammograms obtained in 0.25 M [NBu4][PF6] acetonitrile and normalized
to υ1/2 and concentration... 116
Figure 5.7 Bulk electrolysis effected by holding a glassy carbon working plate at ca. 0.1 V in a solution of 2.5 mM (bpy)Pt(CH3)2 in 0.25 M [NBu4][PF6] acetonitrile until complete
consumption of starting material was observed (ca. 2 hours). Cyclic voltammogram of the resulting reaction mixture recorded at 0.2 V s-1 (blue). All voltammograms recorded
in 0.25 M [NBu4][PF6] acetonitrile. ... 117
Figure 5.8 Cyclic voltammogram of 2.5 mM (bpy)Pt(CH3)2 in 0.25 M [NBu4][PF6]
1,2-difluorobenzene. If the potential is first swept cathodically, shows only a reversible, one-electron wave assigned to the [(bpy)Pt(CH3)2]0/- redox couple is observed (grey).
Scanning anodically reveals an oxidative feature with half the charge of the [(bpy)Pt(CH3)2]0/- redox couple and results in the growth of minor cathodic features
around -1.1 and -1.25 V (blue). ... 119
Figure 5.9 (A) Cyclic voltammograms of 2.5 mM (bpy)Pt(CH3)2 0.25 M [NBu4][PF6] DFB in
the absence of acetonitrile (red) and in the presence of 0.5 mM (orange), 1.0 mM (yellow), 2.5 mM (green), and 10% acetonitrile. (B) Cyclic voltammograms of the oxidative disproportionation products [(bpy)Pt(CH3)3(CH3CN)]+ (red) and
[(bpy)Pt(CH3)(CH3CN)]+ (blue) in 0.25 M [NBu4][PF6] DFB without added acetonitrile
overlaid with the cyclic voltammogram of 2.5 mM (bpy)Pt(CH3)2 in the presence of 10%
Figure A.1 Cyclic voltammograms of 0.5 mM [NBu4][Co(bdt)2] in 0.25 M [NBu4][PF6]
acetonitrile at 200 mV s-1 with 2 to 3 equivalents anilinium using a 1 mm working
electrode. ... 123
Figure A.2 Prewave peak current observed for a solution of 0.5 mM [NBu4][Co(bdt)2] plotted
versus added anilinium concentration using 2 to 3 equivalents anilinium. Data collected using a 1 mm working electrode. Linear fit of prewave peak current vs [anilinium] gives
an R2 = 0.91. ... 123
Figure A.3 Example cyclic voltammograms of 0.5 mM [NBu4][Co(bdt)2] in 0.25 M [NBu4][PF6]
acetonitrile at 200 mV s-1 with 3 to 10 equivalents anilinium using a 1 mm working
electrode. ... 124
Figure A.4 Example cyclic voltammograms of 0.5 mM [NBu4][Co(bdt)2] in 0.25 M [NBu4][PF6]
acetonitrile at 200 mV s-1 with 10 to 40 equivalents anilinium using a 1 mm working
electrode. ... 124
Figure A.5 (A) Cyclic voltammograms of 0.5 mM [NBu4][Co(bdt)2] in 0.25 M [NBu4][PF6]
acetonitrile with 1 equiv. anilinium at 25, 50, 200, and 500 mV s-1. (B) Plot of difference
between the cathodic peak potential of wave A [Ep,c(A)] and E1/2([Co(bdt)2]-/2-) versus
natural log of scan rate shows that prewave moves to more negative potentials as scan
rate is increased. ... 124
Figure A.6 Cyclic voltammograms of 0.5 mM [NBu4][Co(bdt)2] in 0.25 M [NBu4][PF6]
acetonitrile with 1 equivalent anilinium at 10, 30, and 50 V s-1. Peak A overlaps with the
[Co(bdt)2]-/2-. ... 125
Figure A.7 Cyclic voltammogram of 0.5 mM [NBu4][Co(bdt)2] in the presence of 1 equivalent
4-methoxyanilinium in 0.25 M [NBu4][PF6] acetonitrile at 200 mV s-1. ... 126
Figure A.8 Cyclic voltammogram of 0.5 mM [NBu4][Co(bdt)2] in the presence of 1 equivalent
4-tertbutyl-anilinium in 0.25 M [NBu4][PF6] acetonitrile at 200 mV s-1. ... 126
Figure A.9 Cyclic voltammograms of 0.5 mM [NBu4][Co(bdt)2] in the presence of 1
equivalent anilinium in 0.25 M [NBu4][PF6] acetonitrile at 200 mV s-1. ... 126
Figure A.10 Cyclic voltammograms of 0.5 mM [NBu4][Co(bdt)2] in the presence of 1
equivalent 4-chloroanilinium in 0.25 M [NBu4][PF6] acetonitrile at 200 mV s-1. ... 127
Figure A.11 Cyclic voltammograms of [NBu4][Co(bdt)2] in the presence of 1 equivalent
4-bromoanilinium in 0.25 M [NBu4][PF6] acetonitrile at 200 mV s-1. ... 127
Figure A.12 Cyclic voltammograms of 0.5 mM [NBu4][Co(bdt)2] in the presence of 1
equivalent 4-trifluoromethoxyanilinium in 0.25 M [NBu4][PF6] acetonitrile at 200 mV s-1... 127
Figure A.13 Cyclic voltammograms of 0.5 mM [NBu4][Co(bdt)2] in the presence of 1
equivalent 4-iodoanilinium in 0.25 M [NBu4][PF6] acetonitrile at 200 mV s-1... 128
Figure A.14 Cyclic voltammograms of 0.5 mM [NBu4][Co(bdt)2] in the presence of 1
equivalent 4-methylbenzoateanilinium in 0.25 M [NBu4][PF6] acetonitrile at 200 mV s-1. ... 128
Figure A.15 Cyclic voltammograms of 0.5 mM [NBu4][Co(bdt)2] in the presence of 1

![Figure 2.1 (A) Cyclic voltammogram of 2.5 mM [Co(bdt) 2 ] - recorded in 0.25 M [NBu 4 ][PF 6 ] acetonitrile solution at 200 mV s -1](https://thumb-us.123doks.com/thumbv2/123dok_us/8229216.2181462/81.918.123.807.108.301/figure-cyclic-voltammogram-co-recorded-nbu-acetonitrile-solution.webp)
![Figure 2.2 (A) Voltammograms of 0.5 mM [Co(bdt) 2 ] - with 1 equivalent 4-tert-butylanilinium, pK a = 11.1 (red); anilinium, pK a = 10.62 (green); 4-chloroanilinium, pK a = 9.7 (blue) recorded at 200 mV/s in 0.25 M [NBu 4 ][PF 6 ] acet](https://thumb-us.123doks.com/thumbv2/123dok_us/8229216.2181462/83.918.107.809.351.545/figure-voltammograms-equivalent-butylanilinium-anilinium-green-chloroanilinium-recorded.webp)
![Figure 2.5 (A) Cyclic voltammogram of 2.5 mM [Co(bdt) 2 ] - and 2.5 mM 4-chloroanilinium pre-treatment solution (black trace) overlayed with cyclic voltammogram of 2.5 mM 4-chloroanilinium solution obtained with an electrode that had been p](https://thumb-us.123doks.com/thumbv2/123dok_us/8229216.2181462/87.918.119.802.107.338/voltammogram-chloroanilinium-treatment-overlayed-voltammogram-chloroanilinium-obtained-electrode.webp)
![Figure 2.7 (A) Electrochemistry of a film-modified electrode. A 10 cm x 20 cm x 2 cm glassy carbon plate was soaked in a solution of [Co(bdt) 2 ] - and p-cyanoanilinium for 1 week and rinsed with acetonitrile](https://thumb-us.123doks.com/thumbv2/123dok_us/8229216.2181462/90.918.115.816.178.359/figure-electrochemistry-modified-electrode-soaked-solution-cyanoanilinium-acetonitrile.webp)
![Figure 3.7 UV-vis absorbance spectrum of a solution of 4 mM [Ni(P Ph 2 N Ph 2 ) 2 ] 2+ and 0.33 mM ferrocene in 0.25 M [NBu 4 ][PF 6 ] acetonitrile during spectroelectrochemistry experiments](https://thumb-us.123doks.com/thumbv2/123dok_us/8229216.2181462/109.918.256.806.109.335/figure-absorbance-spectrum-solution-ferrocene-acetonitrile-spectroelectrochemistry-experiments.webp)
![Figure 3.11 Cyclic voltammograms of 10 mM [Ni(P Ph 2 N Ph 2 ) 2 ] 2+ with 1 mM ferrocene recorded at 0.025 (red), 0.05 (orange), 0.1 (yellow), 0.2 (light green), 0.5 (dark green), 1 (light blue) and 5 (dark blue) V s -1](https://thumb-us.123doks.com/thumbv2/123dok_us/8229216.2181462/114.918.110.815.591.817/figure-cyclic-voltammograms-ferrocene-recorded-orange-yellow-light.webp)