PRENATAL PHTHALATE EXPOSURES AND CHILDHOOD ADIPOSITY: EXAMINING THE OBESOGEN HYPOTHESIS
Jessie P. Buckley
A dissertation submitted to the faculty at the University of North Carolina at Chapel Hill in partial fulfillment of the requirements for the degree of Doctor of Philosophy in the Department of
Epidemiology in the Gillings School of Global Public Health.
Chapel Hill 2014
Approved by:
Stephanie M. Engel
Amy H. Herring
Julie L. Daniels
Michelle A. Mendez
iii ABSTRACT
Jessie P. Buckley: Prenatal phthalate exposures and childhood adiposity: examining the obesogen hypothesis
(Under the direction of Stephanie M. Engel)
Background: Phthalate exposures, particularly during fetal development, are
hypothesized to be obesogenic with effects of anti-androgenic phthalates potentially differing by child’s sex. Previous studies are primarily cross-sectional and did not evaluate gestational exposures. To address these gaps, we assessed associations of prenatal phthalate exposures with childhood body size in three prospective birth cohorts.
Methods: In Aim 1, we utilized data from the Mount Sinai Children’s Environmental Health Study (MSSM) to assess associations of third trimester maternal urinary phthalate metabolite concentrations with percent fat mass among children aged 4 to 9 years (N = 180 children with 364 visits). In Aim 2, we pooled data from three Children’s Environmental Health Studies to examine prenatal maternal urinary phthalate concentrations in relation to
iv
Results: In Specific Aim 1, children in the highest tertile of creatinine-corrected maternal third trimester urinary concentrations of summed di-(2-ethylhexyl) phthalate metabolites
(∑DEHP) had lower percent fat mass than children in the lowest tertile (β = 3.06, 95% CI: -5.99, -0.09). In Specific Aim 2, prenatal urinary mono-3-carboxypropyl phthalate (MCPP)
concentrations were associated increased odds of overweight/obese status (OR per SD = 2.12, 95% CI = 1.16, 3.96). We also observed inverse associations of maternal urinary mono-ethyl (MEP) and mono-benzyl (MBzP) concentrations with z-scores among girls and non-Hispanic black children, respectively.
Conclusions: Our findings suggest that prenatal exposure to MCPP, but not other
v
ACKNOWLEDGEMENTS
I am deeply grateful to my dissertation committee, Drs. Stephanie Engel, Amy Herring, Julie Daniels, Michelle Mendez, and David Richardson, for their expertise, encouragement, and commitment to this project. I am particularly indebted to my chair, Stephanie Engel, for her invaluable guidance and mentorship throughout this process. I also acknowledge my non-UNC collaborators for their instrumental contributions to this work: Drs. Mary Wolff, Bruce Lanphear, Joseph Braun, Robin Whyatt, Andrew Rundle, and Antonia Calafat.
I am thankful for all of the people who make UNC such a wonderful place to learn and do research, including the student services office, professors, postdocs, and students who have supported me throughout my time in the epidemiology program. I also appreciate financial support provided by pre-doctoral training grants from the National Institutes of Environmental Health Sciences and the Eunice Kennedy Shriver National Institute for Child Health and Human Development.
vi
TABLE OF CONTENTS
LIST OF TABLES ... x
LIST OF FIGURES ... xii
LIST OF ABBREVIATIONS ... xiii
CHAPTER I. Introduction and Specific Aims ... 1
A. Introduction ... 1
B. Specific Aims ... 4
Specific Aim 1 ... 4
Specific Aim 2 ... 4
Hypotheses ... 4
CHAPTER II. Review of the Literature ... 5
A. Childhood Obesity... 5
Prevalence and Impact of Childhood Obesity ... 5
Measuring Body Size in Children ... 6
B. Environmental Causes of Obesity ... 9
C. Phthalate Exposures and Health Effects ... 10
Human Exposure to Phthalates ... 10
Biomarkers of Phthalate Exposure ... 11
Phthalate Health Effects ... 14
D. Phthalates and Childhood Obesity ... 15
Proposed Biologic Mechanisms ... 15
vii
Epidemiological Evidence ... 18
E. Knowledge Gaps ... 19
CHAPTER III. Methods ... 21
A. Study Design Overview ... 21
B. Study Populations ... 21
Human Subjects ... 23
Study Sample for Specific Aim 1 ... 23
Study Sample for Specific Aim 2 ... 24
C. Exposure Assessment ... 25
Data Collection ... 25
Measures ... 25
D. Outcome Assessment ... 26
Body Composition ... 26
Anthropometry ... 28
E. Covariates ... 28
Variables Included in Outcome Models ... 28
Variables Included in Covariate Imputation Models ... 32
Variables Included as Predictors of Missing Outcomes... 33
F. Statistical Methods ... 33
Overview ... 33
Metabolite Concentrations Below the LOD ... 34
Missing at Random Covariate Data ... 34
Missing Creatinine Concentrations ... 36
Bayesian Priors for Multiple Metabolites ... 38
Covariate Adjustment ... 38
viii
Effect Measure Modification ... 39
Non-linear Dose Response ... 40
G. Sensitivity Analyses ... 41
Single Metabolite Models ... 41
Potentially Nonignorable Missing Outcomes ... 41
CHAPTER IV. Results for Specific Aim 1... 44
A. Introduction ... 44
B. Methods ... 45
Study population ... 45
Phthalate exposures ... 46
Outcome assessment ... 46
Covariates ... 47
Statistical analysis ... 48
Sensitivity analysis for loss to follow-up ... 51
C. Results ... 52
D. Discussion ... 53
E. Conclusions ... 57
F. Tables and Figures ... 58
CHAPTER V. Results for Specific Aim 2... 70
A. Introduction ... 70
B. Methods ... 71
Children’s Environmental Health Center cohorts... 71
Human subjects ... 72
Phthalate exposures ... 72
ix
Statistical analysis ... 74
C. Results ... 77
D. Discussion ... 79
E. Conclusions ... 82
F. Tables and Figures ... 84
CHAPTER VI. Conclusions ... 106
A. Summary of Findings ... 106
B. Strengths and Limitations... 111
Strengths ... 111
Limitations ... 112
C. Public Health Significance ... 115
D. Directions for Future Research ... 116
x
LIST OF TABLES
Table 1. Phthalate metabolite classification and concentrations measured in the 2001-2002 National Health and Nutrition Examination Survey (NHANES) ...13 Table 2. Cohen’s weighted Kappa coefficient for the agreement of urine dilution-
corrected phthalate metabolite quartiles based on either specific gravity or creatinine in the CCEH cohort, comparison of measured and imputed creatinine concentrations ...37 Table 3. Characteristics of participants at birth and follow-up, Mount Sinai
Children’s Environmental Health Study 1998 – 2002 ...58 Table 4. Distributions of phthalate metabolite concentrations in third trimester
maternal urine samples (N=180), Mount Sinai Children’s Environmental Health Study 1998 – 2002 ...60 Table 5. Percent fat mass distributions in the Mount Sinai Children’s
Environmental Health Study 1998 – 2002 ...61 Table 6. Age- and sex- standardized body mass index z-score distributions
in the Mount Sinai Children’s Environmental Health Study 1998 – 2002 ...62 Table 7. Adjusted associations between third trimester maternal urinary
phthalate metabolite concentrations and percent fat mass among children aged 4 to 9 years in the Mount Sinai Children’s Environmental Health Study 1998 – 2002 ...63 Table 8. Adjusted associations between third trimester maternal urinary
phthalate metabolite concentrations and percent fat mass among children aged 4 to 9 years in the Mount Sinai Children’s Environmental Health Study 1998 – 2002 ...65 Table 9. Sensitivity analyses for associations between third trimester maternal
urinary phthalate metabolite concentrations and percent fat mass among children aged 4 to 9 years in the Mount Sinai Children’s Environmental Health Study 1998 – 2002 ...67 Table 10. Adjusted associations between third trimester maternal urinary
phthalate metabolite concentrations and age- and sex- standardized body mass index z-scores among children aged 4 to 9 years in the Mount Sinai Children’s Environmental Health Study 1998 – 2002 ...68 Table 11. Characteristics of the study sample at baseline by cohort and pooled ...84 Table 12. Characteristics of the birth cohorts at baseline by cohort and pooled ...86 Table 13. Distributions of phthalate metabolite concentrations in maternal urine
xi
Table 15. Age- and sex- standardized body mass index, weight, and height z-score distributions (mean ± standard deviation) at follow-up by selected characteristics ...91 Table 16. Adjusted associations between prenatal urinary phthalate metabolite
concentrations and overweight/obese status and body mass index (BMI) z-scores among children aged 4 to 7 years, overall and by child’s sex ...92 Table 17. Adjusted associations between prenatal urinary phthalate metabolite
concentrations and overweight/obese status and body mass index (BMI) z-scores among children aged 4 to 7 years by race/ethnicity ...93 Table 18. Adjusted associations between prenatal urinary phthalate metabolite
concentrations and weight and height z-scores among children aged 4 to 7 years, overall and by child’s sex ...94 Table 19. Adjusted associations between prenatal urinary phthalate metabolite
concentrations and weight and height z-scores among children aged 4 to 7 years by race/ethnicity ...95 Table 20. Adjusted associations between prenatal urinary phthalate metabolite
concentrations and overweight/obese status by cohort, child’s sex, and race/ethnicity ...96 Table 21. Adjusted associations between prenatal urinary phthalate metabolite
concentrations and body mass index z-scores by cohort, child’s sex, and race/ethnicity ...98 Table 22. Adjusted associations between prenatal urinary phthalate metabolite
concentrations and weight z-scores by cohort, child’s sex, and race/ethnicity ... 100 Table 23. Adjusted associations between prenatal urinary phthalate metabolite
concentrations and height z-scores by cohort, child’s sex, and race/ethnicity ... 102 Table 24. Sensitivity analyses for confounding among metabolites and loss to
xii
LIST OF FIGURES
Figure 1. Association between prenatal phthalate exposure and childhood adiposity ...15 Figure 2. Adjusted associations between tertiles of third trimester maternal urinary
xiii
LIST OF ABBREVIATIONS AND SYMBOLS
BIA Bioelectrical impedance analysis BMI Body mass index
BzBP Benzylbutyl phthalate
CCEH Columbia Center for Children’s Environmental Health Study CDC Centers for Disease Control and Prevention
CI Credible interval DBP Dibutyl phthalates
DEHP Di-(2-ethylhexyl) phthalate DEP Diethyl phthalate
DIDP Di-isodecyl phthalate DINP Di-isononyl phthalate DMP Dimethyl phthalate DnOP Di-n-octyl phthalate
EPA Environmental Protection Agency GED General Educational Development
HOME Health Outcomes and Measures of the Environment Study IGF-1 Insulin-like growth factor 1
LOD Limit of detection MAR Missing at random MBzP Mono-benzyl phthalate MCMC Markov chain Monte Carlo MCNP Mono-(carboxynonyl) phthalate MCOP Mono-(carboxyoctyl) phthalate MCPP Mono- (3-carboxypropyl) phthalate
xiv MEHHP Mono- (2-ethyl-5-hydroxyhexyl) phthalate MEHP Mono-2-ethylhexyl phthalate
MEOHP Mono- (2-ethyl-5-oxohexyl) phthalate MEP Mono-ethyl phthalate
MiBP Mono-isobutyl phthalate MMP Mono-methyl phthalate MNAR missing not at random MnBP Mono-n-butyl phthalate
MSSM Mount Sinai Children’s Environmental Health Study NHANES National Health and Nutrition Examination Survey NIEHS National Institute for Environmental Health Sciences NTP National Toxicology Program
OR Odds ratio
PPAR Peroxisome proliferator-activated receptor SD Standard deviation
SES Socioeconomic status
T4 Thyroxine
T3 Triiodothyronine
1
CHAPTER I. INTRODUCTION AND SPECIFIC AIMS
Introduction A.
Childhood obesity rates increased substantially in the past several decades (Ogden and Carroll 2010). According to the most recent National Health and Nutrition Examination Survey (NHANES) population-based survey, 1 in 10 US children aged 2 to 5 years and nearly 1 in 5 children aged 6 to 19 years meets the definition of obese (Ogden et al. 2010). While energy balance is a key determinant of weight change, evidence suggests that well-known causes of obesity, including poor diet, physical inactivity, and genetic predisposition, may not fully account for the rapid increase in obesity rates (Heindel and vom Saal 2009; Keith et al. 2006).
Laboratory research supports the hypothesis that common environmental chemicals may negatively impact lipid regulation in favor of weight gain (Fromme et al. 2007; Heindel and vom Saal 2009; Janesick and Blumberg 2011). However, epidemiological studies of environmental causes of obesity are limited.
2
Maloney and Waxman 1999; Sargis et al. 2009). Epidemiologic studies, primarily cross-sectional, have reported associations between phthalate metabolite concentrations and body mass index (BMI), obesity, weight, or waist circumference in children (Boas et al. 2010; de Cock et al. 2014; Hatch et al. 2008; Teitelbaum et al. 2012; Trasande et al. 2013; Wang et al. 2013). Furthermore, effects of phthalates on body size may differ by child’s sex for metabolites of phthalates with anti-androgenic activity, as has been reported in studies of other developmental endpoints (Engel et al. 2009; Swan et al. 2010; Wolff et al. 2008). Identifying a link between prenatal phthalate exposures and childhood adiposity could have a substantial public health impact given that nearly 40% of US children are overweight or obese (Ogden et al. 2010).
The goal of this dissertation is to examine associations between phthalate concentrations measured in maternal urine collected during pregnancy and longitudinal measures of body size assessed during early childhood (ages 4 to 9 years) in three US birth cohorts: the Mount Sinai School of Medicine Children’s Environmental Health Center (MSSM) Study, the Columbia Center for Children’s Environmental Health (CCEH) Study, and Health Outcomes and Measures of the Environment (HOME) Study.
In Specific Aim 1, we examine the relationship between third trimester maternal urinary phthalate concentrations and percent fat mass among children aged 4 to 9 years in the MSSM cohort and evaluate effect measure modification by child’s sex. Bio-electrical impedance analysis was used to measure body composition (including percent fat mass) at follow-up visits scheduled at approximately ages 4-5.5, 6, and 7-9 years. MSSM is the only cohort that collected body composition data, which provides quantitative estimates of fat mass and is a more
3
concentrations and fat mass?) and 2) facilitating comparisons with other studies that do not have body composition data with which to evaluate potential obesogenic effects.
In Specific Aim 2, we estimate associations between phthalate concentrations measured in maternal urine collected during pregnancy and anthropometry outcomes (overweight or obesity, and weight, height, and BMI z-scores) collected at ages 4 to 7 years in the MSSM, CCEH, and HOME birth cohorts. All three cohorts collected longitudinal measures of
anthropometry using similar standardized protocols. This aim builds upon the findings of Aim 1 by replicating analyses of associations between prenatal phthalate concentrations and
anthropometry in two additional cohorts. Furthermore, pooling these data provides increased sample size to detect small effect sizes and explore effect measure modification by factors such as child’s sex and race/ethnicity.
For both aims, associations between biomarkers of prenatal phthalate exposure and longitudinal outcome measures are estimated using mixed effects models to account for repeated measures for each child. We fit these models using a flexible Bayesian framework to simultaneously account for the issues of missing exposure (metabolite concentrations below the limits of detection), covariate, and outcome data. We adjust for important confounders including maternal pre-pregnancy BMI, gestational weight gain, smoking during pregnancy, and
4 Specific Aims
B.
Specific Aim 1
Estimate associations of third trimester urinary phthalate metabolite concentrations with longitudinal assessments of percent fat mass collected from children aged 4 to 9 years in the MSSM cohort.
Sub Aim 1.1: Examine effect measure modification by child’s sex. Sub Aim 1.2: Estimate associations with BMI z-scores.
Specific Aim 2
Estimate associations of prenatal urinary phthalate metabolite concentrations with longitudinal assessments of overweight/obese status and BMI, weight, and height z-scores among children aged 4 to 7 years in the MSSM, CCEH, and HOME cohorts.
Sub Aim 2.1: Examine effect measure modification by cohort, child’s sex, and race/ethnicity.
Hypotheses
We hypothesize that higher prenatal phthalate concentrations will be positively associated with body size outcomes related to body fatness (i.e., percent fat mass, BMI, weight, and
5
CHAPTER II. REVIEW OF THE LITERATURE
Childhood Obesity A.
Prevalence and Impact of Childhood Obesity
Childhood overweight and obesity, defined as greater than the 85th and 95th percentile of BMI for age and sex among children under age 20, is an emerging epidemic in the United States (US) and around the world. Globally, over 43 million children under the age of 5 are overweight, of whom 35 million live in developing countries (World Health Organization 2011). In the US, 11.9% of children aged 2-19 are obese and 31.7% are overweight (Ogden et al. 2010). Children of African American and Hispanic ethnicity have a particularly high prevalence of overweight and obesity. The prevalences of overweight and obesity are higher among both non-Hispanic black (35.9%, 20.0%) and non-Hispanic (38.2%, 20.9%) children aged 2-19 compared to non-Hispanic white children (29.3%, 15.3%) (Ogden et al. 2010).
Obese children are at risk of becoming obese adults (Serdula et al. 1993), with the concomitant risks of diabetes, heart disease, cancer, and many other conditions. In addition, overweight and obese children exhibit early physiologic changes associated with these chronic health conditions. For example, a recent systematic review and meta-analysis reported that obese children aged 5 to 15 have signs of early cardiovascular disease including higher systolic and diastolic blood pressure, cholesterol, triglycerides, fasting insulin, insulin resistance, and left ventricular mass compared to their normal-weight peers (Friedemann et al. 2012). The
6 Measuring Body Size in Children
This dissertation utilizes two methods of assessing child body size: 1) bio-electrical impedance analysis (BIA) of body composition, and 2) anthropometric measurements of body size.
BIA is a body composition measurement method that provides estimates of fat-free mass and fat mass. BIA requires that a person stand barefoot on a device resembling a scale to make contact with electrodes that send current through the body. BIA measures impedance, or opposition to a weak electrical current flowing through body tissues. Lean body mass has a low impedance because it is mostly aqueous and conducts electricity well, whereas fat mass has high impedance. Impedance is proportional to total body water and is used to estimate fat-free mass.
As BIA is an indirect method for assessing body composition, estimates of fat-free mass are obtained by using the measured impedance values in prediction equations developed against a reference standard. Based on a two-compartment model of the body (fat mass and fat-free mass), fat-free mass can be subtracted from the individual’s weight to obtain an
estimate of fat mass (Ellis 2001; Houtkooper et al. 1996). Percent body fat is then estimated as 100 x (weight – fat free mass)/weight (Ellis 2001). Fat mass index and fat-free mass index are height-adjusted measures of fat and lean mass (fat mass index = fat mass / height2, fat-free mass index = fat-free mass / height2)(Freedman et al. 2005b; Lohman and Going 2006).
7
BIA relies on the assumption that fat-free mass has a relatively constant water content, which may not be the case among young children (Ellis 2001). Using pediatric-specific
prediction equations helps to reduce misclassification of fat-free mass. Tanita leg-to-leg BIA does not perform as well as gold standard estimators of body density such as underwater weighting or total body water by isotope dilution. However, validation studies have reported good performance of BIA measurements in comparison to gold standard measures (Jebb et al. 2000; Nunez et al. 1997; Xie et al. 1999) and BIA is considered a valid estimator of adiposity for epidemiology studies (Ellis 2001; Houtkooper et al. 1996). Benefits of BIA in comparison to other body composition techniques are that BIA is low cost, portable, and non-invasive (Houtkooper et al. 1996).
In contrast to BIA, anthropometry is an inexpensive and non-invasive method for measuring body characteristics that is commonly used in epidemiology studies. It includes measures of height, weight, and circumferences or lengths of various body regions.
Anthropometric measurements that are used to assess body fatness include metrics such as weight, BMI, or waist circumference. Because weight is a measure of total mass that
incorporates muscle, bone, organs, and fat, greater weight does not necessarily indicate greater adiposity. BMI is a measure of excess weight for height [BMI (kg/m2) = weight (kg)/height (m)2] that is widely used in field studies as an indicator of adiposity. Waist circumference is a measure of central adiposity.
8
85% of the reference population has a BMI percentile of less than 85. Overweight and obesity are clinical definitions of excess body fat that are defined using BMI percentiles, where
overweight is greater than the 85th percentile and obesity is greater than the 95th percentile.
Z-scores represent the difference between the individual’s value and the mean value in the
reference population divided by the standard deviation in the reference population. Z-scores are useful for longitudinal modeling of growth as the expected value at any time point is 0 if the population is a random sample of the population used to create the reference. Further, z-scores are standardized to the population standard deviation, reducing likelihood of heteroscedasticity. The 2000 CDC growth charts are often used in epidemiology studies to calculate age- and sex-specific percentiles or z-scores in reference to the US population (Kuczmarski et al. 2002). Using age- and sex-standardized measures facilitates valid comparisons in pediatric studies since children are in a period of rapid change with patterns that differ between girls and boys.
In children, BMI is a moderately sensitive and highly specific indicator of adiposity, and adolescents with a high BMI are at greater risk for adverse health outcomes in adulthood (Freedman and Sherry 2009). Evidence suggests that body composition methods may not outperform anthropometry when assessing associations between adiposity and metabolic risk factors (Stevens et al. 2008). For example, studies of blood pressure, blood glucose, high-density lipoprotein cholesterol, insulin, and triglycerides in adults have reported that
9 Environmental Causes of Obesity B.
Emerging evidence suggests that factors other than energy balance may contribute to the rapid rise in obesity rates (Heindel and vom Saal 2009; Keith et al. 2006) and several discoveries have led to a search for environmental causes of obesity. First, the concomitant increase in production of synthetic chemicals with rising obesity rates has implicated
environmental exposures as potential risk factors for obesity (Baillie-Hamilton 2002), although this putative link suffers from the ecological fallacy. Second, prenatal factors such as fetal growth restriction and gestational tobacco smoke exposure have been demonstrated to affect obesity risk, indicating that in utero environmental exposures may program an obesogenic phenotype (Braun et al. 2010a; Heindel and vom Saal 2009; Oken et al. 2008). Third, adipose tissue is now recognized to be an active endocrine organ with chemical and hormonal signaling, which makes it a potential target for endocrine disrupting chemicals (Cooke and Naaz 2004; Newbold et al. 2009). Taken together, these findings provide a basis for exploring the role of endocrine disrupting chemicals in promoting obesity.
The “environmental obesogen hypothesis” theorizes that prenatal exposure to endocrine disruptors increases susceptibility to obesity through a fetal programming mechanism that may 1) alter control of adipose tissue development pathways, 2) increase the number of fat cells, 3) modify food intake and metabolism, and 4) affect insulin sensitivity and lipid metabolism (Diamanti-Kandarakis et al. 2009; Grun and Blumberg 2009; Heindel and vom Saal 2009).
There is emerging human evidence of an association between prenatal or early life exposure to environmental endocrine disruptors and body size in childhood, particularly
10
childhood growth, and associations with polychlorinated biphenyls (PCBs) that depend on gender, timing, and dose (Tang-Peronard et al. 2011). Overall, these studies provide evidence that endocrine disrupting chemicals may alter childhood growth and lend support to the
obesogen hypothesis.
Phthalate Exposures and Health Effects C.
Phthalates are synthetic diesters of phthalic acid used in a variety of industrial and consumer products. Phthalates are often grouped by molecular weight, with low molecular weight phthalates having fewer than 8 carbons in the alkyl chain and high molecular weight having 8 or more carbons. High molecular weight phthalates are added to plastics to make them flexible and durable. Low molecular weight phthalates are used as adhesives, detergents, and solvents. Sources of phthalate exposure in consumer products are varied and include polyvinyl chloride plastics, building materials, medical devices, pharmaceuticals, automotive components, toys, food packaging, cosmetics, fragrances, and pesticides (Schettler 2006). Over three million metric tons are produced annually (Bizzari et al. 2000).
Human Exposure to Phthalates
11
Widespread phthalate exposure has prompted concern about potential adverse health effects, particularly with respect to fetal exposures since phthalate metabolites can cross the placenta (Mose et al. 2007). Due to these concerns, some phthalates have been regulated in consumer products in the US and abroad ([Anonymous] 2005a, b, 2008). The US federal regulations focus on reducing childhood exposures DEHP, DBP, and BzBP by regulating their presence in bath toys or other small plastic toys that can be mouthed by children. However, fetal exposure to phthalates may occur through maternal contact with phthalate-containing products, and, in some circumstances, banned phthalate diesters have merely been replaced by others that are both unstudied and unregulated.
Biomarkers of Phthalate Exposure
Biomarkers of phthalate exposure are a useful dosimeter because they incorporate exposure from multiple routes and sources. Phthalates can be measured in urine, serum, saliva, seminal fluid, breast milk, amniotic fluid, meconium, and placenta. However, urinary biomarkers of phthalate metabolites are the preferred method of measuring human exposure (Calafat and McKee 2006; Hogberg et al. 2008). Metabolite levels in urine are higher than in other media, can be more precisely measured, and are less intrusive to study subjects than collection of other biologic specimens. Measurement of phthalate metabolites rather than diesters also reduces the risk of contamination from phthalate-containing laboratory equipment, whereas the use of phthalate metabolite concentrations in blood or blood products as exposure biomarkers is questionable (Calafat et al. 2013).
12
Studies examining repeated urine samples over periods of up to 3 months have reported intraclass correlations between 0.2 and 0.8, indicating that a single sample may be useful to project long term exposure to some phthalates but not others (Adibi et al. 2008; Fromme et al. 2007; Hauser et al. 2004; Marcus et al. 2010). Within person reproducibility of urinary phthalate metabolite levels measured on consecutive days ranges from 0.5 to 0.8, depending on the phthalate (Hoppin et al. 2002). Thus, there is substantial variability in individual exposures over time and repeat samples are optimal for classifying an individual’s phthalate exposures.
However, many sources of phthalate exposure are frequent and may result in steady-state levels (Calafat and McKee 2006; Hauser et al. 2004). The probability of correctly classifying “high exposure” over a 6-12 week period by using a single sample was reported in two studies to range between 0.50 and 0.74, depending on the metabolite (Adibi et al. 2008; Hauser et al. 2004). Urinary concentrations of phthalate metabolites in a single urine sample may be
1
3
Table 1. Phthalate metabolite classification and concentrations measured in the 2001-2002 National Health and Nutrition
Examination Survey (NHANES)
Class Phthalate Abbreviation Metabolite Abbreviation NHANES* median (µg/g)
Total Population Pregnant Women
Low Molecular Weight
Dibutyl DBP Mono-isobutyl MiBP 2.5 3.3
Mono-n-butyl MnBP 17.4 22.7
Diethyl DEP Mono-ethyl MEP 97.4 306.4
Dimethyl DMP Mono-methyl MMP 1.3 2.1
High Molecular Weight
Benzylbutyl BzBP Mono-benzyl MBzP 9.7 15.7
Di-2-ethylhexyl DEHP Mono-2-ethylhexyl MEHP 3.9 10.4
Mono- (2-ethyl-5-hydroxyhexyl) MEHHP 16.6 22.8
Mono- (2-ethyl-5-oxohexyl) MEOHP 11.2 17.8
Mono- (2-ethyl-5-carboxypentyl) MECPP 27.0† n/a
Di-n-octyl DnOP Mono- (3-carboxypropyl) MCPP 2.5 3.5
Di-isodecyl DIDP Mono-(carboxynonyl) MCNP 4.5‡ n/a
Di-isononyl DINP Mono-(carboxyoctyl) MCOP 2.5‡ n/a
* Median creatinine-corrected concentration among the total population (Centers for Disease Control and Prevention) and pregnant women (Ye et al. 2009)
†
MECPP concentration in the 2003-2004 NHANES (not measured in 2001-2002)
‡
14 Phthalate Health Effects
Phthalate metabolite biomarker concentrations are among the highest of all endocrine disrupting chemicals (EDCs), and phthalates interfere with hormone homeostasis in animal, human, and in vitro studies (Committee on the Health Risks of Phthalates 2008; Shen et al. 2009). Experimental animal studies have reported adverse reproductive and developmental outcomes due to phthalate exposure and suggest that phthalates may have endocrine-disrupting properties (Lyche et al. 2009). A collection of reproductive endpoints observed in male animals following phthalate exposures, termed the phthalate syndrome, includes reduced sperm counts, histological changes in the testes, cryptorchidism, hypospadias, and reduced fertility (National Science Foundation 2008). Developmental outcomes observed in animals exposed to phthalates include reduced weight gain and survival of pups, male reproductive tract malformations, neural tube defects, and developmental delays (National Toxicology Program (NTP) 2003a, b, c, d, e, f, 2006).
There is a small but growing epidemiologic literature on potential adverse human health effects of phthalates. Human in utero exposure has been linked to altered gestational duration, reduced anogenital distance in boys, and impaired behavior and executive functioning skills (Adibi et al. 2009; Engel et al. 2010; Latini et al. 2003; Swan et al. 2005; Swan 2008; Whyatt et al. 2009; Wolff et al. 2008). Reproductive, respiratory, metabolic, and thyroid effects in children and adults have also been reported (Bornehag and Nanberg 2010; Duty et al. 2003; Hatch et al. 2008; Hauser et al. 2006; Huang et al. 2007; Stahlhut et al. 2007). A recent review of the state of the literature on phthalate exposures and children’s health concluded that consistent
evidence from well-designed studies support the existence of an association between early life DEHP and BzBP exposures and allergic diseases, with more limited evidence for associations of phthalate exposures with infant birth size, gestational length, physical development,
15 Phthalates and Childhood Obesity D.
Proposed Biologic Mechanisms
Evidence suggests that phthalates may promote an obesogenic phenotype by altering peroxisome proliferator-activated receptors (PPARs), affecting hormone levels, or acting as anti-androgens (Figure 1). Phthalate metabolites have been shown to modify PPARs alpha and gamma in animal models, which may influence developmental programming of the metabolic system by increasing adipogenesis and altering insulin and leptin levels. Animal evidence indicates that phthalate exposures affect hormone signaling and cross-sectional studies in humans have reported associations between concentrations of some phthalate metabolites and thyroid hormone levels. Additionally, several phthalates exhibit anti-androgenic activity, which may cause sex-specific changes in muscle and fat development.
Figure 1. Association between prenatal phthalate exposure and childhood adiposity
PPARs are nuclear receptor proteins that activate gene expression and have important roles in regulating energy metabolism, cell proliferation, and inflammation. PPAR alpha is expressed in several body compartments including liver and adipose tissue and is an important regulator of glucose metabolism. Studies of PPAR alpha null mice have shown altered lipid
Prenatal Phthalate Exposure
↑ adipogenesis, altered insulin and leptin levels
Childhood Adiposity peroxisome
proliferator-activated receptors
↓ androgen activity thyroid and growth hormone levels
changes in muscle and fat
16
homeostasis and fatty acid metabolism. PPAR gamma is expressed in adipose tissue and plays a key role in adipogenesis, insulin sensitivity, and lipid storage.
Phthalate metabolites have been shown to modify PPARs alpha and gamma in animal models, which may influence developmental programming of the metabolic system by
increasing adipogenesis and altering insulin and leptin levels (Bility et al. 2004; Boberg et al. 2008; Casals-Casas et al. 2008; Desvergne et al. 2009; Feige et al. 2010; Hurst and Waxman 2003; Lampen et al. 2003; Maloney and Waxman 1999; Sargis et al. 2009). The experimental animal literature has focused primarily on DEHP or its metabolites as they are known to be hepatotoxic and PPAR alpha is expressed in liver. These studies indicate that DEHP and its metabolites affect both PPAR alpha and gamma expression. Studies have also reported
changes in PPAR alpha and gamma expression associated with DBP and BzBP but not DMP or DEP metabolites.
If phthalates affect obesity through a PPAR mechanism, associations might also be observed between phthalate exposures and diabetes because PPARs regulate glucose homeostasis. Cross-sectional studies have reported associations between phthalates and diabetes or insulin resistance in adults, though results were inconsistent regarding which phthalates were associated with outcomes and whether metabolites were associated with increased, decreased, or no difference in prevalence of diabetes (James-Todd et al. 2012; Lind et al. 2012b; Stahlhut et al. 2007; Svensson et al. 2011).
17
be influenced by phthalates. In utero DBP and DEHP exposure in rats has been reported to increase mRNA expression for IGF pathway genes (Bowman et al. 2005; Lin et al. 2008). Though cross-sectional studies do not provide causal evidence, reports of associations between urinary phthalate metabolites and thyroid hormones, including T3, T4, thyroglobulin, and thyroid-stimulating hormone, have generally found inverse associations (Boas et al. 2010; Huang et al. 2007; Meeker et al. 2007; Meeker and Ferguson 2011).
Androgens are sex steroid hormones with key roles in male reproductive development. Studies have consistently reported effects of in utero DEHP, BzBP, and DBP exposures on male androgen-related reproductive endpoints in rats and mice, including hypospadias, cryptorchidism, reduced testosterone production, and decreased sperm counts (Fisher 2004; Gray et al. 2006; Lottrup et al. 2006; Pan et al. 2006). Two prospective studies have examined early life phthalate exposures in relationship to androgen-mediated effects. Swan et al. reported associations between prenatal levels of MEP, MBP, and DEHP metabolites and shortened anogenital distance, reduced penile width, and incomplete testicular descent (Swan 2008). Main et al. reported correlations between MEP, MBP, MMP, MEHP, and MINP in breast milk and reproductive hormone levels in the serum of 3 month old boys (Main et al. 2006).
18 Toxicological Evidence
Toxicological studies have directly assessed the role of early life exposure to DEHP or its hydrolytic metabolite, MEHP, in the development of obesogenic phenotypes, with results indicating species- and dose-specific effects. Two studies of perinatal MEHP or DEHP exposure in mice reported increased body weight and fat deposition in offspring, though one study
observed effects only at the lowest dose (0.05 but not 0.25 or 0.5 mg MEHP/kg/day) (Hao et al. 2012) and the other reported effects only at the highest dose (5 but not 0.05 mg DEHP/kg/day) (Schmidt et al. 2012). Two studies of pregnant rats exposed to doses ranging from 1 to 400 mg DEHP/kg/day reported no difference in offspring total body weight (Campioli et al. 2014;
Kobayashi et al. 2006). In contrast, relatively high dose DEHP exposure (2% by body weight) induced PPAR alpha-mediated reductions in body weight and fat mass in both rats (Itsuki-Yoneda et al. 2007) and mice (Xie et al. 2002). Interestingly, Feige et al. reported that although high dose DEHP exposure (500 mg/kg body mass/day) protected against diet-induced obesity via PPAR alpha activation in wild-type mice, mice with humanized PPAR alpha gained more weight and adipose tissue than untreated controls (Feige et al. 2010). While the causes of species differences remain unclear, effects of DEHP on other, less understood pathways (e.g., liver metabolism, thyroid function, or androgen activity) may play a role.
Epidemiological Evidence
19
recent review of the literature on phthalates and body size concluded that findings are
inconsistent regarding which phthalates are associated with outcomes or whether associations are positive or inverse (Goodman et al. 2014). Furthermore, a causal link between phthalate exposures and subsequent body size cannot be established in cross-sectional studies that measure concurrent exposures and outcomes (Engel and Wolff 2013).
In the only previous study of early life phthalate exposure and BMI in humans, de Cock et al. examined quartiles of DEHP metabolite concentrations measured in cord blood (likely reflecting primarily intrapartum exposures) in relation to repeated BMI measurements in the first year of life among 89 Dutch infants (de Cock et al. 2014). Children in the lowest MECPP quartile and boys in the lowest MEOHP quartile had higher BMI in the first year, though there was no evidence of dose-response and the same pattern was not observed for MEHHP, another
secondary oxidative metabolite of DEHP. This study has several important limitations. Analyses were stratified by phthalate quartile and sex yielding very small sample sizes at each time point (<10). Further, the use of phthalate metabolite concentrations in blood or blood products as exposure biomarkers is questionable (Calafat et al. 2013). While the authors only measured secondary or oxidative metabolites, that may reflect true biological exposures, it is possible that cord plasma DEHP metabolites arise from hospital-based exposures to DEHP at the time of delivery (Vandentorren et al. 2011; Yan et al. 2009).
Knowledge Gaps E.
20
Cross-sectional analyses cannot disentangle the temporal ordering of exposure and outcome; it is unclear whether phthalate exposures are causally related to obesity or phthalate body burden differs in obese individuals due to differences in exposure to phthalate sources. For example, it is plausible that phthalate exposures differ among obese individuals due to differences in exposure through 1) dietary sources, both amount and types of foods (Serrano et al. 2014), 2) personal care product use, due to larger surface area, (Buckley et al. 2012; Duty et al. 2005; Just et al. 2010; Watkins et al. 2014) or 3) medications to treat comorbid conditions, since DBP and DEP are used to coat some medications (Hernandez-Diaz et al. 2013).
21
CHAPTER III. METHODS
Study Design Overview A.
This dissertation assesses associations between maternal urinary phthalate metabolite concentrations during pregnancy and longitudinal measures of childhood body size among members of the MSSM, CCEH, and HOME birth cohorts. Specific Aim 1 assesses the association of third trimester maternal urinary phthalate concentrations and percent fat mass during childhood in the MSSM cohort, the only study that assessed body composition. Specific Aim 2 examines prenatal phthalate exposures in relation to anthropometry outcomes in all three cohorts and assesses effect measure modification and dose-response in this larger pooled sample. For both aims, we used a Bayesian multilevel modeling framework to incorporate multiple observations per child, stabilize estimates of correlated phthalate metabolites, and account for missing data in exposures, covariates, and outcomes.
Study Populations B.
22
pairs for whom birth data are available. Children attended follow-up clinic visits scheduled at approximately ages 1, 2, 4, 6, and 7 years. Data regarding maternal characteristics were collected by an in person, two hour structured interview administered to mothers by trained research assistants during third trimester prenatal care visits. This questionnaire was
administered to all mothers (n = 404) and ascertained information on environmental exposures, sociodemographic characteristics, maternal health, and lifestyle habits. Pregnancy and delivery characteristics, birth outcomes, gestational age, and infant sex were ascertained from the computerized perinatal database at Mount Sinai Hospital. Duration of breastfeeding was ascertained by maternal questionnaire at the earliest follow-up visit. A number of studies within this sample have been published (Berkowitz et al. 2003; Berkowitz et al. 2004; Engel et al. 2007; Engel et al. 2009; Engel et al. 2010; Wolff et al. 2007; Wolff et al. 2008).
The Columbia Center for Children’s Environmental Health enrolled 727 pregnant women between 1998 and 2006. The cohort was restricted to non-smoking women 18-35 years old who self-identified as either African American or Dominican and who had resided in Northern
Manhattan or the South Bronx in New York City for >1 year prior to pregnancy. Women were excluded if they used illicit drugs; had diabetes, hypertension, or known human
immunodeficiency virus; or had their first prenatal visit after gestational week 20. Women were enrolled if a 48-hour personal air sample was collected during their third trimester and a blood sample was collected from the mother and/or newborn at delivery. The cohort was
predominantly full term (no infant was born <32 weeks gestation or <1500g). Follow-up visits were conducted at 6 months and 1, 2, 3, 5, and 7 years. Investigations of this sample have been previously published (Adibi et al. 2008; Adibi et al. 2009; Just et al. 2010; Perera et al. 2006; Perera et al. 2003; Whyatt et al. 2009).
23
nested, randomized trial of in-home lead and injury hazard controls women had to be living in housing built before 1978. Additional eligibility criteria included: <19 weeks gestation upon enrollment; living in Brown, Butler, Clermont, Hamilton or Warren counties in Ohio; intention to continue prenatal care and deliver at collaborating obstetric practices; human immunodeficiency virus negative; and not receiving seizure, thyroid, or chemotherapy/ radiation medications. A total of 389 women delivered live-born, singleton infants without birth defects. Children returned for annual follow-up visits between 1 and 5 years of age. Characteristics of this sample have been previously described (Braun et al. 2009; Braun et al. 2010a; Braun et al. 2010b; Braun et al. 2011).
Human Subjects
Women provided informed consent prior to participation and children aged ≥ 7 years provided assent. The MSSM, CCEH, and HOME studies received approval from the Institutional Review Boards of the Mount Sinai School of Medicine, Columbia University, and the University of Cincinnati College of Medicine, respectively. The involvement of the Centers for Disease Control and Prevention (CDC) laboratory was determined not to constitute engagement in human subjects research.
This dissertation utilizes previously collected, de-identified data and no study participants were contacted for additional information. The project was approved by the Institutional Review Board of the University of North Carolina at Chapel Hill on February 13, 2012.
Study Sample for Specific Aim 1
24
maternal prenatal phthalate metabolite concentrations were available for 182 children. Following previous work (Wolff et al. 2008), we excluded two observations obtained from a very dilute urine sample (<10 mg/dL creatinine) due to the potential for inaccurate biomarker
measurements. Thus, the final sample for Specific Aim 1 is 180 children with body composition and anthropometry measurements collected at a total of 364 follow up visits.
Study Sample for Specific Aim 2
Specific Aim 2 utilizes data from all three cohorts. These studies were designed with many common features and the feasibility of pooling data is supported by the following circumstances: (1) urine samples were collected during the same period of pregnancy and levels are comparable across cohorts; (2) urine samples were analyzed for phthalate
metabolites at the same laboratory; (3) body size assessment protocols were performed in the same manner at each study site; (4) there are overlapping ages at which outcomes were
assessed between the studies; and (5) there is information on key confounding factors available from all cohorts.
The study population for Specific Aim 2 includes children in the MSSM, CCEH, and HOME studies with measured maternal urinary phthalate concentrations during pregnancy. We excluded infants born at <32 weeks gestation or <1500 grams (n = 1 CCEH and 5 HOME cohort members) and samples with a very dilute urine concentration (<10 mg/dL creatinine, n =
25 Exposure Assessment
C.
Data Collection
Women provided a spot urine sample at mean ± standard deviation (SD) gestational ages of 31.6 ± 5.1 (MSSM), 34.4 ± 3.0 (CCEH), and 27.1 ± 2.2 (HOME) weeks. All three cohorts shipped third trimester spot urine specimens to the laboratory of Dr. Antonia Calafat at the Centers for Disease Control and Prevention (CDC) where samples were analyzed for phthalate metabolites. Sample collection and storage as well as analytic methods and quality control procedures have been previously described (Kato et al. 2005; Silva et al. 2008; Valentin-Blasini et al. 2007). The CDC lab is Clinical Laboratory Improvement Amendments certified and follows strict quality control protocols that are enforced by post-analysis independent statistical review before release of results. Internal batches include blanks and urine pools whose results must conform to a stipulated quality control range, or else the batch is rerun (Norrgran et al. 2006; Westgard et al. 1981). In addition, a blind pool is incorporated every tenth sample. When results for a batch’s external quality control deviate from the overall values, CDC reruns that batch (specimens are retained until the study is complete). Correction factors were applied to MBzP (0.72) and MEP (0.66) concentrations and limits of detection (LOD) to adjust for inaccuracies in analytical standards (Centers for Disease Control and Prevention 2012).
Measures
Phthalate metabolites measured in all three cohorts include MBP, MIBP, MEP, MBZP, MCPP, MEHP, MEHHP, MEOHP, and MECPP. Following previous work (Wolff et al. 2008), we examined DEHP metabolites (MECPP, MEHHP, MEHP, MEOHP) as a micromolar sum
26
To facilitate comparison of phthalate effect sizes in each Aim, we standardized the natural log concentration of each phthalate metabolite to its mean and SD. For Specific Aim 2, we standardized metabolites to their distributions in the pooled sample. To examine non-monotonic associations (e.g., threshold effects), we also explored the form of exposure-response relationships using quantile groups (tertiles for Aim 1 and quartiles for Aim 2). For these analyses, we categorized exposure using creatinine-corrected concentrations
(micrograms per gram creatinine for metabolites or micromoles per gram creatinine for ∑DEHP).
Outcome Assessment D.
Body Composition
MSSM assessed body composition of children using leg-to-leg BIA at study visits
scheduled at approximately 4-5.5, 6, and 7-9 years of age (1-3 study visits per child). The Tanita scales were donated by the company and are not commercially available (Tanita TBF-300). These scales were specifically designed for use in pediatric research with features such as small foot pads. Study staff were trained to use the BIA equipment using standard protocols.
There is no agreed upon set of prediction equations for BIA analysis in children. The Tanita scales feature a built-in, proprietary pediatric prediction equation for calculating body composition estimates. The product specifications note that the built-in pediatric equations are valid for children aged 7 years and older. The prediction equations cannot be directly validated since body composition measures using gold or alloyed gold standard methods are unavailable in this cohort (e.g., dual-energy X-ray absorptiometry, underwater weighing).
As an exploratory analysis, we compared the body composition values calculated by the Tanita scale to values estimated using two validated equations in the published literature
27
composition equations in a population of 436 white, non-Hispanic children aged 5-11 (Clasey et al. 2011a). The study population included overweight and obese children in order to generate equations that are valid in these children, which have been underrepresented in samples used to validate other pediatric body composition equations. Unpublished work by these authors reported that the equation performs equally well among a sample of non-Hispanic black and bi-racial children (Clasey et al. 2011b). The Clasey et al. equation predicts fat-free mass on the basis of height, weight, and impedance values.
Horlick et al. generated equations based on a multi-ethnic population of 1170 New York City children aged 4-18 (Horlick et al. 2002). They published two sets of equations. The first equation predicts fat-free mass based on height, impedance, weight, age, and sex. The second equation additionally includes race/ethnicity and Tanner stage. Because Tanner staging is not available in the MSSM cohort, only the first equation was evaluated.
The Horlick et al. equation performed very poorly in our sample, with 103 of 364 fat-free mass estimates exceeding the child’s total mass. Therefore, we did not evaluate this equation further. The Clasey et al. equation performed better, with estimated fat-free mass values exceeding total mass for only two children. The Pearson correlation coefficient between percent fat mass estimated using the Clasey et al. equation versus the built-in Tanita equation was very high (0.97).
This similarity is not unexpected, as previous studies have shown that various prediction equations perform similarly well in terms of 1) the correlation between predicted and observed total body water and fat-free mass (Horlick et al. 2002) and 2) the rank order of children by body fat mass (Williams et al. 2007). Based on this exploratory analysis, we used the Tanita
28 Anthropometry
Weight and height were measured at follow-up visits scheduled for approximately ages 4-5.5, 6, and 7-9 years (MSSM), 5 and 7 years (CCEH), and 4, 5, and 7-9 years (HOME). In all three cohorts, study staff obtained anthropometric measurements using standard, uniform protocols for standing height and weight. We obtained body size measures from children in bare or stocking feet wearing light clothing (i.e., pediatric gown, underwear, or shorts and a t-shirt). We measured weight using a digital scale (HOME and CCEH 5 year visit) or a pediatric Tanita scale (MSSM and CCEH 7 year visit) (models TBF-300 and BC-418, Tanita Corporation of America, Arlington Heights, Illinois) and determined height using wall-mounted stadiometers.
We calculated BMI as weight (kg) / height (m)2 and computed age- and sex-standardized BMI, weight, and height z-scores and percentiles using a CDC SAS macro (Centers for Disease Control and Prevention 2004). For Specific Aim 2, we also classified children at each follow-up visit as overweight or obese if their age- and sex-standardized BMI percentile exceeded 85.
Covariates E.
Variables Included in Outcome Models
Each birth cohort administered questionnaires during pregnancy and early childhood and gathered additional information on the health status of mothers and children from medical and birth records. We identified variables on confounding pathways using directed acyclic graphs. These covariates included the following variables, which are described in greater detail below.
• Maternal race/ethnicity • Maternal age
• Maternal education
29 • Maternal smoking during pregnancy • Maternal pre-pregnancy BMI
• Maternal height
• Adequacy of gestational weight gain (Specific Aim 1) • Gestational weight gain (Specific Aim 2)
• Calendar date of urine collection • Urine dilution
• Child’s sex
• Breastfeeding
• Months of age at follow-up • Physical activity (Specific Aim 1) • Cohort (Specific Aim 2)
There are differences in both phthalate exposure patterns (Silva et al. 2004) and childhood obesity risk (Ogden et al. 2010) by race and ethnic group. We thus included
race/ethnicity as a covariate and examined whether associations of phthalate metabolites with childhood body size were heterogeneous by race/ethnicity. Mother’s self-reported race/ethnicity was categorized as non-Hispanic white, non-Hispanic black, Hispanic, or other. In Specific Aim 1, we grouped children of Hispanic and other race/ethnicity based on the similarity of their outcome and covariate distributions. In Specific Aim 2, all four categories were included.
Phthalate exposures vary by age (Silva et al. 2004) and maternal age is a known risk factor for various pregnancy outcomes including fetal growth. Maternal age at delivery was ascertained using the mother’s birth date and the date of delivery in all three cohorts.
30
of MBZP and lower levels of DEHP metabolites (Kobrosly et al. 2012). Prevalence of childhood obesity also varies by SES. Therefore, we included two measures of maternal SES in our analyses: maternal education and maternal work status during pregnancy. Maternal education was ascertained using the baseline questionnaire in all cohorts. We categorized education as <high school, high school or General Educational Development (GED), some college, or ≥college degree. For Specific Aim 1, we further dichotomized maternal education as <college degree or ≥college degree based on distributions with exposures and outcomes. For Specific Aim 2, we included all four categories. Maternal work status was ascertained by questionnaire. For both Aims, we classified women as either employed or as a homemaker or student.
Parity is associated with birth weight, which is in turn related to childhood adiposity, and increasing number of siblings has been associated with lower BMI. Parity may also be related to differences in phthalate exposure sources such as personal care product use. Specific Aim 1 did not include this variable as MSSM restricted to primiparous women. For Specific Aim 2, we assessed parity by questionnaire at baseline and classified women as primaras or multiparas. We also examined modification by parity as a sensitivity analysis exploring the influence of cohort restriction criteria.
Gestational smoke exposure is a risk factor for childhood obesity (Oken et al. 2008). We classified pregnancy smoking status as either active or passive using different criteria for each cohort. For MSSM, we determined maternal smoking during pregnancy based on self-report. For HOME, we classified women as active smokers during pregnancy if the average of three cotinine concentrations (measured at 16 weeks, 26 week, and birth) exceeded 3 ng/mL
31
Maternal BMI is a strong predictor of offspring BMI (Salsberry and Reagan 2005; Weng et al. 2012) and may be associated with differences in phthalate exposure sources (e.g., diet, personal care products, medication use). We calculated pre-pregnancy BMI based on maternal self-reported weight and height (kg/m2) at enrollment. We adjusted for maternal height due to its genetic influence on child body size.
Gestational weight gain may be associated with offspring adiposity (Weng et al. 2012) and with phthalate exposures through diet, personal care products, or medication use. We calculated gestational weight gain as the last pregnancy weight (measured or reported by the mother) minus self-reported pre-pregnancy weight. For Specific Aim 1, we calculated adequacy of gestational weight gain as the ratio of observed gestational weight gain to the expected gestational weight gain based on the 2009 Institute of Medicine recommendations: (observed weight gain / expected weight gain ) x 100 (Bodnar et al. 2010). Expected weight gain was calculated as follows: recommended weight gain in the first trimester + (gestational age at delivery – 13 weeks) x recommended second and third trimester weekly rate of gain. Recommended weight gains are based on the mother’s pre-pregnancy BMI. We used the continuous adequacy of weight gain variable in all models. For tabular display of distributions, adequacy of weight gain was categorized as less than recommended (<86%), recommended (86-120%), or more than recommended (>120%) (Bodnar et al. 2011). We did not calculate adequacy of gestational weight gain for Specific Aim 2 as pre-pregnancy BMI was missing for some CCEH and HOME participants and therefore we were not able to determine
recommended weight gains for each trimester of pregnancy. Instead, we adjusted for gestational weight gain (lbs) as a continuous variable.
We adjusted for calendar date of urine collection to account for temporal trends in phthalate exposures and prevalence of childhood obesity.
32
CCEH measured specific gravity in all urine samples (n = 339), with creatinine additionally measured in a subset (n = 137). Methods for adjusting for urine dilution in Specific Aim 2 are described below.
Child’s sex was ascertained from birth records and included as a covariate in both Specific Aims. There are sex differences in the distribution, amount, and timing of fat accumulation in boys and girls. Because there may be anti-androgen mediated effects of phthalate exposures on body size, child’s sex was evaluated as an effect measure modifier.
Although breastfeeding occurs after phthalate exposure, it has been associated with childhood BMI (Weng et al. 2012) and may lie on an unblocked backdoor path between
phthalate exposures and body size outcomes. Breastfeeding was assessed by questionnaire at follow-up and categorized as ever/never.
We adjusted for age at follow-up (in months) to account for variation in child body size measures by age. In models of continuous outcomes, we also included an interaction between age at follow-up and child’s sex due to differences in distributions by age and sex.
In an effort to increase precision of our estimates for Specific Aim 1, we adjusted for physical activity at each follow-up visit. For MSSM, we classified children as active if the parent/caretaker reported the child was “active most of the time” or inactive if the child was “active some of the time” or “hardly at all”. Physical activity information was not available for CCEH or HOME and was therefore not considered for inclusion in Specific Aim 2.
Finally, for Specific Aim 2, we adjusted for cohort in all pooled analyses to account for unmeasured differences in study populations and protocols that may influence phthalate exposures, childhood adiposity, and covariate values.
Variables Included in Covariate Imputation Models
33
predict maternal last pregnancy weight. For Specific Aim 2, we included gestational age at urine collection as a predictor of urinary creatinine concentration. We calculated gestational age at urine collection by subtracting the number of weeks between urine collection and delivery from the gestational age at delivery (weeks) reported on the medical record.
Variables Included as Predictors of Missing Outcomes
For Specific Aim 2, we included four additional variables reported in a previous study to predict subject retention in the CCEH cohort (Rundle et al. 2012). Receipt of public assistance during pregnancy (yes/no) and maternal satisfaction with living conditions (5 point Likert scale) were ascertained by questionnaire at enrollment. Two neighborhood-level characteristics, poverty rate and Spanish language linguistic isolation, were determined using census data within a 1 kilometer radius of the participant’s residence at enrollment.
Statistical Methods F.
Overview
34 Metabolite Concentrations Below the LOD
It has become standard practice to set biomarker values below the LOD to a fixed value. This approach results in appreciable bias when greater than 5-10% of the concentrations are non-detects (Lubin et al. 2004). In the MSSM, CCEH, and HOME studies, all phthalate metabolites except for MEHP were measured above the detection limits in ≥95% of urine samples. MEHP is a hydrolytic metabolite of DEHP and was used to calculate the ∑DEHP variable but was not examined on its own. Thus, using a single replacement technique is unlikely to bias effect estimates. In Specific Aim 2, where the values of the LODs differed between cohorts due to changes in CDC laboratory methodologies over time, we set phthalate metabolite concentrations below the LOD to the value of the LOD divided by the square root of two (Hornung and Reed 1990).
In Specific Aim 1, we utilized an alternative approach to account for phthalate metabolite concentrations below the LOD by imputing values from a truncated normal distribution. This approach has been applied in previous studies (Carmichael et al. 2010; Uh et al. 2008). For each metabolite, the parameters of the truncated normal distribution were defined by the mean and SD of the observed distribution, a lower bound of 0, and an upper bound set equal to the LOD. The natural logs of these parameters were used to impute natural log metabolite
concentration values at each iteration of the Markov chain Monte Carlo (MCMC) algorithm using the WinBUGS package djl.trunc.norm. The ΣDEHP variable was computed using the
component metabolite values (MEHP, MEHHP, MECPP, MEOHP) at each MCMC iteration.
Missing at Random Covariate Data
35
observed or expected relationships between each missing covariate and variables measured in the study population.
In Specific Aim 1, we imputed missing values for adequacy of gestational weight gain (n = 22), breastfeeding (n =1), and physical activity at follow-up (n = 3 children with 8 visits). Missingness in the adequacy of gestational weight gain variable was due to missing last pregnancy weights. Therefore, we included a linear regression model to predict last pregnancy weight on the basis of maternal education, race/ethnicity, sex, smoking during pregnancy, work status during pregnancy, maternal age at delivery, birth weight, maternal height, gestational age, maternal first pregnancy weight, and maternal pre-pregnancy BMI. The predicted last pregnancy weight was then used to calculate adequacy of gestational weight gain at each iteration of the MCMC algorithm, as described in Section E above.
The missing breastfeeding value was multiply imputed using a logistic regression model on the basis of maternal education, race/ethnicity, child’s sex, maternal smoking and work status during pregnancy, maternal age at delivery, adequacy of gestational weight gain, maternal pre-pregnancy BMI, and birth weight.
In contrast to the previous two variables that were measured once per child, physical activity was assessed at each follow-up visit. Therefore, we included a logistic mixed effects regression model with random intercepts to predict missing physical activity values at each follow-up visit on the basis of race/ethnicity, maternal pre-pregnancy BMI, maternal smoking during pregnancy, age (in months), birth weight, and child’s sex.
For each variable with missing data, we included quadratic or cubic terms for continuous predictors if they exhibited non-linear relationships among those without missing data
36
maternal last pregnancy weight. We used the same set of predictors for these three
anthropometric variables: cohort, race/ethnicity, maternal education, parity, maternal smoking and work status during pregnancy, child’s sex, maternal age at delivery, and the other maternal anthropometric variables (e.g., for maternal first pregnancy weight, we included maternal height and maternal last pregnancy weight). Linear, quadratic, and cubic terms were included for maternal age and maternal anthropometric variables to allow for non-linear relationships. Maternal pre-pregnancy BMI and gestational weight gain were then calculated using the
imputed values at each iteration of the MCMC algorithm. We also included a logistic regression model for missing breastfeeding values (n = 6) based on cohort, maternal education,
race/ethnicity, parity, and maternal smoking during pregnancy.
Missing Creatinine Concentrations
In Specific Aim 2, we used a similar approach to multiply impute missing creatinine concentrations. As mentioned previously, CCEH measured specific gravity in all urine samples (n = 339), with creatinine additionally measured in a subset (n = 137). To obtain a common measure of urine dilution, we multiply imputed missing natural log creatinine concentrations in CCEH using a linear regression model at each iteration of the MCMC algorithm in our Bayesian models. Independent variables included specific gravity; gestational age and calendar date at urine collection; maternal education, race/ethnicity, parity, BMI, and height; child’s sex; and gestational weight gain. Higher order polynomials were included for specific gravity, gestational age and calendar date at urine collection, and maternal height as they exhibited non-linear associations with creatinine among those with measured values.
37
posterior mean creatinine concentration predicted by our model to each participant without a creatinine measurement.
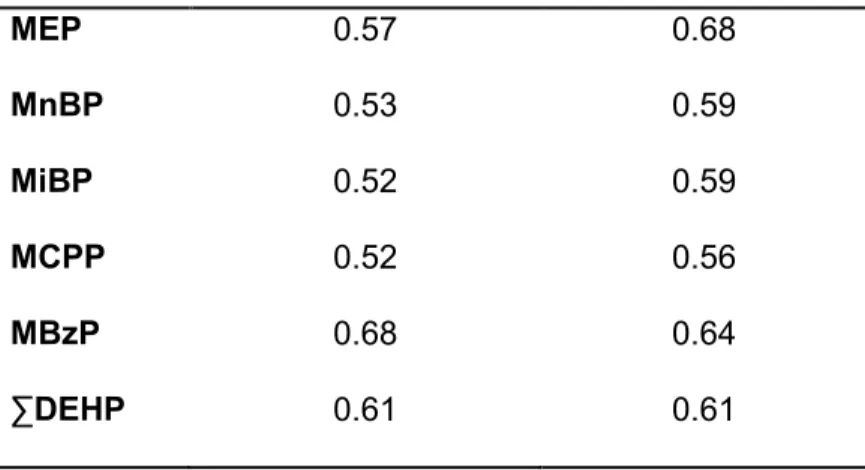
We explored the performance of the imputation model by setting a random 25% sample of measured creatinine concentrations to missing and assessing the Spearman correlation coefficient between the true values and posterior mean values predicted by our model (R2 = 0.61). Additionally, we compared assignment of CCEH participants into exposure quartiles using metabolite concentrations corrected for either specific gravity or creatinine. Cohen’s weighted Kappa coefficients were similar among those with measured or imputed creatinine
concentrations (Table 2). Although this analysis does not directly evaluate the validity of the
creatinine prediction model, it indicates that the imputed values agree with specific gravity as well as the measured creatinine concentrations in terms of classifying phthalate metabolite concentrations into quartiles based on urine dilution.
Table 2. Cohen’s weighted Kappa coefficient for the agreement of urine
dilution-corrected phthalate metabolite quartiles based on either specific gravity or creatinine in the CCEH cohort, comparison of measured and imputed creatinine concentrations
Metabolite Measured creatinine Imputed creatinine
MEP 0.57 0.68
MnBP 0.53 0.59
MiBP 0.52 0.59
MCPP 0.52 0.56
MBzP 0.68 0.64