Novel statistical methodology reveals that hip shape is
associated with incident radiographic hip osteoarthritis among
African American women
Hyowon An1, J. S. Marron, PhD1, Todd A. Schwartz, DrPH2, Jordan B. Renner, MD3,4, Felix Liu, MS5, John A. Lynch, PhD5, Nancy E. Lane, MD6, Joanne M. Jordan, MD MPH4, and Amanda E. Nelson, MD MSCR4
Hyowon An: [email protected]; J. S. Marron: [email protected]; Todd A. Schwartz: [email protected]; Jordan B. Renner: [email protected]; Felix Liu: [email protected]; John A. Lynch: [email protected]; Nancy E. Lane: [email protected]; Joanne M. Jordan: [email protected]; Amanda E. Nelson: [email protected]
1Department of Statistics and Operations Research, University of North Carolina, Hanes Hall CB
3260, Chapel Hill, NC, 27599, USA
2Department of Biostatistics, Gillings School of Global Public Health, University of North Carolina,
3106E McGavran-Greenberg Hall CB 7420, Chapel Hill, NC 27599, USA
3Department of Radiology, University of North Carolina, 509 Old Infirmary Bldg CB 7510, Chapel
Hill, NC 27599, USA
4Thurston Arthritis Research Center, University of North Carolina, 3300 Thurston Building CB
7280, Chapel Hill, NC, 27599, USA
5University of California at San Francisco, Mission Hall: Global Health & Clinical Sciences Bldg,
550 16th St, 2nd Floor, San Francisco, CA, 94158-2549, USA
6University of California Davis School of Medicine, 451 Health Sciences Dr, Davis, CA 95616,
USA
Abstract
Introduction—Hip shape is a risk factor for the development of hip osteoarthritis (OA), and current methods to assess hip shape from radiographs are limited; therefore this study explored current and novel methods to assess hip shape.
Corresponding Author: Amanda E. Nelson, MD MSCR, Thurston Arthritis Research Center, University of North Carolina at Chapel Hill, 3300 Doc J. Thurston Building, CB#7280, Chapel Hill, NC 27599-7280, Phone (919)966-0553; fax (919)966-1739,
Publisher's Disclaimer: This is a PDF file of an unedited manuscript that has been accepted for publication. As a service to our customers we are providing this early version of the manuscript. The manuscript will undergo copyediting, typesetting, and review of the resulting proof before it is published in its final citable form. Please note that during the production process errors may be discovered which could affect the content, and all legal disclaimers that apply to the journal pertain.
Authors’ contributions
Study design and conception: HA, JSA, TAS, AEN; Data analysis: HA, JSA, FL, JAL, AEN; Data acquisition: JBR, JMJ, AEN; Drafting the manuscript: HA, AEN; Editing for intellectual content and approval of the final manuscript: HA, JSA, TAS, JBR, FL, JAL, NEL, JMJ, and AEN.
HHS Public Access
Author manuscript
Osteoarthritis Cartilage. Author manuscript; available in PMC 2017 April 01.
Published in final edited form as:
Osteoarthritis Cartilage. 2016 April ; 24(4): 640–646. doi:10.1016/j.joca.2015.11.013.
Author Manuscript
Author Manuscript
Author Manuscript
Methods—Data from a prior case-control study nested in the Johnston County OA Project were used, including 382 hips (from 342 individuals). Hips were classified by radiographic hip OA (RHOA) status as RHOA cases (baseline Kellgren Lawrence grade [KLG] 0 or 1, follow-up [mean 6 years] KLG ≥ 2) or controls (KLG=0 or 1 at both baseline and follow-up). Proximal femur shape was assessed using a 60-point model as previously described. The current analysis explored commonly used principal component analysis (PCA), as well as novel statistical methodologies suited to high dimension low sample size settings (Distance Weighted Discrimination [DWD] and Distance Projection Permutation [DiProPerm] hypothesis testing) to assess differences between cases and controls.
Results—Using these novel methodologies, we were able to better characterize morphologic differences by sex and race. In particular, the proximal femurs of African American women demonstrated significantly different shapes between cases and controls, implying an important role for sex and race in the development of RHOA. Notably, discrimination was improved with the use of DWD and DiProPerm compared to PCA.
Conclusions—DWD with DiProPerm significance testing provides improved discrimination of variation in hip morphology between groups, and enables subgroup analyses even under small sample sizes.
Keywords
Hip osteoarthritis; principal component analysis; linear discriminant analysis; racial differences; hip morphology
Introduction
Hip OA is a growing public health problem, and led to the majority of the more than 450,000 hip replacements in the United States in 2012 with total aggregate charges of more than 25 billion U.S. dollars1. Although sex differences are less marked for hip OA than for OA at other sites2–4, women compared with men, and African Americans compared with whites, were more likely to have hip symptoms (women 39.5% vs. men 31.8%; African American 37.1% vs. white 36.0%), radiographic hip OA (women 29.5% vs. men 25.4%; African American 32.1% vs. white 26.6%), and symptomatic hip OA (women 11.1% vs. men 8.3%; African American 12.0% vs. white 9.2%) in the Johnston County Osteoarthritis Project5; African American women had the highest weighted prevalence of symptomatic hip OA among the four race by sex subgroups, at 12.2%.
Bone morphology has recently garnered interest as a risk factor for the development of osteoarthritis (OA). Joint shape is of particular interest in relation to hip OA, given known OA risk factors such as dysplasia and femoroacetabular impingement as well as
developmental factors which impact anatomy specifically at this joint. Our group and others have reported on associations between baseline hip shape (analyzed using modes generated from principal components analysis [PCA]) and incident radiographic hip OA (RHOA), symptomatic RHOA, clinical hip OA, and total hip replacement6–10. Specifically, in our prior analysis10, we found several modes of shape variation that differed by race and sex, 2 modes that were associated with incident RHOA among men only (none in women), and 3
Author Manuscript
Author Manuscript
Author Manuscript
modes that were associated with incident symptomatic RHOA10. Smaller subgroup analyses were limited due to small sample sizes.
To date, such analyses have relied upon principal component-based methods, which are limited in their ability to optimally discriminate between shape variants, particularly when the dimensionality of the model is much greater than the number of available hips for study. For example, in our prior paper, we described a 60-point (120-dimension) model of
proximal femur shape in 382 hips, but we were prevented from exploring subgroups such as African American women or men due to small numbers in our sample (n=49 and 16, respectively). Therefore, in this paper, we sought to optimize discriminant ability between hip shape variants by utilizing novel statistical methodology based in machine learning and designed for such high dimensionality low sample size (HDLSS) settings, which allows simultaneous consideration of the entire hip shape rather than separate discrete components (i.e. individual mode scores). We describe analyses using 4 categories by sex and race, and compare case hips that developed incident RHOA to control hips that did not using these recently developed statistical methods, allowing improved discrimination and more conclusive results.
Methods
The data were from a case-control study nested in the Johnston County Osteoarthritis Project, including 382 hips from 342 individuals as previously described10. In brief, participants had standardized supine anteroposterior pelvis radiographs at baseline and at follow up (mean of 6 years later). These radiographs were read paired and blinded to clinical status and chronological order by a single musculoskeletal radiologist. At baseline, all hips had a Kellgren Lawrence grade (KLG) of 0 or 1. Case hips (n=190) developed RHOA, defined as KLG ≥ 2 at follow-up, while control hips (n=192) remained KLG 0 or 1 at follow-up. For all hips, the shape of the proximal femur was defined on baseline pelvis radiographs using a 60-point model with high reliability as previously detailed9,10; left hip radiographs were mirrored to mimic right hips such that all hips could be included in a single shape model.
This paper employs three cutting edge statistical methods applicable to high dimensional low sample size contexts and with minimal assumptions: Object Oriented Data Analysis11, which advocates treating each shape as a data object (essentially one data point) and improves statistical power; Distance Projection Permutation (DiProPerm)12 hypothesis testing, which is a nonparametric permutation based test which preserves that improved power; and the Distance Weighted Discrimination (DWD)13 machine learning algorithm which identifies a separating direction between classes.
For the current analysis, in order to fully exploit advantages of these multivariate analysis techniques, we first transformed the 2-dimensional curves into a 120-dimensional vector for each hip by combining x- and y- coordinate (pixel coordinates normalized for size) values of each curve into one vector. After statistical analysis was performed on these
120-dimensional vectors, each vector was transformed back into x- and y- coordinates to allow plotting of femur shape through 2-dimensional curves. Investigation of the association of
Author Manuscript
Author Manuscript
Author Manuscript
femur shape with various characteristics was based on hypothesis testing for the difference between two distributions (e.g., cases and controls) with a significance level set at 0.05. Analyses of association followed four steps (see methodology supplement for details) in a manner that allowed comparison of the traditional PCA approach with the novel DWD and DiProPerm approach. First, scatterplots were assessed for visual differences using the first four PCA directions and the DWD direction13. Next, a series of naïve 2-sample Student’s t-tests were performed on each set of PCA projection scores with Bonferroni correction for multiple (n=4) comparisons to determine the statistical significance of each. Then, the potentially significant difference between the two distributions in the DWD direction was investigated using the DiProPerm test12. Finally, the femur shape variation was plotted to give anatomical insights into the direction and type of variation between the cases and controls. Receiver operating characteristic (ROC) curves were employed to compare directly the discriminative ability of these two methods. Sensitivity analyses were employed to investigate adjustment for covariates (age, BMI, and KLG) and for non-independent observations.
Results
The analysis included 382 hips from 342 individuals (39% men, 18% African Americans, mean age 62 years, mean baseline body mass index 29 kg/m2), with 190 case and 192 control hips. Of the 382 hips, 185 were from white women, 132 from white men, 49 from African American women, and 16 from African American men (Table).
Figure 1 demonstrates the shape distributions of case and control proximal femurs by 4 sex and race subgroups, showing potential differences in the mean femur shape among cases and controls, particularly for African Americans.
Therefore, we were interested in further exploring potential differences between cases and controls for hip shape among African American women, a small subset of the overall sample (49/382). First, following standard methodology, the scatter plots generated by the
projection of the 1st 4 principal components (PCs; together explaining 76% of the total variance) are shown in Supplemental Figure A. A 2-sample t-test was applied to each of the 4 principal directions with a Bonferroni correction such that each p-value of the standard t-test was multiplied by 4, the number of t-tested variables (of note, p-values >1 are censored at 1). As can be seen from Supplemental Figure A, the corrected p-value for the t-test on the 3rd PC was 0.052, which is nearly statistically significant.
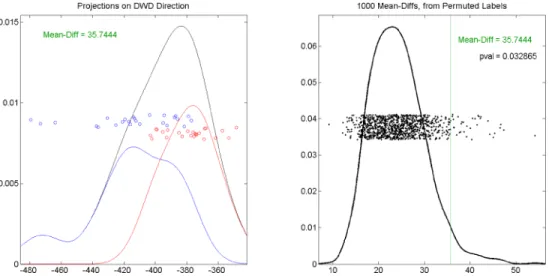
To compare this to our novel methodology, the scatter plots of the projections in the DWD direction and the orthogonal principal directions are shown in Supplemental Figure B. As expected, the projections on the DWD direction showed a more evident distinction between the incident RHOA cases and controls than any individual PC in Supplemental Figure A. The potentially statistically significant difference between the distributions of the incident RHOA cases and controls among African American women was confirmed using the DiProPerm test, which quantified the inferential uncertainty with a p-value of 0.03, as shown in Figure 2.
Author Manuscript
Author Manuscript
Author Manuscript
The left panel of Figure 2 (replicated from the upper left element in Supplemental Figure B) displays the visual difference between the two distributions, which is confirmed by the p value=0.033 in the right panel. No such difference was seen for white men or women, or for African American men (though the latter likely due to very small sample size, n=16, data not shown). Sensitivity analyses adjusting for age, BMI, and baseline KLG produced similar results although the p-value increased slightly to 0.048. Additionally removing the issue of non-independent observations by randomly excluding one hip from each of 40 participants with 2 hips in the dataset resulted in a p-value of 0.036.
Figure 3 shows the ROC curves of the DWD direction (a) and the first 4 PC directions (b–e), demonstrating that the DWD direction (AUC=0.88) better discriminated between the incident RHOA cases and the controls as compared to the PC directions (all AUC ≤ 0.69).
Figure 4(a) displays the variation of all the femora of African American females on the DWD direction.
The projection of the lesser trochanter on X-ray and the femoral head appear somewhat smaller relative to femoral shaft width among cases compared with controls, while the greater trochanter appears larger among controls compared with cases. The femoral head also appears to be somewhat flattened for cases compared with controls. Figure 4(b) confirms this variation using the 3rd principal direction, which showed the most distinction between the cases and controls (Supplemental Figure A). The direction and amount of variation in panel (b) appear somewhat similar to those in panel (a). We note that the similarity of the DWD direction and one of the PC directions is purely coincidental, as the DWD direction is different from any PC direction. The DWD approach finds the direction which maximally separates two groups of data, while the PCA approach determines the direction which maximizes the dispersion of the pooled data.
We have previously reported differences in proximal femur shape by sex10 using PCA. We confirmed this difference using this novel methodology. Compared with the PCA results, the DiProPerm test indicated a very strongly significant difference in overall hip shape between females and males among incident RHOA cases (p<0.0001, Figure 5).
ROC analyses confirmed this finding; AUC for DWD (AUC=0.89 in a) exceeded that for each of the PCs (all AUC ≤ 0.76 in b–e, Supplemental Figure C). Similar, although less marked, sex differences were seen among control femurs (data not shown).
We explored differences by race in a similar manner. Using traditional PCA, there was no evident separation between African American and White femurs among incident RHOA cases; t-test results were not statistically significant (Supplemental Figure D). However, in the DWD direction, there was an obvious visual separation (Supplemental Figures E and F) as well as a statistically significant result from the DiProPerm test (p=0.004, right panel of Supplemental Figure F). Although not as marked as the difference between sexes, this finding is supportive of a distinction in femur shape between African Americans and whites among incident RHOA cases. Similar results were observed for differences by race among the larger group of control hips (DiProPerm test p=0.006, Supplemental figure G). ROC
Author Manuscript
Author Manuscript
Author Manuscript
analyses (Supplemental Figure H), demonstrate the superiority of DWD (AUC=0.81 in a) over PCA (all AUC ≤ 0.61 in b-e) for between group (by race) discrimination among cases.
Discussion
Through application of recently developed statistical methodologies suited for the HDLSS setting, we were able to establish a clear and novel association between hip shape and incident RHOA among the small subgroup of African American women from our prior study. Of note, the difference demonstrated using DWD was larger than the difference seen using PCA, and no correction for multiple comparisons was required. The superiority of the DWD direction to the PC directions for discrimination between cases and controls among African American women was confirmed using ROC curves and calculating the areas under the curve (AUC) for each method as detailed in Results. In addition, we confirmed and clarified previously suggested differences in hip shape by sex and by race. DWD and DiProPerm provide a straightforward and efficient method to address complex shape data in small sample size settings, avoiding problematic issues of multiple comparisons and loss of information (namely, by including additional PCs which account for smaller proportions of the variance), and are thus superior to traditional and often used PC-based analyses.
Prior work in the Johnston County OA Project showed that African American women had a high frequency of RHOA (31.2%) compared with white men and women (23.8% and 29.1%, respectively), although slightly lower than African American men (33.2%5). We have also previously reported on variations in radiographic features, such that African American compared with white women were more likely to have, and have more severe, superior joint space narrowing, and to have subchondral cysts and osteophytes14. In the current analysis, among 4 groups of participants categorized based on sex and race, African American females showed the most significant difference in baseline proximal femur shape, when all KL grades were 0 or 1, between those who later developed incident RHOA cases and those who did not (p=0.033). This novel finding was made possible through the use of the DWD method, as it avoids multiple comparison issues by managing the overall shape distribution as a single data object. This result, along with the prior data supporting a high burden of hip OA in this population as well as potential morphologic differences, implies that the baseline proximal femur shape of African American females has a strong association with the development of incident RHOA, a relationship that was not seen for other subgroups in this analysis (African American men, White men, or White women). Therefore, hip shape may be of particular importance for the development of RHOA in this high risk subgroup, which may allow targeted screening, intervention, and study recruitment.
Additionally, although we have previously demonstrated differences in proximal femur shape by sex and race10, these novel methods allowed us to show that sex differences were more marked among cases compared with controls, while racial variations were similar in those two groups. Therefore, sex may be a more important contributor than race to the risk of incident hip OA related to hip shape, which is of interest given the higher prevalence5 and incidence15 of hip OA among women compared with men regardless of race.
Author Manuscript
Author Manuscript
Author Manuscript
The current analyses have some limitations, as they use data from a single population and the shape data are not necessarily generalizable to other populations; however, the methodology can be easily translated to other settings, and may be extended to
3-dimensional shape studies as well as other HDLSS, non-shape settings. The 60-point model used is of the proximal femur only and does not include potential shape variation in the acetabulum or other adjacent structures. Even using standardized radiographic procedure, there is a possibility of variation based on positioning error alone.
The strengths of our approach include the ability to analyze HDLSS data, where our sample of interest is much smaller than the dimensionality of the data. Statistical shape modeling, even on a 2-dimensional radiograph, provides a large amount of data that must be simplified to be made amenable to traditional analytic methods. For example, these 120-dimensional vectors can be reduced using PCA to a more manageable number of mode scores as previously reported10. However, since shape signals are high dimensional and may have important (though possibly subtle) aspects at the higher end of the PC spectrum, this data simplification results in a loss of information. By introducing DWD and DiProPerm in this setting, where the overall shape distribution is analyzed as a whole, we are able to utilize the full complexity of the data without issues of multiple comparisons. This method also permits analyses of small subgroups that are not possible with the usual PCA-based assessments. Because of these analytic characteristics, we were able to identify novel associations in the same dataset on which we had previously reported, providing additional insights into the role of hip shape in the development of hip OA. We explored this using only the first 4 PCs (greatest amount of variation explained) and DWD and found that more significant
differences were seen when using all of the data (DWD) versus a subset of PCs (data not shown).
Currently, most statistical shape modeling is relatively time-intensive, requiring substantial input from the assessor to place landmark points and manually adjust automatically generated shapes. As the field moves toward more automated methods16, it will be possible to generate shape data on larger populations. Even in this setting, these methods provide a much more efficient use of the data and will be preferable to conventional methods. Additionally, there will likely be small subgroups representing specific OA phenotypes that are of particular interest, such as atrophic hip OA, or multiple joint OA, again leading to HDLSS issues that can be addressed with the methods presented in this paper.
Conclusions
We utilized recently developed statistical methodology and machine learning technologies optimized to the HDLSS setting to uncover a novel association between baseline hip shape and the development of RHOA specifically in the subgroup of African American women. This method appears to overcome some of the limitations of PCA in 2-dimensional
statistical shape analysis of bone morphology as a risk factor for OA. Such methods may be applicable to other clinical diseases or phenotypes as it may provide better discrimination for small subgroups and rare phenotypes of interest.
Author Manuscript
Author Manuscript
Author Manuscript
Supplementary Material
Refer to Web version on PubMed Central for supplementary material.
Acknowledgments
We would like to thank the staff and participants in the Johnston County Osteoarthritis Project, without whom this work would not be possible.
Funding was provided in part by: NIAMS K23 AR061406 (Nelson); NIH/NIAMS P60AR30701 (Jordan); CDC/ ASPH S043 and S3486 (Jordan); K24-AR04884, P50-AR063043, and P50-AR060752 (Lane).
References
1. AHRQ. Heathcare Cost and Utilization Project (HCUP). 2013:HCUP provides access to health statistics and information on hospital inpatient and emergency department utilization.
2. Tepper S, Hochberg MC. Factors associated with hip osteoarthritis: data from the First National Health and Nutrition Examination Survey (NHANES-I). Am J Epidemiol. 1993; 137:1081–1088. [PubMed: 8317437]
3. Kim C, Linsenmeyer KD, Vlad S, Guermazi A, Clancy MM, Niu J, et al. Prevalence of Radiographic and Symptomatic Hip Osteoarthritis in an urban US Community: the Framingham Osteoarthritis Study. Arthritis Rheumatol. 2014
4. Lawrence RC, Felson DT, Helmick CG, Arnold LM, Choi H, Deyo RA, et al. Estimates of the prevalence of arthritis and other rheumatic conditions in the United States. Part II. Arthritis Rheum. 2008; 58:26–35. [PubMed: 18163497]
5. Jordan JM, Helmick CG, Renner JB, Luta G, Dragomir AD, Woodard J, et al. Prevalence of hip symptoms and radiographic and symptomatic hip osteoarthritis in African Americans and
Caucasians: the Johnston County Osteoarthritis Project. J Rheumatol. 2009; 36:809–815. [PubMed: 19286855]
6. Agricola R, Reijman M, Bierma-Zeinstra SM, Verhaar JA, Weinans H, Waarsing JH. Total hip replacement but not clinical osteoarthritis can be predicted by the shape of the hip: a prospective cohort study (CHECK). Osteoarthritis Cartilage. 2013; 21:559–564. [PubMed: 23333469] 7. Barr RJ, Gregory JS, Reid DM, Aspden RM, Yoshida K, Hosie G, et al. Predicting OA progression
to total hip replacement: can we do better than risk factors alone using active shape modelling as an imaging biomarker? Rheumatology (Oxford). 2012; 51:562–570. [PubMed: 22139532]
8. Gregory JS, Waarsing JH, Day J, Pols HA, Reijman M, Weinans H, et al. Early identification of radiographic osteoarthritis of the hip using an active shape model to quantify changes in bone morphometric features: can hip shape tell us anything about the progression of osteoarthritis? Arthritis Rheum. 2007; 56:3634–3643. [PubMed: 17968890]
9. Lynch JA, Parimi N, Chaganti RK, Nevitt MC, Lane NE. The association of proximal femoral shape and incident radiographic hip OA in elderly women. Osteoarthritis Cartilage. 2009; 17:1313–1318. [PubMed: 19427402]
10. Nelson AE, Liu F, Lynch JA, Renner JB, Schwartz TA, Lane NE, et al. Association of incident symptomatic hip osteoarthritis with differences in hip shape by active shape modeling: the Johnston County Osteoarthritis Project. Arthritis Care Res (Hoboken). 2014; 66:74–81. [PubMed: 23926053]
11. Marron JS, Alonso AM. Overview of object oriented data analysis. Biom J. 2014
12. Wei S, Lee C, Wichers L, Li G, Marron JS. Direction-projection-permutation for high dimensional hypothesis tests. arXiv. 2013
13. Marron JS, Todd MJ, Ahn J. Distance-weighted discrimination. Journal of the American Statistical Association. 2007; 102:1267–1271.
14. Nelson AE, Braga L, Renner JB, Atashili J, Woodard J, Hochberg MC, et al. Characterization of individual radiographic features of hip osteoarthritis in African American and White women and
Author Manuscript
Author Manuscript
Author Manuscript
men: the Johnston County Osteoarthritis Project. Arthritis Care Res (Hoboken). 2010; 62:190–197. [PubMed: 20191517]
15. Srikanth VK, Fryer JL, Zhai G, Winzenberg TM, Hosmer D, Jones G. A meta-analysis of sex differences prevalence, incidence and severity of osteoarthritis. Osteoarthritis Cartilage. 2005; 13:769–781. [PubMed: 15978850]
16. Lindner C, Thiagarajah S, Wilkinson JM, Wallis GA, Cootes TF. Development of a fully automatic shape model matching (FASMM) system to derive statistical shape models from radiographs: application to the accurate capture and global representation of proximal femur shape. Osteoarthritis Cartilage. 2013; 21:1537–1544. [PubMed: 23954703]
Author Manuscript
Author Manuscript
Author Manuscript
Figure 1.
Mean femur curves of participants by sex and by race. Red curves correspond to the mean shape for incident RHOA cases and blue curves correspond to the mean shape for incident RHOA controls.
Author Manuscript
Author Manuscript
Author Manuscript
Figure 2. DiProPerm test results on African American females for the difference between incident RHOA cases and controls
The black, red and blue curves show the smoothed histograms of the entire set of African American females, incident RHOA cases, and controls, respectively. The black dots in the right panel represent the simulated mean difference (MD) statistics. The black curve shown is the smoothed histogram of the MD values, so the area under the curve equals 1. The green vertical line shown on the right side of the black curve represents the observed between-group MD value, while the p-value is the proportion of simulated MD values exceeding the observed value.
Author Manuscript
Author Manuscript
Author Manuscript
Figure 3. ROC curves for the DWD direction and the PC directions among African American women. (a) shows the ROC curve of the discrimination rule based on the projections on the DWD direction. (b), (c), (d) and (e) show the ROC curves of the discrimination rule based on the projections on the 1st, 2nd, 3rd and 4th PC directions, respectively
The AUC is reported on the right side of each figure.
Author Manuscript
Author Manuscript
Author Manuscript
Figure 4. Proximal femur shape variation between the incident RHOA cases and controls. (a) shows femur shape variation on the DWD direction (p=0.03); (b) shows femur shape variation on the 3rd principal direction (p=0.052)
The mean shape is shown in green, incident RHOA cases in red, and incident RHOA controls in blue.
Author Manuscript
Author Manuscript
Author Manuscript
Figure 5.
DiProPerm test result for the difference between the males (red) and females (blue) among incident RHOA cases.
Author Manuscript
Author Manuscript
Author Manuscript
Author Manuscript
Author Manuscript
Author Manuscript
Author Manuscript
Table
Baseline characteristics of included hips (n=382), by case control status for incident rHOA, race and gender, respectively
10 Baseline characteristic Case n=190 Control n=192 African American n=65 White n=317 Men n=148 Women n=234 Men , n(%) 74 (38.9) 74 (38.5) 16 (24.6) 132 (41.6) – – AA , n(%) 32 (16.8) 33 (17.2) – – 16 (10.8) 49 (20.9) KLG=0 , n(%) 22 (11.6) 47 (24.4) 7 (10.8) 62 (19.6) 35 (23.6) 34 (14.5) Age
, mean (SD) years
63.0 (9.2) 60.4 (8.6) 62.6 (9.6) 61.5 (8.8) 59.5 (8.7) 63.1 (8.9) BMI
, mean (SD) kg/m