Small Particle Transport in Fibrin Gels
and
High Throughput Clot Characterization
by
Richard Chasen Spero
A dissertation submitted to the faculty of the University of North Carolina at Chapel Hill in partial fulfillment of the requirements for the degree of Doctor of Philosophy in the Department of Physics and Astronomy.
Chapel Hill 2010
Approved by:
Richard Superfine, Advisor
Michael R. Falvo, Reader
M. Gregory Forest, Reader
Leandra Vicci, Reader
c
○ 2010
Richard Chasen Spero ALL RIGHTS RESERVED
This dissertation is dedicated to my father
without whom I certainly would
not have pursued this degree,
for better or worse.
ABSTRACT
RICHARD CHASEN SPERO: Small Particle Transport in Fibrin Gels and
High Throughput Clot Characterization. (Under the direction of Richard Superfine.)
The formation, function, and lysis of blood clots is largely governed by the
trans-port of nano- and micro-scale particles. Yet there is not fully established physics that
relates clot structure to transport phenomena such as fluid permeation and particle
diffusion. This dissertation explores small particle transport in fibrin. I report on
the size-dependence of particle mobility in fibrin, and discuss the implications of these
results for fibrinolytic drug design. I measure the relationship between fibrin
permeabil-ity and diffusion of 0.2–2.8 micron particles in fibrin gels, then determine the time and
length scales at which small particle diffusion is directly related to bulk gel
permeabil-ity. This result implies that one could develop a high throughput clot characterization
assay that provides more detail than turbidity, the predominant high throughput
mea-surement. I also present my work designing and developing systems to perform these
and other experiments in high throughput, which include novel technologies for optical
microscopy and magnetic force application.
ACKNOWLEDGMENTS
Graduate work is professional training, so my thanks are due first to the trainers. In particular, Rich Superfine, Leandra Vicci, and Russ Taylor have packed the last five years with endless lessons—intentional and accidental, direct and indirect—in the proper conduct and professional execution of science, engineering, and management. I have learned a broader swath of these arts over these years than I can imagine having equaled by any other endeavor, and for that privilege I am most grateful.
Graduate study is work, and other hands’ fingerprints cover too much in this dis-sertation to thank them all here; I have noted their contributions throughout the text. But I must thank especially the relentlessly productive David Bober and the endlessly resilient Rachel Sircar, both of whom were always paddling whether or not I had my senses at the till. There is also NSRG’s Matlab master, the goop king Jeremy Cribb, whose handiwork was never far below the surface of mine, and on whose shoulders I have spent much of my time attempting to perch.
Contents
1 Introduction 1
1.1 Coagulation and Transport . . . 3
1.1.1 Studying clot transport. . . 5
1.2 Scope of this Research . . . 8
2 Transport in Fibrin: Theory 11 2.1 Expectations for particle motion in fibrin . . . 12
2.1.1 Single Particle Diffusion . . . 12
2.1.2 Assumptions for fibrin modeling . . . 15
2.1.3 Steric diffusion suppression. . . 18
2.1.4 Hydrodynamic diffusion suppression. . . 21
2.1.5 Expectations for data. . . 23
2.2 Fibrin Structure and Particle Diffusion . . . 25
2.2.1 Ogston Model: diffusion with steric hinderance . . . 25
2.2.2 Phillips Model: a numerical solution . . . 27
2.3 Fibrin Structure and Hydraulic Permeability . . . 29
2.3.1 Darcy Theory . . . 29
2.3.2 Carman-Kozeny relation . . . 30
2.3.3 Fibrous media: Jackson-James and Davies equations . . . 32
2.3.4 Permeability and turbidity . . . 34
2.4 Diffusion and Permeability . . . 38
2.4.1 Effective medium theory . . . 40
2.5 Conclusion . . . 41
3 Transport in Fibrin: Experiments 43 3.1 Measuring nanoparticle diffusion . . . 44
3.1.1 Diffusion in fibrin is size-dependent and bimodal . . . 46
3.1.2 Sensitivity to clot structure . . . 49
3.1.3 Long-time diffusion . . . 52
3.2 Clot permeability . . . 53
3.2.1 Applicability of effective medium theory . . . 55
3.2.2 Measuring permeability with effective medium theory . . . 56
3.3 Discussion . . . 59
3.3.1 Diffusion and permeability as a measurement of clot structure . 59 3.3.2 Diffusion as a guide for drug design . . . 63
4 The Bead’s-eye View 65 4.1 Stuck particles . . . 65
4.2 Fibrin elasticity . . . 70
4.3 Future Directions . . . 74
4.4 Conclusions . . . 74
5 Toward High Throughput 76 5.1 Panoptes: High Throughput Video Acquisition . . . 79
5.1.1 Image quality: NA andz-focus . . . 80
5.1.2 Imaging modes: brightfield and fluorescence . . . 82
5.1.3 Image quality and particle tracking signal-to-noise . . . 87
5.2 Transitioning to High Throughput Protocols . . . 90
5.2.1 Data pathologies in fibrin diffusion measurements . . . 91
5.2.2 DataBrowser . . . 94
5.3 MHTS: High Throughput Manipulation . . . 97
5.3.1 MHTS Design . . . 98
5.3.2 MHTS Calibration . . . 103
5.3.3 MHTS Application: Cell Mechanics . . . 105
5.3.4 MHTS Application: Mucus Viscometry . . . 108
5.4 Governing Equations for MHTS Operation . . . 109
5.4.1 Calibration planning . . . 109
5.4.2 Planning strain stiffening measurements . . . 116
5.4.3 Planning shear thinning measurements . . . 118
5.5 High Throughput Data Collection . . . 119
5.6 Conclusions . . . 119
A Experimental Protocols for Diffusion, Structure, and Permeability 122 A.1 Clot preparation and Video Acquisition . . . 122
A.2 Automatic particle tracking and data filtering . . . 123
A.3 Calculation of diffusion coefficient . . . 123
A.4 PEG Particle Preparation . . . 124
A.5 Structure and Permeability. . . 124
B Panoptes Bill of Materials 125
C Panoptes Parts Schematics 126
List of Figures
2.1 Defining typical clot phenotypes . . . 15
2.2 Confocal microscopy of clot types studied . . . 16
2.3 Understanding steric diffusion suppression . . . 19
2.4 Understanding Hydrodynamic diffusion suppression . . . 22
2.5 Expectations for diffusion experiments in fibrin . . . 24
2.6 The Ogston and Phillips models of diffusion suppression . . . 26
2.7 Theories that predict gel permeability from structure . . . 31
2.8 Interpreting turbidity to predict permeability . . . 37
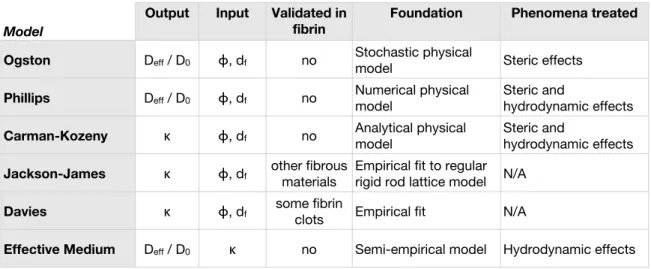
2.9 Summary of theoretical models . . . 42
3.1 Overview of diffusion experiments in fibrin . . . 45
3.2 Data analysis steps for fibrin diffusion data . . . 46
3.3 Bimodality of diffusive behavior: α histograms . . . 47
3.4 Size dependence of particle diffusion in fibrin . . . 47
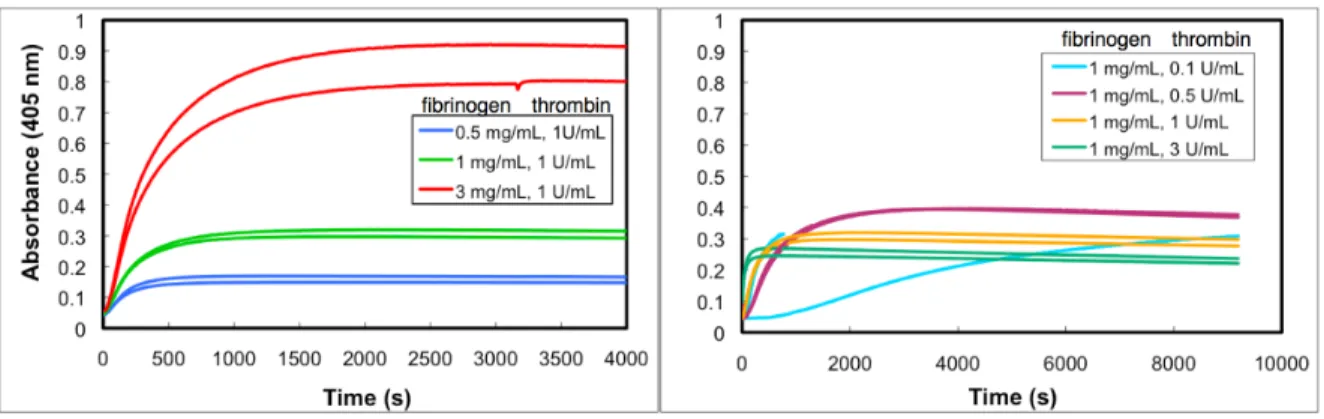
3.5 Turbidity of fibrin . . . 48
3.6 Deff two sizes of particles in various types of clots . . . 50
3.7 Affect of particle presence on gel formation . . . 51
3.8 Long-time diffusion of particles in fibrin. . . 53
3.9 Overview of permeability experiments in fibrin . . . 54
3.10 Fibrin permeability . . . 54
3.11 Verification of the effective medium theory . . . 55
3.12 Scaled cartoon ofhr2i(τ) for comparing diffusion regimes across polymer gels . . . 57
3.13 Measuring fibrin permeability from diffusion . . . 58
3.14 Interpreting gel structure from transport measurements . . . 60
3.15 Cartoon of a large nanoparticle being used as a drug vector. . . 64
4.1 Overview of magnetic force experiments in fibrin . . . 66
4.2 Particle trajectories for magnetic force experiments . . . 67
4.3 Net particle travel: PEG vs. COOH particles . . . 68
4.4 Storage modulus for fibrin: CAP vs. MHTS . . . 72
4.5 Measuring clot formation by microrheology . . . 73
4.6 Future directions: permeability and particle transport flowcell concept . 75
5.1 Panoptes optical path. . . 83
5.2 Imaging contrast results in Panoptes . . . 85
5.3 Samples of cell imaging in Panoptes . . . 88
5.4 Tracking noise measurements in Panoptes . . . 88
5.5 Signal-to-noise results for various experiments in Panoptes . . . 90
5.6 Diffusion experiments workflow . . . 92
5.7 Pathologies in auto-tracking . . . 93
5.8 Databrowser, a data analysis and processing application . . . 95
5.9 Cartoon of a magnetic force system . . . 99
5.10 MHTS magnetics block schematic . . . 100
5.11 Magnetic microplate fabrication . . . 101
5.12 Contour plot of an MHTS force calibration . . . 103
5.13 Pictures of the MHTS prototype . . . 104
5.14 Force crosstalk in the MHTS . . . 104
5.15 Well-to-well uniformity of force calibration in the MHTS . . . 106
5.16 Demonstration of a cell mechanics measurement in the MHTS . . . 107
5.17 Demonstration of mucus viscometry in the MHTS . . . 109
5.18 Summary of a force calibration plan in the MHTS . . . 114
5.19 Summary of a strain stiffening experiment plan in the MHTS. . . 117
5.20 Data workflow for MHTS experiments . . . 120
5.21 Systems overview of the MHTS . . . 121
B.1 Bill of materials for chosen parts. Designs for some components have not been finalized, so their costs are not yet known. . . 125
C.1 . . . 126
C.2 . . . 127
C.3 . . . 128
Chapter
1
Introduction
The formation, function, and lysis of blood clots is largely governed by the
trans-port of nano- and micro-scale particles. A physiological clot’s environment includes
blood, pathogens, cells, and drugs, which move through a fibrin scaffolding by various
mechanisms, including diffusion, advection, and active motility. The nature of clot
formation and lysis is a product of clot structure, fluid permeation, and particle
trans-port. Yet the physics relating these transport phenomena are not well understood. It is
not known, for example, what physical theory governs the diffusion of a small particle
through a clot, nor how that diffusion might be related to the bulk permeability of the
material. This dissertation will address these issues by determining the timescale- and
size-dependence of micro- and nano-particle diffusion in clots.
This work also has a context in soft matter physics. A wide range of scientists and
engineers studying everything from biological tissues to novel materials to gas filters
are concerned simultaneously with fluid permeation and particle transport through a
quan-titatively related. I show that the timescale of the diffusion measurement is critical in
establishing this relationship, and thereby explain why prior work attempting to verify
the effective medium theory showed poor agreement with experiment. Validating the
effective medium theory establishes fibrin as a useful model material for studying
par-ticle diffusion over specific time- and length-scale regimes that are difficult to measure
in other materials.
Like most of biology, coagulation is a phenomenon of many input parameters,
in-cluding fibrinogen and thrombin concentration, calcium concentration, ionic strength,
pH, crowding agent concentrations, and genotype. With the advent of siRNA libraries,
one can imagine triggering clotting over a cell culture substrate, systematically knocking
down each of the more than 21,000 human genes to see whether clot structure above the
substrate is affected. Such an experiment would provide an unprecedented panorama
of the genes involved in thrombin generation. Unfortunately, assays that provide
de-tailed characterization of clots are typically low-throughput and labor-intensive. The
techniques of this dissertation promise to provide high throughput characterization of
clot structure, fluid permeation, and particle transport. I report on high throughput
instrumentation that I have designed and developed to enable my experiments. These
systems include an automated microscope built with components that may be tiled up
to 12 times below a conventional microplate, and a multiforce high throughput system
(MHTS) for force application in biophysical experiments. In this dissertation I report
on the design and qualification of these technologies.
char-acterization. High throughput screening is increasingly critical in cell microscopy, but
existing systems suffer from slow 3D imaging, low-bandwidth in time-lapse experiments,
and incompatibility with force application or other mechanical measurements. The high
throughput technology I present in this dissertation addresses these issues.
1.1
Coagulation and Transport
Fibrin is the polymer scaffolding of a blood clot (Weisel, 2005). Damage to the vascular endothelium1 reveals tissue factor, which triggers a cascade of reactions
culmi-nating in the conversion of prothrombin to thrombin. Thrombin activates fibrinogen, a
340kDa glycoprotein that is always present in healthy blood. An activated fibrinogen
molecule is called a fibrin monomer, which in sufficient concentration self-assembles
into a fibrous gel. Physiologically, fibrin gels nucleate from activated platelets or the
endothelium, ultimately sealing vascular breaches and restoring haemostasis. Clots are
broken down when tissue Plasminogen activator (tPA) converts plasminogen—another
protein endemic to blood—to plasmin, the factor that begins fibrinolysis (fibrin
diges-tion) and therefore limits clot lifetime within the vasculature.
When it functions properly, therefore, clotting is essential to health. Yet because
pathological clotting is the central risk of cardiovascular disease, it is also the top
contributor to the global burden of disease (WHO, 2004), whether through an occlusive thrombus2 triggering myocardial infarction3, or a deep vein thrombus that dislodges
1vascular endothelium: the cells of the blood vessel wall 2thrombus: clot formation within the vasculature 3mycardial infarction: heart attack
and results in pulmonary embolism4. These conditions arise from unwanted clotting;
failure to clot is similarly dangerous, as in hemophilia (Rodriguez-Merchan et al., 2000). One might separate the requirements for clotting—both hemostatic (good) and
pathological (bad)—into the biochemical and the physical. The biochemical
require-ment is simply that to achieve coagulation there must be thrombin to activate
fib-rinogen, and that for lysis there must be plasmin to cleave fibrin. Hemophilia is an
example of a clotting pathology that is biochemical: this genetic disorder results in low
expression of Factors VIII or IX, both of which are involved in thrombin generation.
The physical requirement is that the factors must be at the sample location for
suffi-cient time to allow the reactions to occur. For example, thrombin is created when freely
circulating prothrombin is activated, near cells or platelets, by a complex of factors Va
and Xa. To achieve clotting, therefore, fibrinogen must come to these locations, or
thrombin must move away from them. Not surprisingly, then, the geometry of
throm-bin generation has an impact on gel structure (Wolberg and Campbell, 2008). Similarly, to achieve clot lysis, plasminogen must encounter tPA to become plasmin, and must
then destroy the clot from the outside in, or travel into it; hence, the ability of a clot to
allow transport has an effect on the time required to dismantle it (Veklich et al., 1998). Heart disease has been correlated to tight and rigid clots (Fatah et al., 1996), so clot geometry is intimately tied with the difficulty in treating patients suffering myocardial
infarction due to thrombosis.
The physics of clotting includes kinetic considerations. The faster blood flows,
the less conducive the environment is to clotting. This is demonstrated at formation,
where poor circulation is a risk factor for deep vein thrombosis, and at lysis, where
forced perfusion is a common (and painful) treatment (Wicky, 2009). This treatment is used because increasing gel perfusion accelerates clot destruction (Diamond and Anand, 1993).
The coincidence of clotting agents and the time that they have to interact are
deter-mined by transport of blood and the biochemical factors therein. Transport is therefore
a key issue in clotting pathology and treatment, including transport of coagulation
fac-tors, which must be present only in the locations where clotting is desired, and also
transport of blood itself, which must stay contained, yet circulate freely, within the
vasculature.
1.1.1
Studying clot transport
Clot transport in vivo is the product of five (often simultaneous) phenomena:
dif-fusion, advection, steric hinderance, hydrodynamics, and chemical interaction. All
objects in solution are subject to thermal diffusion, the random motion of particles due
to the non-zero net impulse of many random collisions with solvent molecules. Because
blood is pumped by the heart, objects in clots also experience advection, the transport
of a particle being carried by local solvent flow. The presence of solid barriers, including
the endothelium and the fibrin mesh, hinder objects’ transport by steric interaction,
the physical exclusion of a particle from space filled with other solid matter. These
solid barriers place boundary conditions on the solvent, so objects may experience an
altered hydrodynamic environment. Finally, fibrin is not chemically inert, so objects
stick to the clot scaffolding, suppressing their transport. With enzymes that affect
clot structure—namely thrombin and plasmin—chemical interaction feeds back into
the other transport mechanisms, as formation or destruction of the clot may affect the
conditions that determine diffusion, flow, or collisions.
These are the relevant mechanisms determining transport in clots. However, they
are not always the properties measured in studies of clot formation, function, and lysis.
Today, research of transport in clots typically involves at least one measurement among
permeation, imaging, or turbidity. Permeability is an explicit metric of hemostasis and
of fluid transport through the clot, and it has been correlated with diabetes (Dunn et al., 2005) and heart disease (Fatah et al., 1992; Fatah et al., 1996). Permeability is blind to microscopic details of particle transport, and is a low-throughput technique. Yet the
physiological relevance of the measurement cannot be ignored, so a permeability assay
that could reveal microscopic aspects of clot structure and scale to high throughput
format would be an important contribution to the field. I show in Chapter 3 that at the appropriate time and length scales, nanoparticle diffusion can serve as this assay.
Imaging—primarily confocal and electron microscopy—has been used to measure
clots’ formation and microscopic structure (Blomb¨ack et al., 1994; Blomb¨ack et al., 1989). Microscopy makes no explicit transport measurement, although recent efforts have extracted clot porosity from clot images (Collet et al., 2003; Mickel et al., 2008), which in turn may help predict transport. The more commonly calculated parameters
extract, and imaging techniques have inherent errors in measuring fiber size. This begs
the question of whether a non-imaging measurement could provide implicit structural
information about the gel. Based on theories that I introduce in Chapter 2, I show in Chapter 3that a combination of permeability and diffusion measurements can provide quantitative insight into the structure of fibrous gels.
Turbidity, a measurement of bulk optical transmission, is of particular interest
be-cause it is inexpensive, can be performed in high throughput (Wolberg et al., 2002), and is used as an indirect measurement of fiber diameter and fiber protein density (Carr and Hermans, 1978). Turbidity probes bulk-averaged structure of the clot, so one might imagine that it would be sufficient to predict bulk-averaged resistance to fluid flow
(per-meability). Indeed, experts in the field have developed a rich intuition for interpreting
turbidity curves. However, as I explain in Section 2.3.4, turbidity cannot be used to predict gel permeability.
Of these three methods, none offers direct measurement of particle transport in
clots. Given the relevance of particle transport to clot formation and lysis, such an
assay would be of scientific, and potentially clinical, value. A particle transport assay’s
usefulness would be determined by (1) its sensitivity to relevant clot properties, (2) a
known relationship to the other commonly studied parameters of permeability, imaging,
and turbidity, and (3) instrumentation that is well qualified to be deployed and used
outside of our research group. In this work, I present a diffusion-based clot assay and
address all three of these considerations.
1.2
Scope of this Research
The prior work discussed above has highlighted conditions where diffusion is a key
phenomenon in clot formation and lysis, including the impact of thrombin concentration
gradients on clot structure and the speed of clot lysis on permeant velocity. But the
actual behavior of diffusing particles in clots is not well established, beyond the fact
that particle surface chemistry affects mobility (Valentine et al., 2004) and that fiber stiffness can be measured by diffusion of stuck particles (Jahnel et al., 2008). It has not been established how a particle’s diffusion scales with its size.
More broadly, the work reviewed in Section 1.1 has highlighted the involvement of specific transport phenomena, but it has not explored their governing physics. Without
identifying the relevant theory, predictive models of clot formation, haemostasis, and
lysis will remain elusive. These models would help clarify clot biology, and could
potentially assist in designing drugs, stents, and other biomedical devices.
From a physical perspective, fibrin also provides a model system for understanding
physical properties of highly elastic, low volume fraction, fibrous media. Specifically,
it is unknown whether the bulk properties of fibrin gel relate to micro-scale properties,
including whether the behavior of micron-sized probes carries information about the
bulk viscoelasticity of the gel, about its bulk permeability, or about its structure.
This dissertation addresses these questions. In Chapter 3 I report on experiments with passively diffusing nano-particles. Particle diffusion in fibrin is indeed dependent
hundreds-of-nm regime, using 500 nm particles for many experiments, and ranging in
size from 200 nm to 2.8 µm. The 500 nm particles are half to a tenth the size of
platelets or cells that might perfuse a clot; they are ten to 100 times the size of ambient
proteins or drugs. Comparing directly with these physiological agents is not necessarily
fruitful—platelets, cells, enzymes, and drugs can all interact biochemically with fibrin.
However, chemically inert probes at this length scale are in a physically intriguing
regime: they are small enough to diffuse through the fibrin matrix, but big enough
that they seem likely to collide with it. I show the sensitivity of particle transport to
particle size, and based on these results I propose a drug design to maximize lysis of
occlusive thrombi while minimizing the risk of hemorrhage.
In Chapter 3 I also demonstrate that at short timescales (τ < 1 s), and for small (d ≤ 500 nm), chemically inert particles, diffusion and permeability are intimately
related, and that one can actually predict the other through the effective medium
theory. I explain that therefore hydrodynamic, rather than steric, effects dominate
diffusion at the micro-scale. Larger particles are more likely to become lodged in the
gel, and 1µm particles are found to always be stuck. At longer timescales, I report on
evidence that steric effects may be affecting particle diffusion.
Chapter 3 answers questions about the nature of stuck particles. In Chapter 4
I show that micron-scale particles in fibrin—which do not freely diffusion—are not
strongly adhered to the gel. By applying forces on the order of those found in arterial
flow, micron-scale particles will move long distances (>100 µm), suggesting that such
particles may be useful as drug delivery vectors for fibrinolytic treatments. In addition,
I show that for particles at least 2.8µm and smaller, driven micro-rheology measures a
local mechanical property of the clot, rather than the bulk viscoelastic properties of the
gel, and that it can measure time-dependent stiffening of fibrin during clot formation.
In addition to my scientific work focused on fibrin and other fibrous gels, I have
helped to design, build, and qualify systems for high throughput microscopy,
manipu-lation, and rheology that are designed to address the needs of these and other
experi-ments. They are core technologies for a microrheology and cell screening system that is
presently under development. These systems and my contributions to their realization
Chapter
2
Transport in Fibrin: Theory
When particles move in clots, what phenomena are at play? The physical
environ-ment for diffusing particles, and the fluidic environenviron-ment during permeation, are not
well understood in clots. In this Chapter, I begin with the impact a gel is expected
to have on a diffusing particle and on a permeating fluid. The presence of a gel will
impose boundary conditions on the fluid, as well as on the particle motion. I determine
the relevant length and timescales for these effects.
In the remainder of this Chapter I explore the relationship of gel structure to
trans-port. Imaging has been used to extract gel structure, including fiber density (Campbell et al., 2008), branchpoint density (Ryan et al., 1999), and gel porosity (Mickel et al., 2008). However, this information has not been used to test the quantitative theories that use these structural parameters to predict particle diffusion or fluid permeation.
Therefore, I will spend some pages looking in detail at the theoretical relationships
among structure, permeation, and particle transport. The goal of this Chapter is to
one theory might help validate or invalidate the applicability of others.
2.1
Expectations for particle motion in fibrin
2.1.1
Single Particle Diffusion
In classical physics, diffusion was understood through the lens of Fick’s laws, which
described the phenomenon in terms of concentration gradients (Cussler, 1997). It was Einstein who provided the physical explanation for single particle diffusion (Einstein, 1905), often called Brownian motion. This explanation is captured in the Stokes-Einstein relation, which states that for a sphere of diameter d in a fluid of viscosity
η,
D= kBT
f =
kBT
3πηd, (2.1)
wherekBand T are Boltzmann’s constant and absolute temperature, respectively. Dis
the diffusion coefficient of the material. For aspherical solutes, the denominatorf may
be replaced by the Stokes drag formula (Happel and Brenner, 1983) for that geometry. Einstein noted thatD determines the time-averaged position of the particle
where hr2i is mean squared displacement, and τ is the time between position
mea-surements during which the particle diffuses. Einstein also explained that the D of
Equation 2.1 can explain the bulk diffusion of Fick’s Laws, provided that material is homogeneous and invariant in time.
While for many natural and engineered systems homogeneity and stasis are
ap-propriate assumptions, for biological systems it is rarely apap-propriate to apply either.
First, polymers are typically viscoelastic—namely, under stress they exhibit
frequency-dependent frictional loss and elastic energy storage (Ferry, 1980). Polymer solutions are spatially heterogeneous on certain length scales, and the interaction of polymer chains
with suspended particles depends on the size of the particles, the physical parameters
of the chain (chain length and flexibility), and the nature of the solution (the quality of
the solvent and the concentration of polymer) (Rubinstein and Colby, 2003). Biological materials can be even more heterogeneous; for example, mucus comprises pathogens
and particulates suspended amidst a solution of polydisperse mucins (Thornton et al., 2008). Fibrin is viscoelastic (Roberts et al., 1974); it also exhibits temporal hetero-geneity during clot formation and lysis, and spatial heterohetero-geneity on length scales at
or below the mesh size of the gel.
Measurements of single-particle diffusion, made possible by advances in microscopy
and single-particle tracking, reveal some of these complexities. In homogenous but
viscoelastic materials, it has been observed that diffusion of particles is suppressed on
certain timescales such that
hr2i ∝τα (2.3)
where 0 < α < 1 (Wong et al., 2004). The powerlaw α may not be constant over all timescales. However, for any range of τ over which α = 1, the average motion is
Brownian. (There are instances where the average motion is Brownian but the step
size distribution is non-gaussian (Wang et al., 2009); in this dissertation, I have seen no evidence of such an effect.) In such cases it is useful to generalize Equation 2.2 by takingD→Deff, with the “effective” subscript capturing the concept that the material
appears purely viscous, although no aspect of the particle-polymer-solvent system can
be said truly to have a viscosity corresponding to Deff.
For homogeneous media, variations inαcan be explained as the result of
frequency-dependent elastic storage and viscous losses. Mason and Weitz have explained that the
complex modulusG∗(ω) of a bulk material may therefore be extracted fromr(t) (Mason and Weitz, 1995). This approach has since become a key technique in the larger field of microrheology (Waigh, 2005; Cicuta and Donald, 2007; Kimura, 2009).
Fibrin, however, is not homogeneous on the micron length scale. Therefore, much
of microrheology is not expected to be relevant in this material. To develop a sound
model of transport, we need to be clear about valid assumptions one can make about
2.1.2
Assumptions for fibrin modeling
The coagulation community has a language for describing fibrin gel phenotypes.
Clots are often described as coarse (few thick fibers, low volume fraction) or fine (many
thin fibers, high volume fraction), but the terms are not always clearly defined. I have
summarized the definition of these qualitative terms in Figure 2.1.
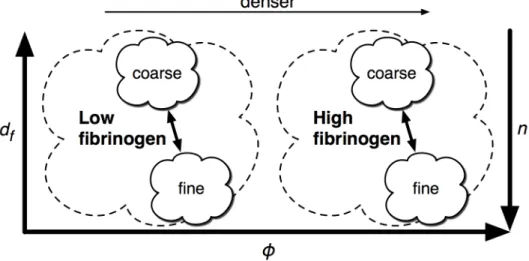
Figure 2.1: Clots at a given fibrinogen concentration have a range of phenotypes, from “fine” to “coarse,” depending on the polymerization conditions. This car-toon defines these terms relative to the physical parameters of fiber diameter (df) and volume fraction (φ), which are useful in quantitatively describing clot
structure. For a clot of fixed fibrinogen concentration, a clot becomes finer when the same fibrin is distributed over more fibers, increasing fiber number density
n but decreasing df. To first order, volume fraction φ should remain the same,
but there are indications that thicker fibers pack fibrinogen more densely than thin fibers (Guthold et al., 2007), meaning volume fraction would also increase as clots become finer. Clot coarseness is typically inversely proportional to poly-merization rate—for example, high thrombin concentration leads to finer clots. Clot density increases with rising fibrinogen concentration.
Platelet-poor plasma (PPP) and purified fibrin clots are fibrous gels. The material is
heterogenous on the nanometer-to-micron length scale, as is clear from the microscopy
of Figure 2.2, which shows representative images of all the clot types studied in the
present work. In the absence of external stress, the fiber segments are straight and can
be considered rigid rods, as recent work has identified the persistence lengthlp of fibrin
fibers in a clot to be ∼10 cm (Jahnel et al., 2008).
1 mg/mL Fibrinogen
1 nM Thrombin 1 mg/mL5 nM 1 mg/mL10 nM 1 mg/mL30 nM
0.5 mg/mL
10 nM 1 mg/mL10 nM 3 mg/mL10 nM
Normal PPP Hemophilic PPP Treated PPP
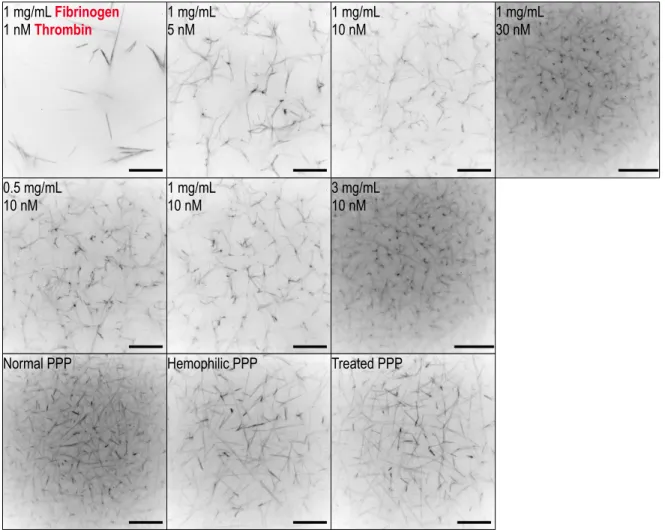
Figure 2.2: Confocal microscopy of the clot types studied in this work. As has been well established in prior work, clot coarseness decreases with thrombin con-centration (first row) and fibrinogen concon-centration (middle row). Platelet-poor plasma (PPP) clot structure also varies with pathology. In this case, hemophilic clots are coarser than normal clots, and rFVII can restore some of the lost density (last row). Scale bar is 20 µm
On the second to week-long timescales, the gel may be considered invariant in
scaffolding. On minute and second timescales, the gel does not move under confocal
microscopy. From day to day, confocal images of the gel do not change in any discernible
way.
In fibrin networks there is little space that actually contains fibrin, a quality
cap-tured in the gel’s volume fraction, φ. For compacted clots, the densest of the
phys-iological gels, φ < 0.25, while for non-compacted clots, including arterial thrombi,
φ < 0.1 (Diamond, 1999). Clots can be coarse, with few thick (∼ 500 nm) fibers
separated by large (∼ 20 µm) distances, or fine, with many thin (∼ 100 nm) fibers
separated by short (∼1 µm) distances. Figure2.2 indicates that the distance between fibers can be∼0.1−10µm.
In spite of this open space, non-specific chemical adhesion of probes to fibrin prevents
long-distance transport of even nanometer-scale probes. Fibrin is notoriously sticky.
It is used as a tissue adhesive (Saxena et al., 2003), and shows non-specific adhesion to everything from pipette tips to nanoparticles with carboxylate surface chemistry.
Polyethylene glycol (PEG) has been used to reduce, but not eliminate, the likelihood
of nanoparticle adhesion to fibrin (Valentine et al., 2004). Particles (including enzymes and drugs) diffusing in a physiological clot typically would interact chemically with
fibrin; free diffusion of chemically active particles could be modeled as an equilibrium
between binding and unbinding events. In addition, enzymes such as thrombin and
plasmin are known alter the gel’s structure. In order to focus on the physical
inter-actions at play in nanoparticle diffusion, this dissertation will focus on the motion of
PEG-coated probes that neither stick to nor alter the gel.
In summary, for a static flow environment we can reasonably model fibrin as a
random array of rigid rods. This allows me to provide some estimate of how a diffusing
particle will interact with the gel.
2.1.3
Steric diffusion suppression
I will begin with steric interactions. These events occur when the diffusing particle
“bumps” into the gel. How often will this occur? More precisely, how long will we have
to watch a diffusing particle before it collides with a fiber?
Consider a diffusing particle and the nearest fiber, shown in Figure 2.3. We can ignore all but the nearest fiber because when the bead does collide with a fiber it will,
by definition, be the closest fiber. If the fiber is a distance R from the particle, then
the time required to travel the distance to the fiber is simply the first passage time in
3-space,
τR= R2
6Deff
, (2.4)
where I have used the generalized diffusion coefficientDeff, because the particle’s
diffu-sion will be determined not by the bulk diffudiffu-sion from Fick’s laws, but by the viscosity
of fluid in which the particle is diffusing. However, we certainly do not expect that
the particle will always diffuse toward the fiber; in fact, it will diffuse randomly to the
edge of a shell with radiusR. After diffusing for a timeτR, the probabilityPRthat the
nearest patch of fiber,
PR=
d2
f
4πR2, (2.5)
wheredf is the fiber diameter. If, after τR, the particle has not hit a fiber, then it will
have another shot during the following τR. The probability that it will hit a fiber after
n attempts is unity minus the probability that it never hits, or
Pn = 1−(1−PR)n = 1−(1−PR)
τ/τR (2.6)
= 1−
1− d
2
f
4πR2
6τ Deff R2
=P(τ), (2.7)
recognizing that the number of attempts n=τ/τ
R.
10−7 10−6 10−5
10−1 100 101 102 103 104 105 106 107 R (m) τ (s)
df = 50 df = 250 df = 500
Figure 2.3: Left: A cartoon of the steric diffusion problem. Right: The startupτ
(plain lines) and stericτ (dot-lines) for clots of three fiber diameters (df = 50, 250,
and 500 nm). The collision probability P was calculated from Equation 2.7 for a 500 nm particle in water, and plotted against the average distance to the fibers
R. The lines truncate at the left because the separation between the particle and the fiber R−(df+d)/2 ≤0. Typically, df ∼ 100–250 nm and R ∼ 0.5–5 µm, though
extreme conditions may place clots out of this range.
Solving for τ gives the time required to see a collision with probability P:
τ(P) = R
2
6Deff
ln(l−P)
ln(1− d
2
f 4πR2)
To estimate the timescale over which a collision will occur, I can solve Equation2.7for
P =1/e and 1−1/e,
τsteric=
−1
ln(1− d2f 4πR2)
R2
6Deff
(2.8)
τstartup = 0.46 τsteric. (2.9)
I will call these cases the “startupτ” and the “stericτ”, because these are the timescales
at which a steric effect will begin to manifest, and when it will consistently contribute,
respectively.
For 500 nm particles, then, the startup and steric τ are plotted in Figure 2.3 as a function of nearest average distance to a fiber R, for several fiber diameters, df.
The plot reveals several key elements of steric diffusion suppression. First, the steric
τ is a very steep function of R, so small changes in clot density are likely to have a
dramatic impact on whether steric diffusion suppression occurs. Second, the transition
region—the difference between the startupτ and stericτ—is not large; it is apparently
less than a decade. Finally, in all but the most dense clots—say, R < 600 nm and
2.1.4
Hydrodynamic diffusion suppression
How far must a particle be from a fiber before it starts to feel diffusion
suppres-sion? Specifically, how does the drag on a particle increase as it approaches the fiber
boundary? The ideal toy problem to address this question would be a solution for the
Stokes drag on a particle near a cylindrical boundary. The case of a particle inside a
cylinder has been addressed (Happel and Brenner, 1983; Lee and Ladd, 2005), but I am not aware of a solution for the rod-sphere case1. However, the bracketing cases of a
particle near a plane and a sphere have been treated; these provide a lower and upper
bound, respectively, on the expected diffusion coefficient for a particle near a cylinder.
The geometry of these cases is summarized in Figure 2.4.
It has been verified experimentally (Kihm et al., 2004; Choi et al., 2007) that a sphere diffusing near a plane shows hindered diffusion, such that
Dwall =λwallD0 =D0
2λ||+λ⊥
3
λ||= 1−
9 16
d
2z +
1 8 d 2z 3 − 45 256 d 2z 4 − 1 16 d 2z 5
λ⊥=
4 3sinhα
∞
X
n=1
n(n+ 1) (2n−1)(2n+ 3)
"
2 sinhβα+βsinh 2α
4 sinh2 β2α−β2sinh2α −1
#!−1
where α= cosh−1 2z
d and β = 2n+ 1. (2.10)
The two-sphere case has been treated for constant-velocity particles (Happel and Bren-ner, 1983), but the friction coefficient found there (Equation 6–3.51) applies equally
1I am indebted to Greg Forest, Peter Mucha, and Roberto Camassa for their help in the literature
review
10−7 10−6 10−5 0 25 50 75 100 R (m) D eff /D 0 (%)
df = 50 df = 250 df = 500
Figure 2.4: Left: Cartoon summarizing the terms used in the two-sphere and sphere-plane solutions for diffusion suppression. Right: Diffusion suppression of a 500 nm particle as a function of distance from a boundary, for three fiber diameters (df = 50, 250, and 500 nm). Plotted are Dwall/D0 from Equation 2.10
(dashed lines) andDsphere/D0 from Equation 2.11 (solid lines). The lines truncate at
the left because the separation between the particle and the boundary (z≤0 for the plane and R−(df+d)/2≤0 for the sphere) goes to zero. Typically, df ∼ 100–
250 nm andR∼ 0.5–5µm, though extreme conditions may place clots out of this range.
well in this case, because of the low Reynolds number assumptions. Setting the velocity
of the second sphere to zero (recognizing that the fiber is static relative to the diffusing
particle) and insertingdf for the diameter of the second sphere, we find,
Dsphere =λsphereD0 =
D0
1 + 169 ddf
R2 +
3 64(3
dd3
f
R4 +
27 4
d2d2
f
R4 −2
d3d
f
R4 )
(2.11)
The relative suppression, Deff/D0, is plotted in Figure2.4. As expected, the
suppres-sion from the particle-plane case is greater than that from the two-particle case; the
particle-cylinder case should be somewhere in between these two cases. The absolute
shows that at larger values ofR—say, above 1µm, little hydrodynamic effect should be
visible. While this plot cannot truly predict the diffusion of particles in fibrin, it does
suggest that some level of hydrodynamic diffusion suppression should be expected in
most clots, for four reasons. First, the actual hydrodynamic effect will be more severe
than the two-sphere case. Second, clots typically have fibers thicker than 50 nm. Third,
even in clots whereRcan be very large—say, 10µm—the particle will spend some time
closer to the fibers, and the diffusion suppresses rapidly as the particle moves closer to
the boundary. Fourth, the hydrodynamic effect—unlike the steric effect—is additive,
meaning that every fiber contributes to the particle’s friction coefficient, not just the
nearest one.
One final comment on the hydrodynamic effect: while the amount of diffusion
sup-pression a particle will experience changes as a function of the particle’s position, it
will manifest, on average, at all τ. This is in contrast to the steric effect, which will
occur only at and above the timescale over which a particle travels from fiber to fiber.
Therefore, on timescales τ < 1 s I expect we will see only hydrodynamic diffusion
suppression.
2.1.5
Expectations for data
Figure2.5 shows what I expect my data to look like, when both the hydrodynamic and steric effects are taken together. The hydrodynamic effect occurs at all timescales,
while the steric effect only manifests above the startup-τ.
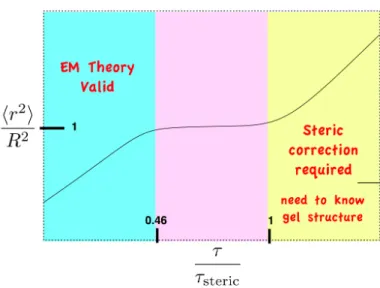
Thehr2iat which the steric effect begins to manifest must also provide some insight
Figure 2.5: Cartoon of a theoretical hr2i. The diffusion coefficient is defined for parts of the curve that have a slope α = 1 (regions I and III). The higher the intercept of the line, the greater the diffusion coefficient. As discussed in Section 2.1, at short timescales (region I) the particle interacts only with the local fluid, but Deff is lower than it would be in free buffer (dotted line) because
of the presence of the gel. After a transition region (region II), steric effects begin to manifest at longer timescales (region III), resulting in a lower Deff than
at short timescales.
into the fiber density. Conceptually, the range of the hr2i at the startup and steric τ
should be related to the distance to the nearest fiber hr2i ∼R2, as noted in Figure2.5.
I have used arguments about the way diffusion is determined by gel structure to
motivate Figure 2.5. Gel structure, however, determines more than just diffusion. It also determines gel permeability. A gel resists fluid flow because of friction between the
fluid and fiber surfaces. These boundary conditions are precisely the ones responsible
the hydrodynamic effect described in Section 2.1.4. Therefore, I hypothesize that if there is a relationship between gel permeability and particle diffusion, that it will exist
only on timescales where the hydrodynamic effect solely determines Deff, below the
2.2
Fibrin Structure and Particle Diffusion
We now have a broad picture of what physical phenomena govern particle diffusion
in clots, and the timescales on which they are relevant. In this section I expand on the
toy problems of Section2.1by highlighting specific models of particle motion in models of fibrous materials.
2.2.1
Ogston Model: diffusion with steric hinderance
Consider fibrin to be a simple porous network, invariant in time, with a rigid
scaf-folding submerged in a background fluid, in which solute particles can move. Ogston
considered solute diffusion in a matrix of randomly oriented rods (Ogston et al., 1973). He presented a stochastic argument, closely following Einstein’s 1905 approach. In
Ogston’s treatment, however, the presence of the rods sometimes prevent the particle
from translating. The result is that the particle moves less:
Deff D0
= exp
−φ d df
=e−φ/λ
, (2.12)
where D0 is the diffusion coefficient of the particle in pure background fluid, φ is the
volume fraction of the gel, anddf is the diameter of the rods that form the matrix. The
predicted quantity, Deff, is the particle’s actual diffusion coefficient, which the theory
indicates will be below D0 due to the presence of the gel; this is shown in Figure 2.6.
Note that moving to coarser clots—increasing df at constant φ—restores the effective
diffusion coefficient closer to D0. This is because if the fibers get thicker while the
volume fraction remains steady, then the number of fibers must be decreasing; this in
turn, corresponds to an increase in the size of the open spaces (captured by the quantity
R in Section 2.1).
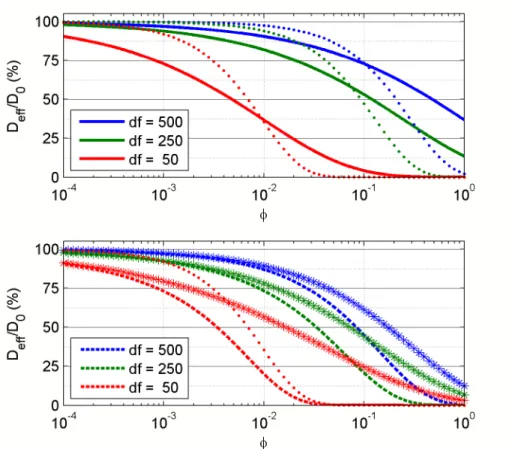
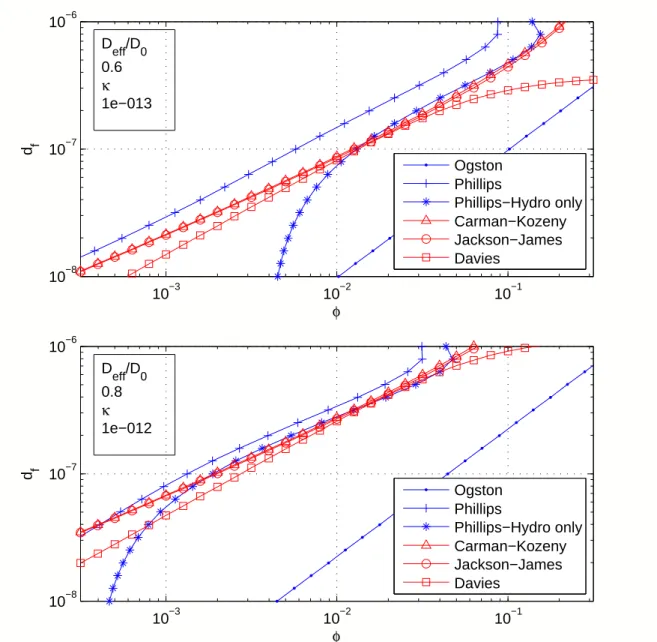
Figure 2.6: Two models of diffusion suppression for a 500 nm particle in a gel of varying fiber diameter (df = 50, 250, and 500 nm) as a function of volume
fraction. The range 0.01 < φ < 0.2, is typical for fibrin gels. Top: The Ogston model (Equation2.12) (solid line), plotted with the steric-only term of the Phillips ModelS(f)(dots). The numerical solution inS(f) does not agree with the Ogston model, but the reason for the disagreement is not well-explained in the litera-ture. Bottom: The Phillips Model (Equation2.13) (dashed line), plotted with its hydrodynamic-only term F (stars). Also plotted is the df = 50 nm case for S(f)
(dots). Comparing S(f) and F shows that at low volume fraction, the diffusion suppression is primarily hydrodynamic, but as the gel becomes more dense, the steric effect comes to dominate the supression.
At the time, Ogston showed that this theory explained experimental data of particle
regularly—recently, see (Johnson et al., 1996; Williams et al., 1998)—but I am not aware of research testing its relevance in fibrin diffusion. The Ogston model accounts
only for steric interactions, and ignores any hydrodynamic effect that the gel might
have on the background fluid. Yet Figure2.5explains that we expect the hydrodynamic effect to be present at all timescales. In Chapter 3 I show that the Ogston Model is not consistent with my data, as expected.
2.2.2
Phillips Model: a numerical solution
More recently, Phillips provided a simple formulation for diffusion suppression that
accounted for both hydrodynamic and steric interactions with the gel (Phillips, 2000). Phillips used his prior work simulating the hydrodynamic effect for particle diffusion in
a liquid-filled, three-dimensional medium of randomly placed cylindrical fibers (Clague and Phillips, 1996), and combined it with the results of a simulation of the steric effect in rigid-strand polymer solutions (Johansson and Lofroth, 1993). The result is the relation
Deff D0
=F S(f)
F =e−aφb, S(f) =e−0.84f1.09
a= 3.727−2.460λ+ 0.822λ2
b= 0.358 + 0.366λ−0.0939λ2 (2.13)
where F is a term that captures hydrodynamic diffusion suppression, S(f) captures
the steric diffusion suppression, f =φ(1 + λ1)2, and λ=df/d.
We can apply this model to fibrin diffusion data whether hydrodynamic or steric
effects are responsible. As with the Ogston Model, the Phillips model has not been
tested against diffusion and structural data from fibrin gels. Because of the inherent
challenges of determining clot structure from microscopy, the validation of this theory
in fibrin is outside the scope of this dissertation. However, in Section3.3.1 I show that the Phillips model can be inverted, along with the Carman-Kozeny and Jackson-James
theories (see Section 2.3), to provide a reasonable prediction of clot structure.
The Phillips model, along with its constituent terms, S(f) and F, is plotted in
Figure 2.6. Except for the limiting cases of φ → 0 and φ → 1, S(f) does not agree with the Ogston model as one might expect; unfortunately, this issue is not explained
in the literature. At low φ, the hydrodynamic term F is the one that dominates the
diffusion suppression; the steric termS(f) matches (then overtakes) the hydrodynamic
suppression at volume fractions of φ = 0.005–0.2, depending on df. Fibrin volume
2.3
Fibrin Structure and Hydraulic Permeability
2.3.1
Darcy Theory
Gels and porous media resist, but do not fully arrest, the flow of fluid. In 1856,
Henry Darcy published a treatise on the public fountains of Dijon, France, which
in-cluded exploration of how a filtration system (sand, in the case of his experimental
design) resisted the flow of fluid (Darcy, 1856). The observations of Darcy’s original experiments can be generalized for permeants of arbitrary viscosity η and for
perme-ation driven by forces other than gravity (Bear, 1988) to state:
˙
Q=κA∆P
ηL , (2.14)
where ˙Q is the volumetric flow rate, A and L are the cross section and length of
the filter, and ∆P is the pressure drop across the filter. The coefficient κ has units
of area and is called the hydraulic conductivity, or Darcy constant; I will use these
terms interchangeably with “permeability”. The permeability of a classical porous
medium is invariant with the other parameters in Equation 2.14. If, for example, ∆P
were increased across a gel, then ˙Q would increase in direct proportion, such that the
calculated κ would not change.
Blomback and Okada were among the first to recognize the potential value of
mea-suring permeability of fibrin (Blomb¨ack and Okada, 1982). Since that time, the cor-relations of clot permeability with disease have established permeability as a critical
measurement, as discussed in Section1.1.
The Darcy equation, though a powerful tool, is wholly phenomenological. In the
century and a half since his observations were published, much effort has been devoted
to predicting κ using information about the material’s structure. Initial work in the
late 19th and early 20th centuries considered a porous medium to be a collection of
capillaries. Intuitively, the volume fraction of the medium could be accounted for by
the effective diameter of the capillaries relative to the cross-section of the medium, and
the tortuosity of the flow through the medium could be accounted for by the effective
length of the capillaries relative to the length of the medium.
2.3.2
Carman-Kozeny relation
The history and usage of the capillary model is described concisely by Carman ( Car-man, 1937), who provided a simple expression for the Darcy constant κ as a function of S, the surface area per unit volume presented to the fluid, and a Kozeny factor k
that captures the structure of the medium. The so-called Carman-Kozeny relation is
κ= (1−φ)
3
kS2 =
d2f(1−φ)3
16kφ2 ; (2.15)
in his work, Carman explained the relationship between S and df. The task, then, is
to predictk. For fibrous gels, a Kozeny factor may be assembled after determining the
1983):
krand =
2k⊥+kk
3 =
1 3
4(1−φ)3
φ(ln1φ− 11+−φφ22)
+ 2(1−φ)
3
φ(2lnφ1 −3 + 4φ−φ2)
!
. (2.16)
Combining Equations 2.15 and 2.16 gives κ as a function of volume fractionφ, shown in Figure 2.7.
10,000 1,000
-
N m , Y , x c 0 - -g 100
E a, a In u) a, C In c -
0 10
._ E n
1
0.1
1
Three-dimensional fiber networksa - A
spielman a ~ o r m equat~on 15
Jackson 8 James equation 16
0.0001 0.001 0.01 0.1 1
Solid Volume Fraction (@)
Figure 4 - A comparison of three-dimensional models for fibrous porous media.
single cylinder problem, they used the Brinkman-Debye- Bueche (BDB) equation:
v p = p i 7 - 14V
k
which is the superposition of Stokes equation and Darcy’s law. The velocity was required to vanish at the cylinder and to match the superficial velocity at infinity. Having avoided Stokes’ paradox because the Darcy term is dominant at large distances, they found the flow field and drag on an infinitely long cylinder. From the drag, the equivalent permeability was determined and this was taken to be the permeability k in the governing equation. Hence an implicit relation was
found for k:
where K,, and Ki are modified Bessel functions of the second
kind. This equation is plotted in Figure 3 and the curve lies
about 25% above the accurate collective curve. This novel approach of Spielman and Goren-now gen-
erally referred to as ‘swarm’ theory-led to a number of
works which attempted to improve the concept. Howells (1974) extended the analysis by including a second fiber at random locations and accounting for its influence. His re-
sults agree with those of Spielman and Goren for
+
5 0.3,and give lower permeabilities at higher +. Neale and
Masliyah (1975) and Guzy et al. (1983) supposed that there is a fluid annulus around the single cylinder, inside of which Stokes’ equation applies and outside of which either Darcy’s equation or the BDB equation applies. This approach is, in effect, a combination of the circular cell model and the
two-zone concept of Spielman and Goren. Matching condi- tions at the edge of the envelope depend on which equation is specified for the outer region, but the resulting two pre-
dictions differ little for 4 < 0. I , as Guzy et al. show. If the
two predictions were plotted in Figure 3, the curves would
fall between the Happel curve and the collective curve (Kuwabara, etc.). The main point is that these refinements
to a model flow do lead to results which are closer to the
accurate solutions, i.e., to those of Hasimoto, Sangani &
Acrivos and Drummond & Tahir.
FLOW THROUGH THREE-DIMENSIONAL ARRAYS
Spielman and Goren used the same technique to estimate
the permeability of rods randomly oriented in all three direc-
tions. They solved the problem of a rod oblique to the
superficial velocity by allowing the permeability to have
different values in the directions parallel and perpendicular to the flow. Then, by averaging over all rod directions, they determined the permeability of this three-dimensional medium. Using the same notation as before, this result is
The only other work on three-dimensional arrays appears
to be our own development of a cubical lattice model (Jack-
son and James, 1982). In that work, it was argued that the permeability of a random medium like steel wool is equiv- alent to the permeability of a cubical lattice formed of the same material. The flow resistance of the lattice was esti- mated by adding the resistance of rods across the flow to that of rods aligned with the flow. The individual resistances were calculated from Happel’s relations and an overall per- meability was predicted. Now that Drummond and Tahir’s more accurate equations are available, we now present a
revised prediction for k/a’, based on their Equations (2) and
( 1 I ) for square arrays:
3
- = - (-In
+
- 0.931 + O(ln + ) - I ) . . . . . . .a* 204
This equation and Spielman & Goren’s result (Equation 15)
have been plotted in Figure 4. It is apparent that the two
models agree reasonably well with each other and with the
experimental data.
Conclusions
The conclusions of this work are best stated with refer- ence to the figures:
(i) Figure 1. The graph shows that permeability data for
diverse fibrous materials are correlated reasonably well
when the co-ordinates k/a2 and 4 are used. The scatter
is caused by inhomogeneity and by variations in fiber shape and arrangement. For example, if the graph could be restricted to media with uniformly distributed fibers, or to media where the fibers had a single orientation, then the scatter would be reduced considerably. Even with the scatter, though, the graph is useful for order of magnitude estimates of flow resistance when flow data are not available for a porous material but when fiber size and volume fraction are known.
(ii) Figure 2. For arrays of parallel fibers aligned with the
flow, predictions by all analytical techniques agree
372 THE CANADIAN JOURNAL OF CHEMICAL ENGINEERING, VOLUME 64, JUNE 1986
Figure 2.7: Left: κ(φ), according to the Carman-Kozeny (solid), Jackson-James (stars) and Davies (dots) relations. The theories are easier to compare by nor-malizing away the fiber diameter. None of these equations has been convincingly demonstrated to predict fibrin permeability. Right: The Jackson-James equa-tions has been validated in other fibrous materials over a wide range of φ. Criti-cally, over the relevant range of φfor clots—say,10−3–10−1—all three theories are essentially within the scatter of the data used by Jackson and James.
This theory has been validated in fibrous gas filters (Fowler and Hertel, 1940) and beds of aligned cylinders (Astrom et al., 1992). It remains in regular use, including in agarose gels (Pluen et al., 1999) and extra-cellular matrix (Pedersen et al., 2007), and collagen (Ramanujan et al., 2008). However, it has not been validated in fibrin;
because of the inherent challenges of determining clot structure from microscopy, the
validation of this theory in fibrin is outside the scope of this dissertation. However, in
Section 3.3.1 I show that the Carman-Kozeny theory can be inverted, along with the Phillips Model, to provide a reasonable prediction of clot structure.
2.3.3
Fibrous media: Jackson-James and Davies equations
In an effort to find a solution specific to fibrous media, Jackson and James (Jackson and James, 1986) offered another theoretical solution. They constructed a model using prior theories of flow parallel (Sangani and Acrivos, 1982) (numerical) and perpendic-ular (Drummond and Tahir, 1984) (analytical) to rigid rods in a square lattice. They applied their equation to data on a wide variety of fibrous networks, including steel
wire crimps, wool, yarn, filters, acrylamide gel, collagen, and hyaluronic acid polymer.
The volume fractions ranged from 0.0003 < φ < 0.3. While fibrin were not included
in the fit, the wide variety of fibrous materials used to create the equation suggests it
may be broadly relevant for low-volume fraction gels. Their final result was
κ = −3
80
d2f
φ(lnφ+ 0.931). (2.17)
Figure 2.7 shows that the Jackson-James equation shows good agreement with the Carman-Kozeny theory for random arrays of rods.
I have found one example in the literature where fibrin has been tested against a
fibrin clots to an empirical equation developed by Davies (Diamond and Anand, 1993),
κ = d
2
f
70φ3/2(1 + 52φ3/2), (2.18)
concluding that this equation “accurately correlated” data that they had extracted from
earlier published results on fibrin permeability and imaging. However, neither the data
nor the method used to extract them were reported, so I cannot say to what precision
the Davies equation has been validated. Even more alarming, their citation leads to
an equation 4.1.8 in a text (Dullien, 1992) where the coefficients differ from those of Equations 2.18, and the citation is an article I have not been able to find to resolve the discrepancy. Because of its prior use in fibrin, I will bring Equation 2.18 through my discussion in Chapter3. However, as theoretical rather than empirical models, the Jackson-James and Carman-Kozeny theories are ultimately more satisfying.
The ultimate question, however, is which equation is correct; therefore I stress that
the Davies, Jackson-James, and Carman-Kozeny equations, all plotted in Figure2.7, do not disagree dramatically over the relevant range of fibrin volume fractions (φ = 0.001–
0.1). In this range, the theories all appear to lie within the scatter of the data used to
determine the Jackson-James equation.
I must also stress that direct validation of any κ(φ, df) theories is challenging,
because measuring fibrin fiber diameter and volume fraction is notoriously difficult.
Optical microscopy can image fibrin without drying, but it loses reliability for size
detection below the diffraction limit. Electron microscopy can easily resolve specimens
of that size, but the fibers must be dried before they can be imaged, in which case they
shrink and frequently collapse. Therefore, as an alternative to imaging based methods,
I show in Chapter 3 that by inverting these theories, measurements of diffusion and permeability can provide insight into clot structure (df and φ).
2.3.4
Permeability and turbidity
I am discussing theories that predict κ(φ, df). As explained in Section 1.1,
turbid-ity has been mentioned as a high-throughput measurement of clot structure. Could
turbidity therefore be used to find permeability?
The early work on light transmission through fibrin was traditional angle-dependent
light scattering (Carr et al., 2004). This work did indeed reveal fiber lengths and diameters, but not all the fibrin studied were polymerized gels.
Carr and Hermans introduced fibrin turbidity shortly after, presumably because it
is simpler to perform than angle-dependent light scattering. Turbidity of a solution is
the decrease in transmitted light intensity due to scattering and can be calculated by
integration of the scattered intensity over all directions (Carr and Hermans, 1978):
T = 44
15
πKρ0λµ Ti
(2.19)
where Ti is the turbidity at the start time, ρ0 is the fibrinogen concentration, λ is
the incident wavelength, µ is the linear mass density of the fiber (sometimes called
material,
K = 2π
2n2
NAλ4
dn
dρ0
2
,
whereNA is Avogadro’s number.
The angular integration that makes turbidity so convenient as a methodology ruins
its potential as a complete probe of gel structure—namely, of φ and df. Consider the
definition of volume fraction,
φ = π
4nfd
2
fLf (2.20)
wherenf is the number density of fibers and Lf is the length of an average fiber. The
problem is already apparent: Equation 2.20 has three inputs, but turbidity provides only two quantities related to structure, µ and ρ0. In detail, we would begin by using
Vf = (π/4)d2fLf to write
Lf = mf
µ =
mN
µ (2.21)
nf = n
N =
ρ0
mN, (2.22)
where Vf is the volume of the fiber, mf is the average fiber mass, m is the mass of a
fibrin monomer, andN is the average number of fibrin monomers in a fiber. Eliminating
N, we find,
Lf = ρ0 µnf
, so φ= π
4
ρ0
µd
2
f, (2.23)
and we are left without df. Recognizing mf =ρVf, we can write
df = 2
s
Vf πLf
= 2 r µ
πρ, (2.24)
where ρ is the density of monomers in the fiber. This last quantity, ρ, is essentially
the packing of fibrin monomers in a fiber, and it is unknown. Fibrin fibers are under
tension, and that tension may increase as fiber diameter increases (Weisel, 2004), which would cause ρto scale with N. Studies with AFM of dried fibrin fibers have indicated
that the fiber density varies with the radial distance from the axis of the fiber (Guthold et al., 2007). For these reasons, we cannot assume that ρ is constant. Thus, turbidity cannot provide sufficient information to extract gel structure.
The coagulation community relies heavily on turbidity for understanding of clot
structure, and has built an intuition of how turbidity and permeability are related2. I
will linger on this topic to highlight a potential hazard in the way the measurement
is presently used. For two clots with the same polymerization rate, but different final
transmission, there is ambiguity in the clot structure, highlighted in Figure 2.8. The lower final turbidity could be due either to a lower clot volume fraction at a constant
fiber diameter, or to a smaller fiber diameter at a constant volume fraction. The first
case is achieved by reducing the number density of fibers; this would result in a higher
permeability. The second case is achieved by increasing the number density of fibers;
this would result in a lower permeability.
Figure 2.8: Turbidity provides a glimpse into gel structure. Compared with some reference clot (curve A), faster polymerization (indicated by faster rise times, curve B), implies a finer clot. A lower final turbidity (curve C) could be due to lower φ (lower fibrin concentration), which would correspond to a clot with greater permeability than the reference clot. However, lower final turbidity could also be due to smaller fiber diameter (higher thrombin concentration), and this type of clot would be expected to have a lower permeability.
The ambiguity becomes particularly treacherous as more biochemical factors are
introduced. Consider, for example, the relationship between turbidity and permeability
for clots formed in the presence of aspirin (Ajjan et al., 2009). Electron microscopy shows that clots formed in the presence of aspirin have a coarser structure with thicker
fiber diameters, which is similar to the changes in clot structure achieved by decreasing
thrombin concentration, but without the change in clotting time. Aspirin does not
change clotting rate, but it increases the final turbidity. Is this because aspirin promotes
lateral aggregation, decreasing number density of fibers and increasing permeability?
Or is it because aspirin alters lateral aggregation in some fashion, causing fibers to
swell without changing their number density, causing no affect or a small decrease in
permeability? The complexity of the system leaves open questions which turbidity
alone cannot answer.
2.4
Diffusion and Permeability
A wide range of scientists and engineers are concerned simultaneously with fluid
permeation and particle transport through a medium. The filtration community is
concerned less with particle diffusion than with the rejection rate of particles moving
through a barrier (Zamani and Maini, 2009), and therefore pore sizes in the filter are typically designed to be smaller than the particles expected to be passing through,
hydrodynamic effects are typically ignored, and electrostatic effects are considered in
detail (Wijmans and Baker, 1995; Szymczyk and Fievet, 2005). Geological sciences consider gas perfusion through soil and rock (Hamamoto et al., 2009), but pressure-driven advection make dispersion, or mixing, a more relevant phenomenon than in gels
studied in vitro. Novel device research can present an interesting area of overlap, as
some research considers how adding nano-devices to bulk material can enhance particle
diffusion or modify bulk permeability (Zhong et al., 2003;Srebnik and Sheintuch, 2009). There is great interest in these two measurements in polymer gels community.