RECONSTRUCTING THE AUTOBIOGRAPHY OF EDUCATION: ADDRESSING THE
NEEDS OF AFRICAN AMERICAN AND ECONOMICALLY DISADVANTAGED
STUDENTS IN NORTH CAROLINA BEATING THE ODDS AND
HIGH PRIORITY HIGH SCHOOLS
Alvera Junice Lesane
A dissertation submitted to the faculty of the University of North Carolina at Chapel Hill in partial fulfillment of the requirements for the degree of Doctor in Education in the School of Education
Chapel Hill 2008
Approved by:
Advisor: Dr. Kathleen M. Brown
Reader: Dr. Catherine Marshall
ABSTRACT
ALVERA JUNICE LESANE: Reconstructing the Autobiography of Education: Addressing the Needs of African American and Economically Disadvantaged Students in North Carolina
Beating the Odds and High Priority High Schools (Under the direction of Dr. Kathleen M. Brown)
Universal public education is recognized as the key to equalization of opportunity.
Wherein Brown vs. Board of Education provided greater access to “equal” classrooms, No
Child Left Behind (NCLB) aspired to ensure that all students are actually learning within
those classrooms. NCLB’s purpose was to ensure that all children in America, including
identified—and often marginalized—subgroups are able to meet the learning standards of the
federal government and the state where they live. Yet, seven years after the passage of
NCLB, many of these subgroups, namely African Americans and economically
disadvantaged students, have not fared favorably after reviewing educational data, including
everything from achievement scores, national testing results, and suspension data to the
ultimate predictor of success, graduation rates (AEE, 2008; Anderson, Medrich, & Fowler,
2007; Harris & Herrington, 2006; Harvard Civil Right Project, 2005; Ladson-Billings, 2006;
Singham, 2005; Thompson, 2007). The purpose of this research is to examine how teachers
and principals prioritize the needs of African American and economically disadvantaged
students when focusing on key categories identified in successful schools. The study will
utilize a combined framework incorporating Critical Race Theory and Critical Discourse
American and economically disadvantaged populations verbalize their prioritized need to
I dedicate this body of work to my family. I especially honor Leona and Eugene
Dalton, “Short” and Pearl Johnson, and Alice and Johnson Lesane for the foundation and
ACKNOWLEDGEMENTS
I give honor to God who allows you to stretch in ways you could never imagine.
To Dr. Kathleen Brown … I knew from day one of the MSA program that you were
truly someone special and you have proven that yet again! Thanks for your spirit, your
mentorship, your advice and your honesty. To Dr. Catherine Marshall … thanks for serving
on my committee and bringing your expertise, challenges, insight and flexibility. Most of all,
thanks for being another phenomenal woman working in the field. To Dr. George Noblit … I
also thank you for serving on my committee and bringing your expertise, challenges, insight
and flexibility. Your encouragement to be creative and share the counter-story has ignited a
spark that will extend well beyond this work.
To my mom, thanks for EVERYTHING! You have always been there to encourage,
support, and most of all pray. To my kindred spirit, my father, thanks for your continuous
support, understanding without words and unconditional love. I love both of you dearly.
To my brother, Corey, thanks for being you through this whole process. You never
turned me down no matter what time I called or what I asked you do. I enjoyed reminiscing!
Renee, I have truly enjoyed the journey and blessed even more by the lifelong
sisterhood. Darnell, Kristie, LaChay all of my other “sisters,” thanks for allowing me to share
and all of your patience and support through this process. Sharon and Marie, I truly
appreciate how you always take care of me . . . you are jewels. Brenda, you will never know
how much your support has meant. To my extended network of family and friends, I love all
TABLE OF CONTENTS
LIST OF TABLES ... xiii
LIST OF FIGURES ... xiv
ABBREVIATIONS ...xv
Chapter I. INTRODUCTION ...1
Statement of the Problem ...2
Purpose of the Study ...3
Research Questions ...3
Definitions...4
High School Resource Allocation (HSRA) Study ...5
“High Priority” (HP) Schools ...5
“Beating the Odds” (BTO) Schools ...6
Critical Race Theory (CRT)...6
Critical Discourse Analysis (CDA) ...6
Critical Racial Discourse Analysis ...7
Principal Instructional Management Rating Scale (PIMRS) ...7
Positionality ...9
Significance of the Study ...10
II. LITERATURE REVIEW AND THEORETICAL FRAMEWORK ...12
Introduction: The Autobiography of Education ...12
A Call for Action: The “Achievement Gap” and the Graduation “Crisis” ...13
Achievement Gap or Education Debt? ...15
The National Perspective ...16
The Southern Perspective ...17
The North Carolina Perspective ...19
Graduation and Dropout Rates: Narrowing the Focus ...20
The Historical Context ...21
Segregation ...21
Desegregation ...22
Resegregation ...23
The Rise of Accountability ...26
No Child Left Behind (NCLB) ...26
The North Carolina Accountability Program ...28
Leandro ...29
Evidence from Successful Schools ...31
Gaining Traction, Gaining Ground: How Some High Schools Accelerate Learning for Struggling Students ...32
Closing the Gap: Lessons from Successful Schools ...33
School Climate and Culture ...33
Support Systems, Family and Community Connections ...36
Leadership ...37
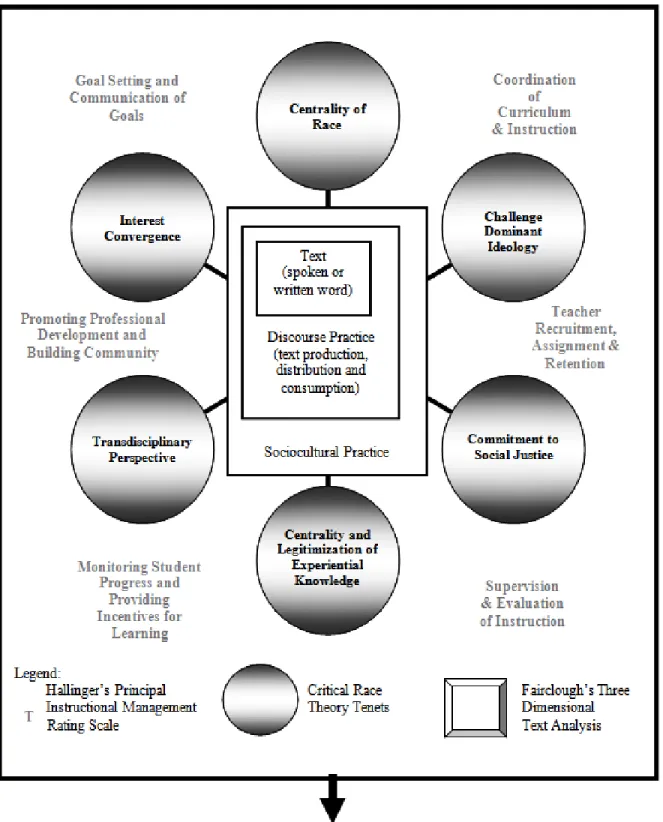
Theoretical Framework: Establishing a Context for Critical Racial Discourse Analysis...39
Critical Theories...40
Critical Race Theory (CRT)...40
Property Rights ...41
The Tenets of Critical Race Theory ...42
The Centrality of Race and Racism and Their Intersectionality with Other Forms of Subordination ...42
The Challenge to Dominant Ideology ...43
The Commitment to Social Justice ...43
The Centrality of Experiential Knowledge—Legitimization of Perspective ...43
The Counter-Story. ...44
The Transdisciplinary Perspective ...45
Interest Convergence ...45
Critical Discourse Analysis (CDA) ...45
The Focus on Social Issues ...46
Power Relations are Discursive ...46
Discourse Constitutes Society and Culture ...46
Ideologies are Produced and Reinforced through Discourse ...47
The Focus on Historical Context ...47
The Interpretive and Explanatory Premise ...48
Discourse is a Form of Social Action ...48
Critical Racial Discourse Analysis ...48
III. METHODOLOGY ...51
Introduction ...51
Purpose of the Study ...51
Theoretical Framework ...51
Research Design...52
Major Research Questions ...53
Rationale for Qualitative Approach ...54
Role of the Researcher – Researcher Reflexivity ...55
Site Selection and Participants ...56
Sites ...58
Access ...60
Data Collection ...61
Data Analysis ...62
Establishing Trustworthiness ...63
Limitations ...64
Positionality ...65
Significance of the Study ...66
IV. DATA ANALYSIS ...68
Introduction ...68
Data Analysis ...70
Evidence of the Master Narrative ...71
Principal Instructional Management Rating Scale (PIMRS) ...72
Goal Setting and Communication of Goals ...72
Coordination of Curriculum and Instruction ...79
Teacher Recruitment, Assignment and Retention ...86
Supervision and Evaluation of Instruction ...89
Monitoring Student Progress and Providing Incentives for Learning ...92
Promoting Professional Development and Building Community ...96
Summary ...98
The Autobiography of Education ...99
V. OVERVIEW, IMPLICATIONS AND RECOMMENDATIONS ...101
Overview ...101
The Wreck ...101
Returning to the Plantation ...105
Implications: Three Emerging Themes ...106
Policing ...106
My Story: Policing ...109
The Savior Mentality ...112
My Story: The Savior Mentality ...115
Deficit Thinking ...116
Implications for Future Study ...123
Summary ...125
APPENDIX A. INTERVIEW PROTOCOL (PRINCIPALS) ...127
APPENDIX B. INTERVIEW PROTOCOL (TEACHERS) ...131
APPENDIX C. IRB APPLICATION ...135
LIST OF TABLES Table
2.1 Summary of Policy Reforms and Achievement Gap Trends ... 14
2.2 Percentage of Students in 50-100 Percent Minority Schools in the South
and Border States by Race, 2003-04 ... 26
3.1 Summary of Demographics and Academic Performance for High Priority
High Schools in North Carolina ... 57
3.2 Summary of Demographics and Academic Performance for “Beating the
Odds” High Schools in North Carolina ... 59
4.1 Summary of the BTO High School and the High Priority High School
LIST OF FIGURES Figure
ABBREVIATIONS BTO “Beating the Odds” Schools
CDA Critical Discourse Analysis
CRT Critical Race Theory
EOC End of Course Tests
EOG End of Grade Tests
EQ Essential Question
HP “High Priority” Schools
CHAPTER 1
INTRODUCTION
Even though they are located in different states and different communities throughout the United States, most low-performing schools tend to have three things in common: they have a high percentage of minority students, they have a high percentage of low-income students, and they tend to be located in neighborhoods where most middle- and upper-class whites would never live. In other words, these schools are usually attended by what I call America’s stepchildren. (Thompson, 2007, p. 4)
The Alliance for Excellent Education (AEE) (2008) denotes that about 14% of
American high schools produce more than half of the nation’s dropouts. These “dropout
factories” generally house the “stepchildren.” Will the plight “America’s stepchildren” make
it into the autobiography of education? In an effort to present an insider perspective, will
educators omit the marginalized, construct a romanticized story, or institute true
reconstruction leading to historical change? Irving Kristol (1978), a neo-conservatist stated,
“Democracy does not guarantee equality of conditions--it only guarantees equality of
opportunity” (p. 5). Does democracy guarantee equality of opportunity simply by living in
America? In an industrialized nation recognized across the world as the land of opportunity,
there continues to exist what Lui, Robles, and Leondar-Wright(2006) collectively term the
“Racial Wealth Divide.” This divide accounts for the economic gaps that are a result of
historical and contemporary barriers to wealth creation for certain marginalized groups and
the negative impact this system has on society. The racial wealth divide exists as children
enter school and it pushes them into prescribed roles as they leave high schools as
Statement of the Problem
Universal public education is recognized as the key to equalization of opportunity.
Wherein Brown vs. Board of Education provided greater access to “equal” classrooms, No
Child Left Behind (NCLB) aspired to ensure that all students are actually learning within
those classrooms. NCLB’s purpose was to ensure that all children in America, including
identified—and often marginalized—subgroups are able to meet the learning standards of the
federal government and the state where they live. Yet, seven years after the passage of
NCLB, many of these subgroups, namely African Americans and economically
disadvantaged students, have not fared favorably after reviewing educational data, including
everything from achievement scores, national testing results, and suspension data to the
ultimate predictor of success, graduation rates (AEE, 2008; Anderson, Medrich, & Fowler,
2007; Harris & Herrington, 2006; Harvard Civil Right Project, 2005; Ladson-Billings, 2006;
Singham, 2005; Thompson, 2007)
From the 1970s to 2004, National Assessment of Education Progress (NAEP) trends
indicate that while there has been some closing of the achievement gap, there are still
significant differences between the performance of Black and White students (United States
Department of Education, 2005). The initial large gains (sometimes more than ten points
within a year) have also diminished since the 1990s to less than two to three point gains, and
in some cases increased gaps, in more recent years. The AEE (2008) and the Harvard Civil
Rights Project (2005) have also highlighted the great disparities in graduation rates. While
graduation rates for the nation are only 70%, little more than half of African American
students graduate from high school, with differences between their White counterparts
of family income is about seven times more likely to complete high school as one coming
from the lowest quartile (AEE, 2008). While there is evidence from comprehensive empirical
studies of practices that work in schools with high minority and high lower-income students
(Billig et al., 2005; Education Trust, 2005a), there is limited research focused on high schools
with higher percentages of challenging populations (greater than 50 percent African
American and economically disadvantaged) that show sustained success over time. Hence,
the systems and institutions that reflect and produce these disparities must acknowledge the
degree to which they reproduce the inequities in larger society and make greater strides to
address the needs of marginalized groups.
Purpose of the Study
The purpose of this research was to examine how teachers and principals prioritize
the needs of African American and economically disadvantaged students when focusing on
key categories identified in successful schools. The study utilized a combined framework
incorporating Critical Race Theory and Critical Discourse Analysis to determine the degree
to which identified schools with significant African American and economically
disadvantaged populations verbalize their prioritized need to focus on issues of marginalized
groups. Are they silenced when it comes to discussing issues of race? Do teachers and
principals reflect the same commitment to goals directed at closing the gap? Do these schools
become trailblazers of success or reproducers of prescribed societal positions?
Research Questions
To attempt to meet the detailed purpose, the study was designed to answer the
following question: How do North Carolina teachers and principals in “Beating the Odds”
disadvantaged students across six categories of the Principal Instructional Management
Rating Scale (PIMRS):
1. Goal Setting and Communication of Goals;
2. Coordination of Curriculum and Instruction;
3. Teacher Recruitment, Assignment and Retention;
4. Supervision and Evaluation of Instruction;
5. Monitoring Student Progress and Providing Incentives for Learning;
6. Promoting Professional Development and Building Community
To build a framework for answering the main question, the study focused on answering the
following distinct subquestions:
1. How do North Carolina teachers and principals explicitly target the needs of
African American and economically disadvantaged students in “Beating the
Odds” and “High Priority” high schools across seven categories of the Principal
Instructional Management Rating Scale (PIMRS)?
2. How do North Carolina “Beating the Odds” and “High Priority” high schools
address the needs of African American and economically disadvantaged students
differently across the seven identified categories?
3. How do the words utilized by teachers and principals in North Carolina “Beating
the Odds” and “High Priority” high schools reflect the trends in the academic
achievement of African American and economically disadvantaged students?
Definitions
For the purposes of the research, it is important to define several key terms that
(HSRA) Study, “High Priority” schools, “Beating the Odds” schools, Critical Race Theory,
Critical Discourse Analysis, Critical Racial Discourse Analysis and Principal Instructional
Management Rating Scale.
High School Resource Allocation (HSRA) Study
The HSRA Study was conducted largely in response to Judge Howard Manning’s
questions regarding the connection between resources and student success in the Leandro
case. Governor Mike Easley commissioned the UNC-Chapel Hill School of Education to
work with the State Board of Education and the N.C. Department of Public Instruction in an
effort to conduct audits of high schools in all North Carolina school districts. The research
identified high schools that succeed with struggling students (“Beating the Odds” schools)
and compared them with high-priority high schools. The quantitative analysis included
teacher and principal qualifications and spending patterns to determine if there are significant
differences between the high-performing and high priority schools. In the qualitative phase of
the research, interviews were conducted at the high priority and identified high-performing
high schools to help determine how they use resources and how they deal with the barriers to
success.
“High Priority” (HP) Schools
This terminology refers to specific North Carolina high schools labeled as low
performing by Judge Howard Manning. In March 2006, Judge Manning wrote a letter to state
education officials regarding high schools with consistent poor performance. Nineteen high
schools were identified as low-performing (high priority) due to performance composites of
55 percent or less from the 2000-2001 to the 2004-2005 school year. The designation as a
negative connotations and to highlight the need for these schools to truly become
“prioritized” in their respective school systems. Taken together, all nineteen HP schools have
an average African American student population of 80 percent, with no school below 55
percent.
“Beating the Odds” (BTO) Schools
In the High School Resource Allocation Study, “Beating the Odds” (BTO) schools
were identified based on a criteria of 70 percent or better performance composites with
challenging student populations, including high percentages of students from economically disadvantaged and African American households. All five North Carolina BTO schools
experienced High Growth in 2004-2005, as did four of the five in 2005-2006. The BTO
schools are significant because there are no high-performing high schools in North Carolina
with comparably challenging student populations.
Critical Race Theory (CRT)
With a strong focus on the work of Ladson-Billings and Tate (1995), CRT is defined
as the analysis of race as a tool for understanding inequities. Furthermore, this definition
recognizes the importance of gender-and class-based analyses, but only as secondary to race.
Critical Discourse Analysis (CDA)
This research adopts van Dijk’s (2001) definition of CDA as “a type of discourse
analytical research that primarily studies the way social power abuse, dominance, and
inequality are enacted, reproduced, and resisted by text and talk in the social and political
context” (p. 352). The theoretical framework, however, incorporates Norman Fairclough’s
(1995) three-dimensional analysis of text to illustrate the power context from the spoken
Critical Racial Discourse Analysis
Therefore, CRT and CDA combined challenge cultural assumptions through the
selection of research questions based on work of scholars who highlight the contradictions
between points of leverage (i.e., accountability vs. equity), structure their research questions
around the issues of their marginalized clients and declare that only the critical consciousness
of administrators, teachers and students will foster social change rather than reproduction
(Apple, 1996; Achinstein, Ogawa, & Speiglman, 2004; Banks, 1999; Brosio, 1994; Nieto,
1999a, 1999b).
Principal Instructional Management Rating Scale (PIMRS)
Hallinger and Murphy (1985) developed an instrument for measuring the instructional
leadership behavior of principals called the Principal Instructional Management Rating Scale
(PIMRS). This instrument assesses how much instructional leadership principals are
providing, based on their performance across ten dimensions of instructional management
job functions associated with leadership in effective schools. The instrument contains fifty
statements about principal behavior, indicating the degree to which the principal is active in
that function. This research utilized an interview protocol based on questions addressing six
of the dimensions from the PIMRS as the background for secondary analysis.
Delimitations and Limitations
Research is affected by controlled and uncontrolled factors that ultimately have the
potential to impact results. Some of these factors are defined as delimitations and limitations.
Delimitations narrow the scope of a study, while limitations are potential weaknesses that
Delimitations for this study include the selection of schools. The study includes North
Carolina high schools with significant populations of African American and economically
disadvantaged students. There are, however, no schools in North Carolina that are recognized
as “High-Performing” with populations reflective of the ones included in the study.
Therefore, aligned to the High School Resource Allocation (HSRA) Study, the study focuses
on identified “High Priority” and “Beating the Odds” high schools.
The study was further delimited by the selection of schools for which a full realm of
data could be obtained. This includes demographic data as well as clear and complete
transcriptions of interviews. I did not want to rely on interpreted data in cases where full
transcriptions were not available.
This study has a number of limitations beyond the control of research. First,
numerous factors were uncontrolled by the researcher due to the use of a secondary data set.
While I participated in data collection for the initial HSRA Study, there was also a reliance
on data from other interviewers. Interviewees were asked questions regarding the seven
identified categories mentioned above, therefore limiting the possibility of deeper inquiry or
additional questioning. There was also no control over the interview protocol.
Additionally, participants were asked specifically about students from African
American or lower socioeconomic backgrounds. While the interview protocol provided an
opportunity for them to have an open forum to discuss issues of race and socioeconomics as
priorities, it also did not specifically give them the opportunity to expand on thoughts and
strategies they may actually posses and utilize regarding these targeted groups.
While incorporating a framework that combines Critical Race Theory and Critical
tenet of Critical Race Theory is the counter-story. The counter-story is the story of the
marginalized group (Solórzano & Yasso, 2002). Yet, the HSRA Study does not incorporate
the voices of African American and economically disadvantaged students. In, fact it does not
even include the voices of their parents. Solórzano and Yasso (2002) broaden the definition
of counter-story-telling as “a tool for exposing, analyzing, and challenging the majoritarian
stories or racial privilege … shatter[ing] complacency, challeng[ing] the dominant discourse
on race and further[ing] the struggle for racial reform” (p. 32). There is great value in the
counter-story, but it was limited in this research in terms of hearing the voices of the students
and parents. While the methodology implemented creates a counter-story, the construction of
the point of view includes the words of the principals, teachers and the researcher. The study
also did not include interviews with counselors or other educational personnel.
Positionality
Walking through the hallways of the HSRA study high schools in jeopardy and the
ones wearing a badge of honor (yet still not being so far away from the jeopardized status
themselves), I saw many faces that were like looking in the mirror at myself. As I walk
through the hallways of other high schools doing my daily work, the same images call me. In
the wake of Judge Howard Manning’s decision in the Leandro case, about 10 percent of the
state’s high schools were identified as “failing” or low-performing based on the End of
Course (EOC) testing. In these high schools, less than 60 percent of the students are
proficient EOC. When looking at the schools on Judge Manning’s list, all were schools with
50 percent or more of the population being African American students. In more recent times,
a great deal of research has focused on the role of socioeconomic status in student learning,
whether or not the child lives in poverty. Yet, the schools that are on the list, while having 50
percent or less free or reduced lunch populations, all have more than 50 percent African
American students. Why are there no schools with more than 50 percent White, Hispanic or
Asian students? Why are there no higher performing schools with more than 50 percent
African American students. Interestingly enough, the high school I attended could have been
on the list except for the fact that enough African American students did not attend. Yet, the
city high school had all of the markings of the high priority schools, largely due to its
composite population.
My positionality was the center of this project choice. I wanted to create dialogue
about the “elephant in the room” . . . that our history of racial division still plays an active
role in determining the opportunities for our children. I want the disenfranchised “others” to
see the value of their positions . . . along with the choices that are often too difficult to see.
While I have taken advantage of the opportunity education has afforded via honors and
advanced placement classes in high school to my current efforts seeking this terminal degree,
for all the successes I can document that happened largely due to the educational system,
there are numerous accomplishments—while not without supports—achieved despite the
system.
Significance of the Study
This study strove to begin construction of the counter-story for African American
students within the context of North Carolina high schools. In the construction of the
counter-story, however, there must first be a call within research to hear of the voices of
those impacted most by the discussion. Although parts of the counter-story reflect
is critical for America to acknowledge the degree to which it truly believes that all children
can learn. Brown (2008) asserts:
Changing demographics of the student population of the nation’s schools (i.e., more students of color), the stable demographics of the teaching force (i.e., White, middle class, females), and the growing contrast between the two sets of demographics support the need for all educators to increase their knowledge and social
responsibility toward diversity and equity related issues. (p. 9)
This process begins with awareness and acknowledgement of the majoritarian
assumptions and how they impact the process of education. As the autobiography of how
America educates its “stepchildren” is written, however, this awareness and
acknowledgement must be translated into action if the legacy is going to be one of true
CHAPTER 2
LITERATURE REVIEW AND THEORETICAL FRAMEWORK
Introduction: The Autobiography of Education
[We] do not leave their values at the door . . . On the contrary, as much as [we] might want to hide or avoid them, [our] values and beliefs slip in the door with [us]. In fact, [we] bring [our] entire autobiographies with [us]: [our] experiences, identities, values, beliefs, attitudes, hangups, biases, wishes, dreams, and hopes. It is useless for [us] to deny this; the most [we] can do is acknowledge how these may either get in the way, or enhance, [our] work with students . . . “Even in our indifference, we take a
position.” [teacher quote] If this is true, then the best that [we] can hope for is to candidly confront [our] values to understand how they help or get in the way of [our] work with students. (Nieto, 2003, pp. 24-25)
Like the teachers Sonia Nieto speaks of in this selection, all key players in the
educational realm bring their “autobiographies” to their jobs and, more importantly, their
positions within those jobs. The “autobiographies” of teachers, counselors, principals, central
office support, superintendents, boards of education members and policymakers have shaped
the larger life history of education in America. Yet, in an industrialized nation recognized
across the world as the land of opportunity, there continues to pervade what Lui et al.(2006)
collectively term the “Racial Wealth Divide.” This divide accounts for the economic gaps
that are a result of historical and contemporary barriers to wealth creation for certain
marginalized groups and the negative impact this system has on society. This racial wealth
divide exists as children enter school and it pushes them into prescribed roles as they leave
high schools as graduates—or non-graduates. Irving Kristol (1978), a neo-conservative
opportunity” (p. 5). In striving to provide equal opportunities, what would American
education’s autobiography say about its success in addressing the needs of African American
and economically disadvantaged students in serving as the equalizing force to bridge this
divide?
This review establishes a context for the importance of acknowledging and analyzing
the disparities that contribute to and reinforce the racial wealth divide, with a focus on
African Americans and economically disadvantaged students. The focus consists of
highlighting some key aspects of the “achievement gap” as it relates to differences between
African American and economically disadvantaged students and their White counterparts in
academic performance and graduation rates. As the focus narrows to the high school
“problem,” perspectives will be provided from the national, regional and North Carolina
level. After establishing the current issues requiring action, a historical context is be provided
with a particular focus on periods of American educational history most impacting the “gap”
and ultimately leading to a rise in accountability. Finally, I will contextualize the current
research based on the North Carolina events leading to the study and provide a theoretical
framework.
A Call for Action: The “Achievement Gap” and the Graduation “Crisis” Graduation rates are a fundamental indicator of whether or not the nation’s public school system is doing what it is intended to do: enroll, engage, and educate youth to be productive members of society. In today’s increasingly competitive global
economy, graduating from high school is more critical than ever to securing a good job and a promising future … On average, dropouts earn less and experience a poorer quality of life than those who graduate, but the individuals themselves are not the only ones who suffer; there are significant costs to the communities and states in which they live, as well as to society at large. (AEE, 2008, para. 1)
This quote captures not only the major purpose of schooling—to prepare students to
students to do so on an annual basis. When great disparities can be seen in the success of
students to achieve this goal along racial and socioeconomic lines, additional questions about
the current system arise. In addition to concerns about graduation rates, results from the
National Assessment of Education Progress (NAEP) consistently show that Whites score
significantly higher than Blacks and Hispanics at all tested levels in both reading and math
(USDOE, 2005). From the 1970s to 2004, NAEP trends also indicate that while there has
been some closing of the achievement gap, there are still significant differences between the
performance of Black and White students (USDOE, 2005). The initial large gains (sometimes
more than ten points within a year) have also diminished since the 1990s to smaller than two
to three point gains, and in some cases increased gaps, in more recent years.
Harris and Harrington (2006) summarize different trends in policy reforms and their
correlation to the achievement gap (see Table 2.1).
Table 2.1. Summary of Policy Reforms and Achievement Gap Trends
Policy Categories
Content and Time Standards
Accountability
Government-based Market-based
Specific Policies School days/year, Hours/day, Course require. Promotion/ Graduation Exams Takeovers, Oversight, Reconstitution School report cards Vouchers, Charters, School Choice
Achievement Gap Large Decrease Large Decrease Small Increase Small Increase Small Increase
Approximate Years 1950s-1970s 1980s 1990s
They also admit that the association of the policies and the suggested impact on the
achievement gap is drawn with what they term to be “fuzzy” boundaries. Nevertheless, while
they are not suggesting causation, their framework raises important questions regarding the
measures that articulate the rhetoric of equality often actually result in an increase in the
achievement gap?
Achievement Gap or Education Debt?
Ladson-Billings (2006), cautions against a focus on the achievement gap. She not
only asserts that such a focal point is short-term and misleading, but she continues by
highlighting the “education debt.” Like Harris and Harrington (2006), she also highlights the
contradictions an increasing gap in the following quote:
[T]here was a narrowing of the gap in the 1980s . . . and a subsequent expansion of those gaps in the 1990s. The expansion of the disparities occurred even though the income differences narrowed during the 1990s. We do not have good answers as to why the gap narrows or widens. Some research suggests that even the combination of socioeconomic and family conditions, youth culture and student behaviors, and schooling conditions and practices do not fully explain changes in the achievement gap . . . However, when we begin looking at the construction and compilation of what I have termed the education debt, we can better understand why an achievement gap is a logical outcome . . . [T]he historical, economic, sociopolitical, and moral
decisions and policies that characterize our society have created an education debt. (p. 5)
Ladson-Billings compares a focus on the achievement gap to the national deficit. Just as a
zero deficit does not equate to no debt, closing the achievement gap does not eliminate the
education debt. In other words, a failure to address these historical, economic, sociopolitical
and moral aspects, particularly in relation to policy development, will only continue to
multiply our education debt along with the “interest.”
Singham (2005) also supports much of Ladson-Billings’ position through his
diagnosis of the complexity of the “achievement gap” by recognizing the “education debt.”
He does so by outlining several myths regarding the “achievement gap.” His first premise
dispels the myth that the “achievement gap” is simple along with its obvious solutions. He
be easier to understand due to its “repeatable and predictable systems,” unlike the “problems”
of education (p. 30). A second myth is that gaps exist solely due to the inadequacy of
“minority” educational experiences, which assumes that experiences of other groups are
appropriate. He akins this logic to a scene from My Fair Lady when Professor Henry Higgins
asks, “Why can’t a woman be more like man?” This suggestion that, in a similar spirit,
“minority” students could solve the gap problem by “acting [W]hite” devalues these
“minorities” and hides the fact that there are many students underachieving within the
educational system. The third myth highlighted by Singham most parallels Ladson-Billings’
position and centers around the assumption that the “gap” problem is a K-12 issue. This
notion fails to recognize the “debt” that African American students in particular begin school
with, largely due to the “Racial Wealth Divide.” It also romanticizes the abilities of K-12
education to cure the larger ills of society, when the system generally reinforces the positions
of the parents. A review of the current status of the gaps at the national, southern and state of
North Carolina levels reveals the importance of constructing a different story for the
educational “autobiography” in order to establish a greater legacy of equality.
The National Perspective
The AEE (2007) provides perspective on the graduation rates based on 2003-2004
data stipulating that
The Harvard Civil Rights Project (CRP) (2005) acknowledges what they call an American
“crisis” in education as they highlight, “Every year across the country, a dangerously high
percentage of students—disproportionately poor and [“minority”]—disappear from the
educational pipeline before graduating from high school” (p. 1). The statistics from their
research, in collaboration with the Urban Institute, also support the findings of the AEE
(Harvard Civil Rights Project, 2005). Furthermore, the CRP, highlighting the gaps between
Black, Latino, and Native American students and their White counterparts, aligns to the data
from the AEE analysis. The CRP (2005) also notes that graduation rates are even lower for
“minority” males specifically. The Harvard Civil Rights Project (2005), along with the AEE,
specify the difficulty of tracking due to ambiguous, erroneous and unaligned reporting of
dropout and graduation rates coupled with a preoccupation with testing data across the
nation, leading to what the CRP terms as a “civil rights crisis” (p. 1).
The Southern Perspective
The Harvard CRP (2005) narrowed their focus by reviewing discrepancies in scores
in the South, which has some of the lowest graduation rates in the country coupled with large
and growing concentrations of African Americans and Latino populations. Additionally, the
segregation/desegregation/resegregation transformation resulting from racial inequality has
plagued the region. In the report, the Harvard CRP (2005) found the following results from
their focus on identified Southern states:
. . . graduation rates in 2002 ranging from a high of 85 percent in North Carolina to a low of 61.8 percent in Georgia. When a more accurate measurement, the Cumulative Promotion Index (CPI) was used, the graduation rates for these five states [Florida, Georgia, Louisiana, Mississippi and North Carolina] dipped far lower than these official estimates . . . In Georgia . . . the rates for Blacks, Latinos and Native
special focus states—Louisiana—did more than half (51.1 percent) of Black males graduate on time. In Florida, Black males had the lowest graduation rate out of the five states, a mere 38.3 percent. Of the two states where data on Native American males is available, North Carolina had a graduation rate of just 31.7 percent. (pp. 2-3)
Additionally, the AEE answered the question, “Where are students dropping out?” by
concluding that there are a relatively small number of “chronically underperforming high
schools” responsible for more than half of the nation’s dropouts (AEE, 2007). Furthermore,
they detail, based on 2003-2004 data, that
(1) about 14 percent of American high schools produce more than half of the nation’s dropouts [in] ‘dropout factories,’ [in which] the number of seniors enrolled is
routinely 60 percent or less than the number of freshmen four years earlier; (2) [80] percent of the high schools that produce the most dropouts can be found in a subset of just fifteen states . . . located in northern and western cities and throughout the
southern states; and (3) [these] dropout factories produce 81 percent of all Native American dropouts, 73 percent of all African American dropouts, and 66 percent of all Hispanic dropouts. (AEE, 2007, p. 1)
Juxtaposed to the lack of success in identified “dropout factories,” the Harvard CRP
(2005) addressed a more recent notion of “beating the odds” schools. By spotlighting the
work of researchers at Johns Hopkins University, they recognize schools that graduated a
“higher than expected” percentage of students in each of the five southern states based the
following criteria:
1. at least 40 percent of students qualify for free lunch; 2. where 25 percent or more of students are Black or Latino;
3. and where promoting power, defined as a school’s success in moving students from grade to grade, averaged over three years (2000-2002), was at least 80 percent. (p. 3)
The article details the results:
In Georgia, they could not identify a single school that met the criteria. In Florida, they found only two such schools, four in North Carolina, [twelve] in Louisiana, and [fifteen] in Mississippi. The problems that these schools face are likely to become more severe, because Blacks in all Southern states have faced increasing segregation since 1990 and 9/10 of highly segregated Black or Latino schools experience
In addition to the minuscule number of identified “beating the odds” schools from
each of the states, one must also consider the criteria, wherein a 40 percent free and reduced
lunch population combined with a 25 percent Black and Latino population does not define
most of the schools that are on each of the state’s “lists” or the demographics of the schools
labeled as “dropout factories.” The notion of “beating the odds” itself is contradictory to the
very premise of No Child Left Behind (NCLB) and the attempts to close the achievement
gap. If NCLB sets the expectation of success at 100 percent for every child, then how can we
accept the idea that any school would be “beating the odds” at less than 100 percent, despite
their free and reduced lunch or “minority” populations?
The North Carolina Perspective
Using consistent 2003-2004 data sources from the AEE (2005) analysis, North
Carolina (NC) reported an overall graduation rate of 66.1 percent. Yet, only 57 percent of the
Black student population graduates with a diploma in four years in comparison to 71.7
percent of their White counterparts (Harvard Civil Rights Project, 2005). The results are
equally disappointing for the Latino student population at 53.8 percent. This presents a
performance gap of approximately fifteen and seventeen percentage points respectively
between the White student population and their Black and Latino counterparts. Additionally,
information from the Public Schools of North Carolina (2007) regarding dropout rates
indicates little progress in improving these results. In 2005-2006, Black males accounted for
a disproportionate amount of the increase in dropout count, as the rates for Blacks overall
increased. The dropout rates for Latino and American Indian students remained high. Yet, the
The increase in the number of male dropout events was also more than twice the increase in
female dropout events.
Graduation and Dropout Rates: Narrowing the Focus
Though dropout or, conversely, graduation rates are largely impacted by factors that
occur across pre-kindergarten through high school grade levels, the timing of students
dropping out is notable. In a report from the National Dropout Prevention Center and
Communities in Schools, Cathy Hammond, Dan Linton, Jay Smink, and Sam Drew (2007)
reveal, with wide variations reflected in different populations, trends that suggest that the risk
of dropping out increases throughout high school, with most students dropping out in the
11th or 12th grades. Though the grade levels may vary in particular regions and for specific
groups, the largest majority of withdrawals from the educational process occur between
grades 9 and 12. There is also evidence that there are differences in predictive factors
between early and late dropouts, finding retention to be the strongest predictor of early
dropout and misbehavior to be the strongest predictor of later dropout (Hammond et al.,
2007, p. 20). In outlining the risk factors, and ultimately offering suggestions to address them
from successful programs, Hammond et al. also identified four domains for intervention,
including the individual, the family, the school and the community, reiterating a need to
analyze sociopolitical factors as a multifaceted approach to tackling the issue.
In an effort to address the CRP’s and other stakeholders defined “crisis” when
reviewing the data, researchers must strive diligently to define what key strategies impact the
success of “minority” (especially African American and economically disadvantaged)
factors in mind, this research will focus largely on high schools, with fewer references to
elementary and middle schools data and student experiences.
The Historical Context
From its inception, schooling in America has articulated the promises of democratic
ideals, but it has often fallen short in the case of marginalized groups. With a history of
forced migration and slavery, education for African Americans, in particular, has transformed
from subjection to punishment for learning to read to the vast disparities of today. Yet, the
assumption is that access to opportunities to learn is equal. In the following section, the
impact of schooling on marginalized groups is reviewed with a particular focus on the
segregation to resegregation eras and the changes in legal tides leading to the current state of
vast differences in the academic success of African American and low-income students in
comparison to their counterparts.
Segregation
Although the Fourteenth Amendment of the U. S. Constitution provided citizens “life,
liberty and property” via due process, Blacks still continued to reside in a system of
segregation. From 1876 to 1910, the Supreme Court routinely ruled antidiscrimination laws
unconstitutional, encouraging the further development and maintenance of segregation laws
in the South. Numerous segregation statutes regulated virtually every aspect of everyday life,
including adoption, business licenses, health care, housing, prisons, public accommodations,
public transportation, and race classification. The sentiment of the Supreme Court shifted
from not only ruling antidiscrimination laws as unconstitutional to determining segregationist
Ferguson’s decision allowing states to require distinct facilities for Blacks and Whites under the guise that they were “separate but equal” (Pettigrew, 2004, p. 521).
The early 1900s signaled changes in the Supreme Court that set the stage for the
transformation of the segregationist trends. The Supreme Court ruled unconstitutional a
number of city ordinances requiring residential segregation, “grandfather clauses” excluding
Blacks from their constitutional rights, and “White-only” primaries (Pettigrew, 2004, p. 522).
Desegregation
Beginning in 1930, the Supreme Court slowly began to support the rights of Blacks,
by determining that the exclusion of minorities from juries was discriminatory. During this
period, the court also upheld state antidiscrimination laws, ruled for nondiscriminatory
seating on trains, and held restrictive housing covenants to be unenforceable. Additionally,
“separate but equal” became more narrowly defined by the Supreme Court. By 1950, in the
education cases of McLaurin v. Oklahoma State Regents and Sweat v. Painter, “equal”
became defined not only in terms of brick and mortar, but also characterized by such aspects
as faculty reputation and prestige. These decisions provided the precedents for Brown v.
Board of Education (1954) to hold that separate is inherently unequal.
Though the Supreme Court’s racial decisions have long assumed psychological and
sociological phenomena without evidence, Brown provided such evidence through the use of
social psychologists as expert witnesses to prove the impact of the segregation on African
American students. Despite the fact that the initial Brown decision passed with a nine-to-zero
vote, the Court fell short with its retreat from the implementation order to vaguely indicate
enforcement to southern district courts without specific guidelines. This critical decision
delayed the implementation of school desegregation for almost twelve years.
By the 1970s, however, the South had more racial desegregation, transforming the
region from the most segregated to the most integrated area in the United States. During this
period, the Supreme Court continued to rule in favor of desegregation. In 1968, in Green v.
County School Board of New Kent County, “freedom of choice” plans were overturned. In Alexander v. Holmes County Board of Education (1969), the Court declared that public school desegregation must be achieved “at once” and “operate . . . hereafter only on a unitary
basis.” In 1971, in the famous North Carolina case of Swann v. Charlotte-Mecklenberg
Board of Education, the Court rejected the district’s plan that maintained racial segregation and approved busing to desegregate each of the system’s urban schools.
In 1973, Keyes v. Denver School District No. 1 resulted in the final major court
decision during the desegregation period. In this case, the Court not only rendered its first
important ruling on racially segregated schools outside the South, but it also recognized the
right of Latino children to desegregated education (Pettigrew, 2004). These Court decisions
provided a “brief window when the nation belatedly began to live up to its Constitutional
promises to its Black citizens” (Pettigrew, 2004, p. 523).
Resegregation
One year after Keyes, the Court abruptly reversed the course of it pro-desegregation
decisions. Pettigrew (2004) discusses how Milliken v. Bradley (1974) compares with Dred
Scott and Plessy as one of the Supreme Court's most destructive rulings in the nation’s racial history, though, like Plessy, it initially received little recognition. In Milliken, the Court
segregation of Detroit's public schools. In the following passage, Pettigrew (2004) continues
by detailing the impact of this critical decision:
What makes this decision so regressive is that such remedies are the only means available to desegregate the public schools of many of the nation's largest cities (Orfield & Eaton, 1996; Pettigrew, 1975, 1981). Moreover, between-district segregation is now by far the major component today in metropolitan school
segregation (Clotfelter, 2004, p. 120). This harsh reality was fully understood at the time. By ignoring this reality, the Court gave its blessing to having the boundaries between largely minority central cities and White suburbs act as racial Berlin Walls. But the Berlin Wall came down in 1989 and united Germany. These Berlin Walls, bolstered by continued racial discrimination in housing, have only grown stronger and divided America. (p. 523)
The Court further ruled in Milliken v. Bradley II (1977) that states could be ordered to
pay for remedial programs that were presumed to repair the harm that decades of segregation
had inflicted. The Milliken decisions, therefore, abandoned Brown’s premise that separate is
inherently unequal, opting for special financing for a limited time for unproven programs as a
substitute (Pettigrew, 2004).
Supreme Court decisions continued to support Milliken’s logic, including Riddick v.
School Board of the City of Norfolk, Virginia (1986). Verdicts rendered under the leadership of President Ronald Reagan’s appointee, Chief Justice William Rehnquist, strengthened the
movement by turning the tides towards resegregation. Several notable cases include Freeman
v. Pitts (1992) and Missouri v. Jenkins (1995) which both greatly limited desegregation efforts by lifting enforcement methods. Most recently, in Zelman v. Simmons-Harris (2002),
the Court sent another strong message indicating a reversal of Brown by allowing public
monies to go to private and suburban schools through vouchers. Pettigrew (2004) highlights
the impact of this decision by pointing out that:
Apart from separation of church and state issues, the five jurists showed no concern that these private schools would remain selective in their student bodies, be
unlikely coalitions support school vouchers, with some inner-city Blacks joining pro-segregationist Whites. But all this signifies is the desperation of some Black parents whose children are trapped in deteriorating ghetto schools because the Brown promise of integration has been eliminated by the High Court . . . Never has the Court's
majority admitted that it is in effect overturning Brown. Instead, they talk of favoring local authority over court control and focus on remedial compensation in segregated settings. This obfuscation is consistent with the findings of social psychology. The central characteristic of modern prejudice is its use of ostensibly nonracial reasons for anti-Black attitudes and actions (Gaertner & Dovidio, 2000). Such attitudes are typically denied—even to one’s self. Instead, socially acceptable reasons are advanced to justify the action. (p. 524)
Pettigrew (2004) continues with a detailed account of how this swift change in the
Court occurred. He further stipulates, “In short, Brown has been largely reversed. The
[political impact of the appointment of the] law clerk [Rehnquist], who in 1954 supported
Plessy, as chief justice, [coupled with other lifetime appointments] revived segregated education” (p. 524). While the 1990s recorded an accelerated retreat in racial desegregation
of the public schools, by 2000, African American children were more likely to be attending
majority-Black schools than at any time since the 1960s; 70 percent went to predominantly
Black schools, and 37 percent to schools with 90 percent or more Black students. The
greatest retrogression during the 1990s occurred in the South, the region that had previously
witnessed the greatest gains (Orfield & Lee, 2004, 2005). Orfield and Lee (2005) illustrate
these regional differences as African Americans (and Latinos) are finding themselves in more
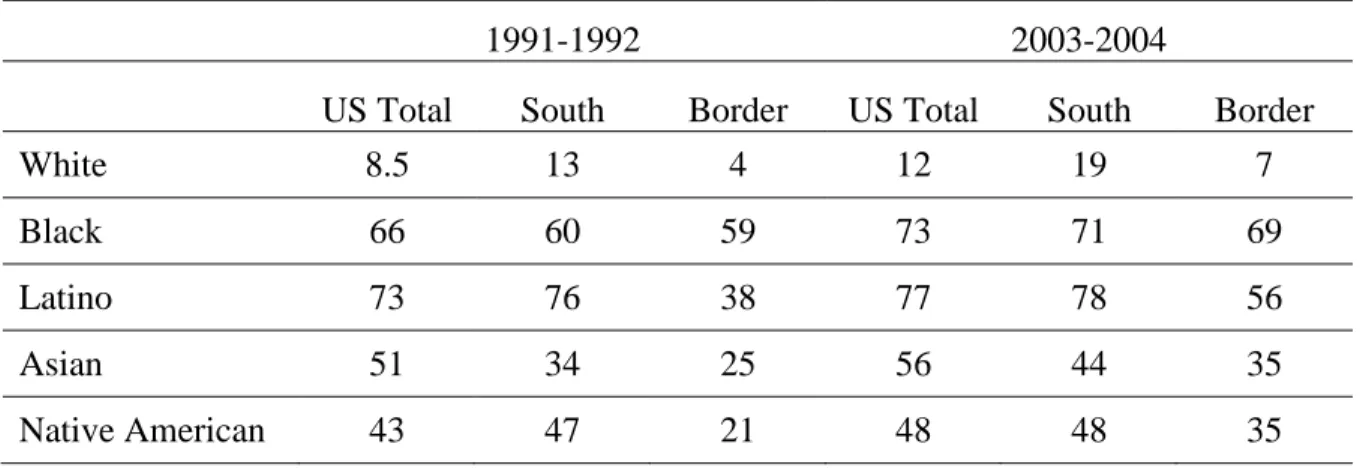
segregated environments during the school day (see Table 2.2).
In addition to combating misconceptions that largely led to these resegregation trends,
Pettigrew (2004) captures the importance of these trends by detailing studies from numerous
researchers indicating that African American students from desegregated schools are more
likely to attend and complete courses of study at predominately White colleges; have better
incomes; and experience relationships that enable them (and their White counterparts) to
have more positive attitudes towards other races.
Table 2.2. Percentage of Students in 50-100 Percent Minority Schools in the South and Border States by Race, 2003-04
1991-1992 2003-2004
US Total South Border US Total South Border
White 8.5 13 4 12 19 7
Black 66 60 59 73 71 69
Latino 73 76 38 77 78 56
Asian 51 34 25 56 44 35
Native American 43 47 21 48 48 35
The Rise of Accountability
In the wake of the dismantling of the Supreme Court’s support of Brown, global
competition, and the release of A Nation at Risk: The Imperative for Education Reform
(1983), increased accountability efforts became the focus of reform efforts aimed at closing
the gap. Brown (2006) asserts:
To succeed as a nation and be competitive in the global marketplace, the United States must have diversity and equality of participation within its society in general, and within its educational system in particular, if the dream of one nation, indivisible, is to be realized. (p. 325)
It is yet to be realized whether the rise in accountability will launch the nation towards
greater equalization of opportunity. Do accountability efforts that vehemently exert the
language of equality help bridge the gap or reinforce the divide?
No Child Left Behind (NCLB)
Wherein Brown vs. Board of Education provided access to “equal” classrooms, No
those classrooms. Created in 2001 as the latest revision to the Elementary and Secondary
Education Act (ESEA), NCLB’s purpose is to ensure that all children in America are able to
meet the learning standards of the federal government and the state where they live. NCLB is
built on four key principles: accountability for results, flexibility and local control, enhanced
parental choice, and instruction based on scientific research (Sattes & Walsh, 2002). NCLB
substantially increases the testing requirements for states and sets a more rigorous
accountability standard for schools within each state, with the use of yearly progress
objectives for all students and subgroups of students. These subgroups include those of lower
socioeconomic background, race and ethnicity, limited English language proficiency, and
students with disabilities. The goal of NCLB is to provide a valid set of requirements for the
accountability and performance of all students which are directly related to positive
expectations set by teachers and schools. The NCLB Act initially required that states put new
testing and accountability systems into place.
The requirements of NCLB also have implications for all educators and educational
researchers who focus on K-12 education. These implications are derived from the legal
requirements that schools demonstrate steady gains in student achievement and close the gap
between various subgroups of students by 2013-2014. Yet, Anderson et al. (2007) highlight
the following cautions when considering the ability of NCLB to be the driving force behind
closing the gap:
1. Schools closing the gap are not necessarily the highest-performing schools; 2. Schools closing the gap are not necessarily making AYP;
3. Schools making AYP are not necessarily closing the achievement gap; and 4. Comparisons across states are inappropriate. (p. 550)
With all of these issues in reporting and evaluation, it is difficult to gauge the degree
of tracking our “education debt.” Yet, the inability of schools to adequately achieve a certain
improvement status results in a mandatory offering to parents the option for their children to
either attend a better performing public school within the district or to be provided with
supplemental educational services at the schools’ expense. One would have to question the
degree to which African American parents, mostly from economically disadvantaged
households, have the cultural capital and realistic scenarios that truly make these options as
widely available to them. Additionally, as an unfunded mandate, there is tremendous
controversy regarding NCLB’s ability to achieve its goals without additional funding. Such
inquiry has led to court action in many states, such as the Leandro case, which is discussed
later in this review.
The North Carolina Accountability Program
The ABCs of Public Education is North Carolina’s primary school improvement
program with the goals of providing strong local school accountability and exhibiting
mastery of basic subjects. The program became law in 1995 and has been modified and
improved to supposedly better portray school performance and to ensure that its measures are
as fair and accurate as possible. Formulas are used to measure the academic growth and
achievement for all schools. The system is primarily based on the increase in the average
score of a group of matched students in two successive years, with minor statistical
adjustments. Both growth and proficiency performance are recognized under the ABCs.
Schools are rewarded based on growth in student achievement and school assistance teams
are assigned to the lowest performing schools. Monetary rewards are also provided to high
performing or improving schools. In November of 2005, Secretary of Education Margaret
to determine if their schools and districts are meeting No Child Left Behind performance
targets. North Carolina is one of two states whose proposed growth model was accepted by
the U. S. Department of Education. Even with the controversy surrounding testing, the state
continues to be a model within the United States.
Leandro
In 2002, Judge Howard Manning issued his fourth ruling in the Leandro decision, the
lawsuit contesting how the state funds public schools. Previously, Manning ruled that North
Carolina was not meeting its obligation to provide a sound, basic education to at-risk
children. In this ruling, Manning said that classrooms must have a competent, certified, and
well-trained teachers coupled with competent school leadership and the necessary resources.
Manning placed responsibility upon the state to ensure that the constitutional guarantee is
met with aggressive intervention, if necessary.
The ruling also encouraged more resources and support services for rural schools with
high numbers of at-risk students. North Carolina lawmakers responded by creating the
Disadvantaged Student Supplemental Fund (DSSF). In 2004 and 2005, sixteen rural school
districts received DSSF money due to their status in the Leandro case. In 2006, the General
Assembly decided to give DSSF money to all 115 school districts. In an effort to utilize a
type of equity formula, the original districts received $22.5 million (the same allocation they
got in 2005) and the other 99 districts split $27 million. In 2006-2007, the original districts
received between $732 and $1046 per disadvantaged student, and the other districts received
only between $55 and $175 per disadvantaged student.
Though these attempts by the state to address equity issues are admirable, Judge
quick fix to longstanding issues. During a December 2004 hearing, Judge Manning
specifically used a school system with the fourth highest per pupil spending rate in the state
to reiterate his point. After commenting favorably on elementary and middle school
performance for the 2003-2004 school year, he expressed disappointment in the high school
performance, indicating that 69 percent of North Carolina’s high schools had composite
scores below 80 percent. Citing the one school district, Manning stipulated that ten out of
fifteen high schools had composite scores below 70 percent, yet they have more than
adequate per pupil spending. In 2004, Judge Manning targeted 44 high schools (since
reduced to 35) having performance composites less than 60 percent. While admitting that
these targeted schools (and the districts housing them) have obviously challenging student
populations, with high free and reduced lunch and diverse student percentages, Judge
Manning accepted no excuses. The comparison of schools with such diverse populations only
capitalizes the issue at the foundation of the Leandro case--whether the “problems” with
public education in North Carolina (and the entire nation) result from a lack of money or
poor use of existing funds. A closer comparison of the individual schools within the districts
also brings to the forefront questions of equity. In the spirit of Brown vs. Board of Education
and the premise of NCLB, one must question how much of the “high school problem” is an
issue of socioeconomic status and—first and foremost—race.
In response to Judge Manning’s questions regarding the connection between
resources and student success, Governor Mike Easley commissioned the UNC-Chapel Hill
School of Education to work with the State Board of Education and the NC Department of
Public Instruction in an effort to conduct audits of high schools in all North Carolina school
schools. The analysis included teacher backgrounds and spending patterns to determine if
there were significant differences between the higher-performing and “High Priority”
schools.
In the qualitative phase of the research, interviews were conducted at identified “High
Priority” and higher-performing high schools to determine the use of resources and how they
deal with the barriers to success. This study focuses on the comparisons between the BTO
and HP high schools. It should be noted that North Carolina has no high-performing high
schools that can be easily compared with BTO or HP high schools due to dramatically
different populations. The interview protocol for the qualitative piece of the study related to
specific focus areas, including (a) Goal Setting and Communication of Goals; (b)
Coordination of Curriculum and Instruction; (c) Teacher Recruitment, Assignment and
Retention; (d) Supervision and Evaluation of Instruction; (e) Monitoring Student Progress
and Providing Incentives for Learning; and (f) Promoting Professional Development and
Building Community. The focus areas were based on Hallinger and Murphy’s (1985)
PrincipalInstructional Management Rating Scale, which details fifty identified behaviors of
effectiveschools.
Evidence from Successful Schools
Several notable studies have been conducted to determine what practices have
contributed to the success of schools with diverse populations in improving student
performance on standardized tests and closing the “achievement gap.” This review
Gaining Traction, Gaining Ground: How Some High Schools Accelerate Learning for
Struggling Students
This study conducted by Education Trust (2005a) studied identified “high-impact”
schools that exhibited statistically significant achievement growth among lower performing
students. Additionally, four identified “high impact” schools were compared to three
identified “average-impact” schools. For the purposes of the study, “high-impact” schools
were defined as those with (a) “greater than expected” growth over three years; (b) at least
average performance on state assessments in reading or math; (c) smaller than average
achievement gaps; (d) a Promoting Power Index at or above the state average, as defined by
John Hopkins University’s instrument for approximating graduation rates; and (e) 60 percent
or greater low-income student population or 50 percent or greater non-White population
coupled with 20 to 60 percent low-income population. The average-impact schools also had
comparable demographics. In addition to site visits, classroom observations, administrator,
teacher and student surveys, data (i.e. transcripts, schedules, assignments) were collected
over the course of a year. The study team also conducted teacher and student focus groups.
Three of the four high-impact high schools are located in North Carolina. The practices at the
two types of high schools were compared and the results were published based on five
spheres, including culture, academic core, support, teachers, time and other resources
(Education Trust, 2005a). In every sphere studied, the researchers found significant
differences in key practices of “high-impact” and “average-impact” high schools and how
they operate. Yet, the study is careful to note that there is still a need for implement more