Longitudinal Analysis of Adolescent Girls' Activity Patterns:
Understanding the Influence of the Transition to Licensure
Noreen C. McDonald, Louis Merlin, Haoting Hu, Joshu Shih, Deborah A. Cohen, Kelly R. Evenson, Thomas L. McKenzie, and Daniel A. Rodriguez
Abstract
The proportion of teens and young adults with driver's licenses has declined sharply in many industrialized countries including the United States. Explanations for this decline have ranged from the introduction of graduated driver licensing programs to the increase in online social interaction. We used a longitudinal cohort study of teenage girls in San Diego and Minneapolis to evaluate factors associated with licensure and whether teens' travel patterns become more independent as they aged. We found that licensure depended not only on age, but on race and ethnicity as well as variables that correlate with household income. Results also showed evidence that teen travel became more independent as teen's age, and that acquiring a license is an important part of this increased independence. However, we found limited evidence that teen's travel-activity patterns changed as a result of acquiring a driver's license. Rather, teen independence resulted in less parental chauffeuring, but little shift in travel patterns. For the larger debate on declining Millennial mobility, our results suggest the need for more nuanced attention to variation across demographic groups and consideration of the equity implications if declines in travel and licensure are concentrated in low-income and minority populations.
Introduction
American teens today are less likely to have driver's licenses than teens 20 to 30 years ago (Sivak & Schoettle 2011; Shults & Williams 2013). Nearly 70% of 17 year olds were licensed drivers in 1983, but by 2010 the proportion was 50% (Sivak & Schoettle 2012b). Because the acquisition of a driver's license has traditionally been portrayed as the final step in achieving travel independence and, particularly in the United States, been considered an important rite of passage (Kent 2014; Clifton 2003), there are important questions about how travel patterns will be impacted by decreases in licensure. Some authors have suggested that decreased licensure is linked to decreased driving among the millennial generation (defined as those born in 1980 or later) (Blumenberg et al. 2012; Kuhnimhof et al. 2012). Other analysts have contended that the decreases in licensure reflect delayed employment, marriage, and parenthood, not a radical re-thinking of mobility preferences by Millennials (Ministry of Infrastructure and the Environment 2014; Delbosc & Currie 2014).
To address this issue, we utilized a unique panel study of teenage girls in Minneapolis and San Diego to understand what factors predicted licensure and how licensure affected teens' travel patterns. Our analysis focused on three travel behavior metrics: licensure, mobility,
HHS Public Access
Author manuscript
J Transp Land Use
. Author manuscript; available in PMC 2017 April 28.Published in final edited form as:
J Transp Land Use. 2016 ; 9(2): 67–86. doi:10.5198/jtlu.2015.652.
A
uthor Man
uscr
ipt
A
uthor Man
uscr
ipt
A
uthor Man
uscr
ipt
A
uthor Man
uscr
activity space. Independence was measured through the percentage of trips that were taken independent of adult supervision. In short, we found that low-income and Latina girls were less likely to acquire licenses, but that license acquisition did not change the spatial extent of where teens traveled or activity participation. However, licensed teens became substantially less reliant on parents for their mobility needs thereby reducing the chauffeuring burden on parents. The remainder of the article provides more background on teens and mobility, a detailed description of our methods and analysis, and a discussion of how these results connect to practical and theoretical concerns.
Background
Analysis of teen travel links literature on licensure and independent mobility. The first part of this section provides an overview of trends in licensure combined with explorations of why licensure has declined in the United States. The second half of this section provides background on conceptualizations of independent mobility for youth and empirical data on patterns of independent travel in developed countries. Across both these literatures, the role of gender is highlighted.
Licensure
Shults and Williams (2013) found the proportion of United States high school seniors with licenses declined by 12 percentage points from 1996 to 2010 and that the majority of the decline occurred from 2006 to 2010. Sivak and Schoettle (2012b) also found sharp declines in teen licensure. Nearly 70% of 17 year olds were licensed drivers in 1983, but in 2010 less than 50% were. Historically, men have higher rates of licensure than women, but the gender gap has narrowed significantly over time and perhaps even reversed. Sivak and Schoettle (2012a) showed that in 2010 females under 35 had higher rates of licensure than males using national data from the Federal Highway Administration and the US Census Bureau.
The reasons for the licensure decline have been much debated (Delbosc & Currie 2013). First, there have been large institutional changes in state licensing regulations in recent decades. All 50 states have implemented Graduated Driver Licensing (GDL) laws which limit young drivers' exposure to high-risk situations such as night driving and driving with teen passengers (Master, Foss & Marshall 2011; McCartt et al. 2010). In practice, this may have increased the time required for teens to acquire a full license and reduced the utility of having a license.
However, there is an increasing consensus among researchers that the introduction of GDL does not fully explain the decline in licensure among teens. Instead these researchers point to the economic costs of licensure and auto ownership as well as satisfaction with modal alternatives to the car as explanations for decreasing licensure. In a survey of unlicensed 18 year olds, Williams (2011) found the reasons these individuals gave for not starting the process included no car available (55%), can get where wanted without driving (36%), busy with other activities (33%), costs too much (30%), parents too busy to supervise (27%), and licensing requirements a hassle (24%). A separate survey of unlicensed 18 and 19 year olds reported comparable results and found the reasons reported for not being licensed were too busy or not enough time (57%), able to get transportation from others (40%), owning and
A
uthor Man
uscr
ipt
A
uthor Man
uscr
ipt
A
uthor Man
uscr
ipt
A
uthor Man
uscr
maintaining a vehicle is too expensive (30%), prefer to walk or bike (24%), and prefer to use public transit (10%) (Schoettle & Sivak 2014).
Popular articles on licensure decline have speculated that the trend indicates the desire of today's youth to live in more urban locales and rely on transit, foot, and bicycles for mobility (Thompson & Weissmann 2012). In other words, much of the decline is ascribed to
changing housing and travel preferences among millennials. However, analyses of licensing patterns suggest that white, wealthier teens still obtain driver's licenses at high rates. Tefft et al. (2014) found 69% of 18 to 20 year olds from households with yearly incomes under $20,000 had a license or learner's permit while 95% did in households with yearly incomes over $100,000. Sharp variations by racial and ethnic background were also observed with 89% of Hispanic whites having a license or permit compared with 78% for
non-Hispanic blacks and 71% for non-Hispanics (Tefft, Williams & Grabowski 2014). Similarly teens from lower-density areas have higher rates of licensure (McDonald & Trowbridge 2009). These results suggest that lower levels of licensure appear to be explained by
socio-economic factors more than a shift in preferences. Furthermore, they raise concerns that low levels of licensure, particularly among minority and low-income groups, could lead to social exclusion through an inability to reach destinations and activities (Lucas 2012).
Mobility
While there have been large changes in licensure among teens, mobility patterns of this group have been stable in North America. Person miles of travel were constant between 1990 and 2009, with teens traveling about 20 miles per day (Blumenberg et al. 2012, p. 40). Autos accounted for nearly 70% of these miles in 2001 and 2009 (Blumenberg et al. 2012, p. 40). Trend data from Toronto, Canada showed similar patterns to the United States. While licensure declined between 1986 and 2006, teens did not decrease their reliance on autos; instead, they were less likely to drive themselves and more likely to be passengers (Marzoughi 2011).
Despite the stability in the amount of travel across time, the teenage years are a time of transition in how youth travel. The process of acquiring independent mobility has been framed as the acquisition of travel `licenses' that slowly give the child the ability to explore their environment without adult supervision (Hillman, Adams & Whitelegg 1990). Studies have shown that children's independent territorial range increases with age, particularly around ten to twelve years (Hart 1979; Matthews 1992). Younger teens begin to use transit as well as walking and bicycling to explore their communities without adult supervision while older teens drive themselves and their friends (Clifton 2003; Weston 2006). Recent work has documented low levels of travel freedom for children as well as declines over time (Carver et al. 2014; O'Brien et al. 2000; Shaw et al. 2013).
Important variation in independent mobility has been observed across demographic and spatial groups. A key finding has been that boys have more and earlier travel freedom than girls (Hillman, Adams & Whitelegg 1990; Hart 1979; Matthews 1992; O'Brien et al. 2000; Mitra et al. 2014). The literature suggests that the gap in travel freedom may be narrowing as parents express equal concern about the safety of boys in the public realm and that the gap changes with age (Valentine 1997). Brown et al (2008) showed that girls aged 11 to 12 in an
A
uthor Man
uscr
ipt
A
uthor Man
uscr
ipt
A
uthor Man
uscr
ipt
A
uthor Man
uscr
inner London suburb were allowed to do more than boys because parents believed it was important for girls to develop their independence despite parental safety concerns. That study also raised intriguing questions about whether metrics of independence may in fact have a gendered dimension themselves by failing to acknowledge girls' tendency to negotiate public spaces in groups and use of alternative public spaces such as malls for their
socializing (Brown et al. 2008).
While age and sex are key factors for understanding travel freedom, research also indicates that independent mobility varies with other variables including parental work and travel behavior, household income, location in region, race, and ethnicity (Mitra et al. 2014). For this analysis, the dimensions of space and race are particularly important and will be highlighted. Many studies have shown that children in low to moderate density locations often have the highest levels of independent mobility. O'Brien et al (2000) showed that children in a British new towns had the highest levels of independent mobility compared with children in inner and outer London. Kyttä (2004) found mobility levels highest in Finnish rural villages and lowest in Finnish cities. However, her work showed that all Finnish environments had higher levels of independence than comparable environments in Belarus highlighting how context-specific these patterns can be. For older children, analyses in the United States have shown that teens drive more in less dense, more sprawling
environments (Trowbridge & McDonald 2008)
Transnational research shows that minority children have more restricted travel freedom, though explanations for the restrictions are context-dependent and relatively limited. O'Brien et al (2000) showed that older Muslim Asian girls were largely absent from the urban realm; Mitra et al (2014) found lower levels of independence for children that did not speak English or French at home and concluded that more research was needed to understand links
between travel independence and ethnicity and race.
Summary
For many teens the acquisition of a driver's license represents the final step in the transition to independent mobility. The existing literature has documented a decline in teen licensure but provides few insights into how that decline will impact teens' mobility patterns. The remainder of the article will address this understudied topic by studying teenage girls in Minneapolis and San Diego over time to assess the factors affecting licensure and identify how licensure affects travel behavior.
Data and Methods
Teenage girls from San Diego (N=153) and Minneapolis (n=150) that were participants in the Trial of Activity for Adolescent Girls (TAAG) study completed 7-day activity diaries at two time points during high school (Stevens et al. 2005). From these data, we examined their licensure status, mobility, and independent travel undertaken without adults. The girls were
selected to participate in the study because they were part of the TAAG study as 8th graders.
Participants were recruited through their schools which included four high schools each in San Diego and Minneapolis.
A
uthor Man
uscr
ipt
A
uthor Man
uscr
ipt
A
uthor Man
uscr
ipt
A
uthor Man
uscr
After receiving parental consent and student assent, participants were asked to report their activities over a 7-day period in two waves approximately one year apart. The surveys were
conducted in 2008 and 2010; half the girls were surveyed as 10th graders with a follow-up in
11th grade; the remainder were surveyed in 11th grade with a follow up as 12th graders.
Participants provided three types of information at each wave of data collection: a
sociodemographic and attitudinal survey, a 7-day activity diary, and 7-days of GPS tracking. Rodriguez, et al. (2012) provide further information on data collection methods for each of the three types of data. Recruitment and data collection protocols were approved by human subjects review boards at RAND, San Diego State University, and University of Minnesota.
On the diary, respondents recorded where they went, the travel mode used to reach the location, and the activity they engaged in while there. These activities included eating, shopping, recreation, or visiting friend or relative. For in-home activities, girls identified home as a destination, but did not provide details about the specific activities done there. For home and school, the location was available from respondent surveys. For all other activity types, geocoding the activity location required data cleaning of the activity diaries. When respondents provided a partial address or location description, researchers determined the street address using online maps based on self-reported information in the diary. The resulting addresses were then geocoded. When no location information was provided or a specific address could not be determined, we inferred the location from the GPS data by matching the reported activity time with GPS records. Inferred GPS locations were utilized if the GPS timestamp was between the start and end of the reported activity or within 5 minutes of the activity start or end time. These thresholds, designed to minimize incorrect matches, were chosen through testing with a set of known locations. Between 1% and 4% of activities were geocoded using this approach (Table 1); and between 3% and 5% of activities were not geocoded because an address could not be determined and there was no appropriate GPS match (Table 1). For each study site and survey wave, researchers were able to geocode between 91% to 95% of total reported activities.
Metrics of Activities & Activity Space
Researchers have measured human activity spaces for various purposes: to understand individuals' knowledge of the urban environment, to understand the probability distribution of future locations for activity choices, and to understand individual mobility or use of urban space (Horton & Reynolds 1971; Newsome, Walcott & Smith 1998; Schönfelder &
Axhausen 2003). Buliung, Roorda, Remmel (2008) provide a detailed overview of conceptualizations and measurement of activity patterns. The goal of our study is to understand the regular patterns in the adolescents' use of urban space as a measure of their mobility. By considering the spatial extent of activity spaces combined with metrics of independence and number of trips, we can explore how licensure influences personal mobility.
The size of the activity space has been measured a variety of ways, including ellipses, kernel densities, minimum spanning paths, minimum convex polygons and second moments. Each of these measures has its particular benefits and drawbacks. Ellipses provide a spatial representation of the locations within which regular activity patterns occur (Schönfelder &
A
uthor Man
uscr
ipt
A
uthor Man
uscr
ipt
A
uthor Man
uscr
ipt
A
uthor Man
uscr
Axhausen 2004). Such ellipses intentionally exclude outliers, as these may include
irregularly visited locations. However ellipses may nonetheless overestimate the size activity spaces due to their presumed functional form (Rai et al. 2007). Kernel densities provide a more spatially detailed picture of activity intensity. However kernel densities require large activity data sets and may omit areas of activity opportunity between known activity locations (Schönfelder & Axhausen 2004). Minimum spanning paths identify the travel paths or transportation networks with which individuals are familiar. However these assume that the shortest travel paths are true travel paths, which may not be the case. Minimum convex polygons contain the entire observed activity space for an individual, however they do not differentiate with regard to the regularity or intensity of activity within that space. Second moments provide a simple, mathematical descriptions of activity space locations and geographic size, but have not been widely adopted (Susilo & Kitamura 2005).
We chose ellipses as our primary measure of the use of urban space because these best represent the sampled nature of the available activity-travel data. This data captures a slice of five to thirteen days for each teen and therefore is not a comprehensive picture of their spatial activity patterns. Past longitudinal studies suggest that there is some regularity in the weekday activity patterns of workers and students, while there are high levels of irregularity for their weekend patterns (Susilo & Kitamura 2005; Schlich et al. 2004; Srivastava & Schönfelder 2003). This regularity of weekday travel patterns suggests that a 1-week sample of activity–travel behavior may offer a reasonable approximation of an individual's regular weekday activity space. In addition the number of non-home, non-school activities provides a second and complementary measure of adolescent mobility. Because of this, our analysis used weekday activities to compile metrics of activity and travel patterns.
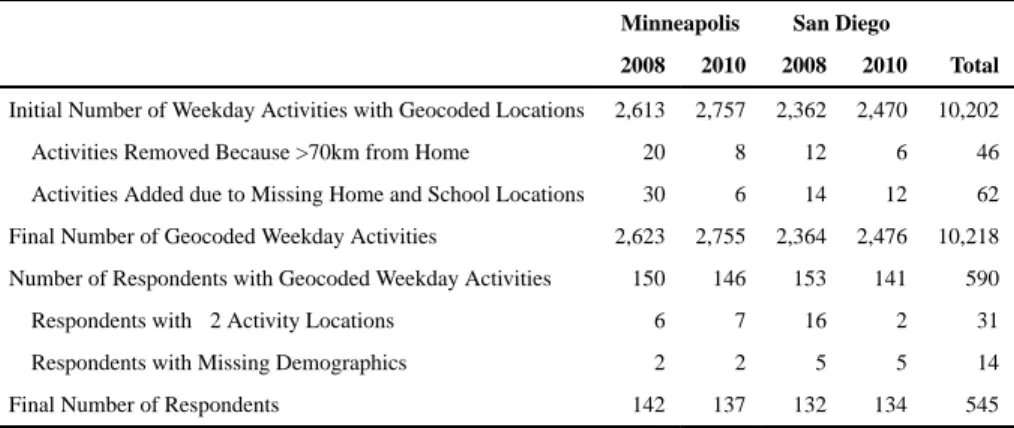
We utilized the R libraries aspace and vmstools to calculate activity space metrics (Buliung & Remmel 2008; Hintzen et al. 2012). For this analysis, we focused on weekday activities within 70 km of home, rather than one-time trips to distant locations which might have extreme impacts on activity space metrics. Because of this, we excluded any activity that occurred more than 70km from the respondent's home and was outside the region (Table 2a). In San Diego, this excluded 18 (0.4%) activities and in Minneapolis, 28 (0.5%) activities were excluded. We checked to ensure respondents reported home and school as activity destinations in activity diaries, and manually added them if they did not. A few respondents did not report many activities; those reporting two or fewer activities were dropped from the analysis because the space metrics cannot be computed without at least 3 distinct activity locations (Table 2). In San Diego, 121 girls had activity space metrics in 2008 and 2010; 24 girls had these metrics in only one year. In Minneapolis, 132 girls had activity metrics for both years and 15 girls had it only for one year.
The final analysis sample included girls with missing activity location information. On average, each girl had missing location information for 4.9% of activities. To examine the effect of missing data, we divided participants into two groups, those with <15% missing data (N=492) and those with ≥15% missing data (N=53). We found no significant difference in the average size of the activity space (p=.42 in San Diego; p=.36 in Minneapolis) and assumed that those locations with missing information were distributed at random spatially. Therefore we included individuals with some missing activity locations in the analyses.
A
uthor Man
uscr
ipt
A
uthor Man
uscr
ipt
A
uthor Man
uscr
ipt
A
uthor Man
uscr
Independent and Dependent Travel
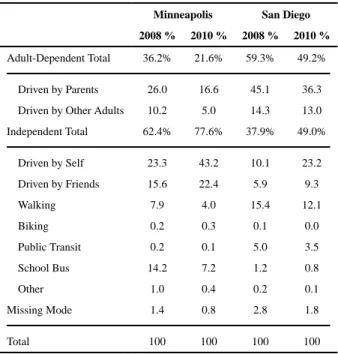
The activity diary captured information on the travel mode used to reach destinations. We categorized the mode as `adult dependent' (being driven by parents or other adult) or `independent' (e.g., teens driving themselves, driving with friends, walking, biking, skateboarding, taking public transit school bus). Our primary measure of the independence of teen mobility was the proportion of all activities reached by adult-dependent travel modes. For the non-auto modes, we did not know whether parents accompanied the respondents, however, we assumed that most of these trips were taken without adult supervision. For the auto modes, teens explicitly reported who was the driver. Most travel was by automobile, with parents driving teens for 40 to 60% of auto trips (Table 3).
Sociodemographic Information
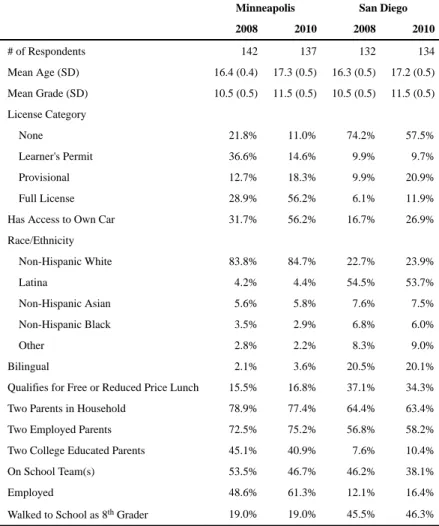
On the surveys, the girls identified their age, grade, parental employment and education, access to household vehicles, licensure, employment, participation in school sport teams, race and ethnicity, participation in the free or reduced price lunch program, and language abilities. Some responses changed over time (e.g., age, grade, licensure) while others were stable (e.g., race/ethnicity, parental education). Sociodemographic characteristics differed between San Diego and Minneapolis. (Table 4). In San Diego, over half the girls identified themselves as Latina compared with four percent in Minneapolis. Parental education and girls' driver licensure were higher in Minneapolis, while participation in the federal free lunch program was lower. We also included information from the original TAAG study on
whether the girl had walked to school when she was in 8th grade (Saksvig et al. 2007).
Both California and Minnesota had graduated driving laws in place as of January 1, 2008 (California Vehicle Code; Minnesota Statutes 2013). These laws require drivers under the age of 18 to go through two stages before receiving full drivers' licenses or their equivalent. In the first stage, teens may quality for an instructional-only permit after receiving sufficient classroom instruction on driving laws. They may use their instructional permit only for practicing driving while under supervision of an older, licensed adult. After holding an instructional permit for at least six months and logging sufficient hours of supervised driving, teens may apply for a provisional license which requires a road test. Teens who have obtained their provisional license may drive without supervision, but have other restrictions such as not being allowed to have teenage passengers or drive during late night hours. These restrictions vary slightly by state. Once teens reach the age of 18, or once they drive for 1 year without a significant traffic violation, they may qualify for a full license. The licensing rules in California were slightly stricter. California required 50 hours of supervised driving before applying for a provisional license, whereas Minneapolis required 30. Also in Minneapolis teens with a provisional license were allowed to transport one other teenager from outside their family, whereas in California provisional license holders are in general not allowed to transport any persons under 20 years of age (California Vehicle Code; Minnesota Statutes 2013). The survey question on licensure asks teens whether they have a driver's license “without driving restrictions” or a provisional driver's license “with driving restrictions” or a learner's permit or no license at all. These four were the only permitted answers.
A
uthor Man
uscr
ipt
A
uthor Man
uscr
ipt
A
uthor Man
uscr
ipt
A
uthor Man
uscr
Built Environment Metrics
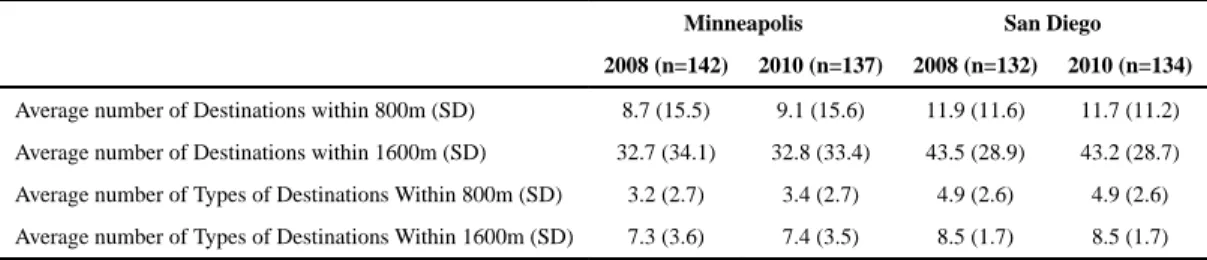
Objective measures of the built environment focused on access to destinations and were computed using ArcView (McCormack, Giles-Corti & Bulsara 2008). We measured the number of common destinations within 800 and 1600m (straight-line) of respondents' residences using a geocoded 2010 data set from Reference USA. Some previous studies have shown reasonable concordance between Reference USA-reported locations and primary assessments (Fleischhacker et al. 2013), while others have identified error in secondary sources (Han et al. 2012; Hoehner & Schootman 2010). These distances are intended to reflect the convenience and attractiveness of non-motorized travel options. We developed two categories of built environment metrics. The first was the count of all destinations within the specified buffer. The second was the number of types of destinations within the specified buffer. There were 14 destination types including: restaurants/food outlets, post offices, stadiums, museums, cinemas, liquor stores, libraries and bookstores, supermarkets, convenience stores, other retail outlets, shopping centers and malls,
amusement parks, and recreation facilities. A small number of participants moved between the two survey waves and therefore the built environment variables for these girls changed over time. San Diego respondents had more destinations close to home than Minneapolis respondents (Table 5).
Analyses
Our analyses focused on identifying demographic and environmental differences in licensure and travel patterns and assessing how acquiring a driver's license impacted travel behavior. To develop models, we used a socioecological framework which acknowledged multiple influences on behavior from the proximate, e.g. individual and household factors, to the distal, e.g. built environment (Bronfenbrenner 1979).
We analyzed licensure by conducting binary logit regressions on teen's licensure status at their latest survey date. Teens were considered licensed if they held either a provisional or a full driver's license, but not if they held a learner's permit. All teens with licenses in 2008 continued to have them in 2010, so most of our data is from the second wave. However, 13 teens of age 16 or older who completed surveys in 2008 were not present in the 2010 sample. Only teens 16 and over, the age required to have a provisional license, were included in the analysis. The logit models utilized pooled data from Minneapolis and San Diego. Because reported coefficients in logit models are scaled based on the variance of the unobserved factors, we were concerned that unequal variation between San Diego and Minneapolis could account for differences in model coefficients. Because of this, our initial models allowed for differences in scale parameters between the two locations, but the results did not reject the null hypothesis of equal scale factors (p=.11).
The regression models examined the influence of sociodemographic and built environment variables on teen licensure status. Early-stage models allowed coefficients to vary between Minneapolis and San Diego through inclusion of an interaction term between location and each variable. If there was no evidence of a statistically significant difference in the coefficients between the two regions (as evidenced by the significance of the interaction term), we constrained the coefficients for the two regions to be equal in the final models.
A
uthor Man
uscr
ipt
A
uthor Man
uscr
ipt
A
uthor Man
uscr
ipt
A
uthor Man
uscr
Due to collinearity, we included only one objective metric of the local built environment -- the number of destinations within 800m of the respondents' house. A buffer of 800m was selected because model fits were modestly improved over the 1600m buffer. Model fit and significance patterns were similar for models estimated using the number of destinations or the mix of destination types; we show results from models with the number of destinations within 800m.
Our analysis of mobility and travel independence relied on three measures -- area of standard deviation ellipses, number of activities per day, and the proportion of activities reached using adult-dependent travel modes. These metrics measured the spatial and modal patterns in the adolescents' activities and provided insights into how these patterns evolved
over time. We modeled each outcome, yit, for girl i at time t as a function of time-variant
variables, Xit, and observed time-invariant factors, Zi,, and unobserved individual-level
heterogeneity, ci, using unbalanced panel data (Equation 1). The time-variant factors, Xit,
included grade, driver's license status, access to household vehicles, and employment. These variables changed over time for at least some proportion of the sample.
(1)
We estimated random-effects panel models. The random-effects model assumed that
unobserved individual level factors, ci, were uncorrelated with all observed factors, Xit and
Zi. This assumption allowed for inclusion of individual-level factors that did not change over
time such as race and ethnicity. The strength of the longitudinal research design is that we are able to separate the effects of age from the impact of becoming a driver while controlling for individual-level differences.
To increase power, we analyzed the San Diego and Minneapolis samples together and allowed for regional variation through the inclusion of a regional dummy variable and interaction terms with sociodemographic variables. Initial models included interaction terms for all sociodemographic variables. However if the interaction terms were uniformly not significant in the three models of mobility, they were not included in the final reported models. In the end, interaction terms were between region and race/ethnicity and teen employment were included. As with the analysis of licensure, it was impossible to include multiple metrics of the local built environment. For the same reasons given above, the models shown use the number of destinations within 800m.
Results
Descriptive Statistics
Licensure increased rapidly with grade though there were substantial differences between the two study locations. Rates of licensure were consistently higher in Minneapolis, where
nearly 80% of girls were licensed by 12th grade, compared with nearly 40% in San Diego
(Table 6). These differences likely resulted from economic differences across the two study sites – a higher proportion of the girls were eligible for school free or reduced lunches in San
A
uthor Man
uscr
ipt
A
uthor Man
uscr
ipt
A
uthor Man
uscr
ipt
A
uthor Man
uscr
Diego -- but may also reflect some of the small institutional differences in licensing requirements between the states.
Previous literature on licensure has pointed to sharp differences by race and income (Tefft, Williams & Grabowski 2014). In our sample, we observed similar patterns. Students who qualified for free or reduced price lunch (an indicator of economic disadvantage) had much lower licensure rates in both San Diego and Minneapolis (Table 6). Non-Hispanic whites had higher rates of licensure in Minneapolis and San Diego. Patterns among non-whites varied between the cities. In Minneapolis, Asians had rates of licensure nearly identical to whites; other racial and ethnic groups had lower rates of between 40 and 50%. In San Diego, Latinas had the lowest rate of licensure at 14%; Asians and non-Hispanic blacks had approximately the same licensure rate.
Mobility of girls in Minneapolis was higher than in San Diego, as indicated by both more non-school activities per day and larger activity spaces (Table 7). The activity spaces of San
Diego 10th graders were 44% smaller than those in Minneapolis. However, by 12th grade,
the differences in activity space were nearly eliminated, with only a 9% difference. The number of activities outside of school was consistently higher in Minneapolis compared with San Diego. Teens in San Diego made a higher proportion of their trips with adults though in both cities the dependent travel decreased rapidly with age (Table 6). Differences in dependent travel between the two cities may be explained by the higher levels of licensure and vehicle access in Minneapolis than in San Diego (Table 7).
Licensure
The binary logit model of licensure revealed strong associations between licensure, age, household structure, parental education, and ethnicity. Age in months was a statistically significant predictor of licensure (Table 8). Income-related variables, such as having two employed parents and having two parents living in the teen's household, were statistically significant. Latinas were less likely to have driver's licenses in San Diego, but there was no statistically significant effect of race or ethnicity in Minneapolis after controlling for other covariates. Girls that walked to school as eighth graders were less likely to have licenses. This variable could indicate that past experiences with alternative travel options may suppress licensure, but it could also be an income effect if walkers in middle school were lower-income than non-walkers. Similarly, it could also serve as a proxy for the built environment. While objective measures of access to destinations in the local built environment were not significant, it could be that children that walked as eighth graders lived in a more pleasant walking environment, e.g. with adequate sidewalks and street trees. Finally, we also found that students in San Diego that lived farther from school were less likely to be licensed; this effect was not observed in Minneapolis.
Activity Space
Acquiring a driver's license and car access did not have a statistically significant impact on the size of weekday activity spaces meaning that acquiring a license did not affect the geographic extent where girls regularly traveled (Table 9). The factors that were associated with the size of girls' activity spaces were household structure, parental education, racial and
A
uthor Man
uscr
ipt
A
uthor Man
uscr
ipt
A
uthor Man
uscr
ipt
A
uthor Man
uscr
ethnic background, and the built environment. Teens with two college educated parents had larger activity spaces, while those with two parents living in the household had smaller activity spaces. This meant that girls with two parents where one or both were not college-educated had smaller activity spaces than girls from single parent households or households with two, college-educated parents. Variation by race and ethnicity was limited. In
Minneapolis, Latinas had larger activity spaces. However, in San Diego, there was no evidence of any differences in activity space size by race or ethnicity. The built environment was associated with the size of the girls' activity spaces. Girls living near more destinations had smaller activity spaces, while girls who lived farther from school had larger weekday activity spaces.
Activities per Day
We analyzed variation in the number of non-school activities per day as a second measure of mobility. Acquiring a driver's license had no effect on participation in activities outside school and home, however, having access to a vehicle was associated with increased participation in weekday activities (Table 9). Having two parents in the household was associated with a significant decrease in the number of activities per day. Grade was not a significant predictor of the number of activities. Black and Asian students had lower activity participation in San Diego and Minneapolis. Bilingual students also had lower activity participation in both areas. Students who were eligible for free or reduced price lunch had more activities per day than those not participating in the program. Students living farther from school had higher numbers of activities than those living closer to school; however weekday activities were unrelated to the number of nearby destinations.
Adult-Dependent Activities
Having a driver's license decreased travel reliance on parents and other adults in San Diego and Minneapolis (Table 9). Girls with access to a car were also significantly less dependent on adults for mobility. Reliance on adults for mobility decreased as the girls aged
independent of licensure and vehicle access. Asians were more likely to depend on adults for mobility in San Diego and Minneapolis. Students with jobs were less likely to rely on parents for mobility in San Diego but there was no association in Minneapolis.
Discussion
National studies of teen licensure have found that lower-income and minority teens are less likely to become licensed (Tefft, Williams & Grabowski 2014). Our investigation of teenage girls in Minneapolis and San Diego also found similar patterns. Teens from two-parent households where both parents were employed had significantly higher licensure levels. These variables are likely proxies for household income and reinforce the national findings. Regression models showed that Latinas in San Diego were significantly less likely to be licensed even after controlling for other factors. These findings suggest a need to refine the popular narrative around millennials' distaste for driving and preferences for transit and urban living (Transportation for America 2014; Pendall 2012; Kalita & Whelan 2011). If low-income and minority students are less likely to be licensed, then casting decreases in
A
uthor Man
uscr
ipt
A
uthor Man
uscr
ipt
A
uthor Man
uscr
ipt
A
uthor Man
uscr
licensure as simply the result of changing individual preferences fails to acknowledge the potentially important role of economic constraints.
These results also highlight the need to answer questions about how lowered levels of licensure will impact mobility as teens become adults. Reductions in licensure could provide critical demand for mixed-use, infill development served by transit and high-quality walking and bicycling infrastructure. But given the highly auto-dependent nature of much of the American landscape, reductions in licensure, particularly among low-income and minority individuals, could also make travel more difficult and increase social exclusion for individuals unable to afford to live in areas that support non-auto modes. Researchers and policymakers need to pay careful attention to equity concerns in the debate on this issue.
Obtaining a driver's license had no significant impact on the spatial extent of girls' activities or the number of activities they participated in. However, the effects of licensure were most apparent in a shift of the responsibility for getting girls to activities from parents to the girls themselves (and likely their friends). As shown in previous research, older students became less reliant on parents for their travel needs and had a higher proportion of independent activities than younger students (Clifton 2003; Marzoughi 2011). It may be that parents are the biggest beneficiaries of teens acquiring licenses and getting cars since parents are no longer required to escort their children to all activities.
While licensure had an unexpectedly modest impact on travel patterns, we found that household structure, parental education, racial and ethnic background, and the local built environment did affect behavior. We believe household structure and parental education may serve as proxies for household income which was not measured in this study. Our results showed some different mobility patterns across teens according to race, ethnicity, and linguistic status, even while controlling for other factors. Blacks, Asians, and bilingual teens had significantly lower non-school activities per day. In Minneapolis, bilingual teens had much smaller activity spaces, while Asians and Latinas had much larger ones.
Previous research on youth independent mobility would suggest more limited movement of minority and low-income children, particularly girls, making the findings of smaller activity spaces and lowered activities not surprising (O'Brien et al. 2000; Mitra et al. 2014).
However, the finding of larger activity spaces for minority girls in San Diego was
unexpected. While unusually small activity spaces have been speculated to be measures of social exclusion, we suggest that unusually large activity spaces may also be a sign of a different kind of social exclusion, in particular the need to travel long distances to meet basic household needs (Schönfelder & Axhausen 2003). Our finding that girls with many nearby destinations had smaller weekday activity spaces provides support for this position. However, this highlights the difficulty of interpreting individual metrics of travel behavior. In general, mobility is seen as a good which provides a “means of access to opportunity, enabling people to get to the places, the destinations… where they want or need to go” (Hanson 2010, p. 9). It is this thinking that has interpreted women's lower levels of mobility compared to men as a deficit that reflected women's lower societal opportunities. But as Hanson (2010) notes this is a simplistic approach that fails to understand the context and purpose of tripmaking. These same difficulties exist for activity space measures. Do large
A
uthor Man
uscr
ipt
A
uthor Man
uscr
ipt
A
uthor Man
uscr
ipt
A
uthor Man
uscr
activity spaces reflect decisions to seek out unique opportunities scattered across the region, e.g. participating in a competitive travel team, studying with a particular music teacher, visiting friends, or does it reflect the inability of the local area to meet more basic
requirements for teen life? Addressing these issues will require future research that provides more detail on the motivations for teens' travel decisions.
While these results are informative, a few caveats are in order. Relatively small sample sizes may mask some effects which did not reach the threshold of statistical significance. Several of our models have low R-squared, which may suggest omitted variables, or may reflect the variability in intra-personal travel patterns over time. As our results come from specific urban/suburban settings in San Diego and Minneapolis, they may not generalize to more or less densely settled environments in the United States.
Conclusion
Our longitudinal study examined how teens' independence, licensure, and mobility change over time as they age. In our sample of teenage girls from San Diego and Minneapolis teens were heavily dependent upon parents for their mobility, although many teens moved towards greater travel independence over time. Acquiring a driver's license facilitated travel
independence for the teens, but had little impact on mobility patterns as measured by the spatial extent of their travel and the number of activities per day. Our study highlighted lower rates of licensure for teens from lower income and minority households suggesting that economic factors rather than simply attitudinal preferences shape this decision. These results show a need for a more nuanced discussion of declining licensure among the millennial generation – one that considers the impacts of declining licensure on access to opportunity for individuals along with the potential benefits of lowered automobility.
Acknowledgements
The data used in this study was collected with support from the National Institutes of Health (NIH), National Heart Lung and Blood Institute Grant R01HL71244.
References
Blumenberg, E., Taylor, BD., Smart, M., Ralph, K., Wander, M., Brumbaugh, S. What's youth got to do with it? Exploring the travel behavior of teens and young adults. University of California Transportation Center; Berkeley, CA: 2012.
Bronfenbrenner, U. The ecology of human development: experiments by nature and design. Harvard University Press; Cambridge, Mass: 1979.
Brown B, Mackett R, Gong Y, Kitazawa K, Paskins J. Gender differences in children's pathways to independent mobility. Children's Geographies. 2008; 6(4):385–401. doi:
10.1080/14733280802338080.
Buliung RN, Remmel TK. Open source, spatial analysis, and activity-travel behaviour research: capabilities of the aspace package. Journal of Geographical Systems. 2008; 10(2):191–216. Buliung RN, Roorda MJ, Remmel TK. Exploring spatial variety in patterns of activity-travel
behaviour: initial results from the Toronto Travel-Activity Panel Survey (TTAPS). Transportation. 2008; 35(6):697–722.
Article 3. Issuance and renewal of licenses [12800–12819]. California Vehicle Code.
A
uthor Man
uscr
ipt
A
uthor Man
uscr
ipt
A
uthor Man
uscr
ipt
A
uthor Man
uscr
Carver A, Veitch J, Sahlqvist S, Crawford D, Hume C. Active transport, independent mobility and territorial range among children residing in disadvantaged areas. Journal of Transport & Health. 2014
Clifton KJ. Independent mobility among teenagers: exploration of travel to after-school activities. Transportation Research Record: Journal of the Transportation Research Board. 2003; 1854(1):74– 80.
Delbosc A, Currie G. Changing demographics and young adult driver license decline in Melbourne, Australia (1994–2009). Transportation. 2014; 41(3):529–542. doi: 10.1007/s11116-013-9496-z. Delbosc A, Currie G. Causes of youth licensing decline: A synthesis of evidence. Transport Reviews.
2013; 33(3):271–290.
Fleischhacker SE, Evenson KR, Sharkey J, Pitts SBJ, Rodriguez DA. Validity of Secondary Retail Food Outlet Data: A Systematic Review. American Journal of Preventive Medicine. 2013; 45(4): 462–473. doi: 10.1016/j.amepre.2013.06.009. [PubMed: 24050423]
Han E, Powell L, Slater S, Quinn C. Validation of secondary commercial data sources for physical activity facilities in urban and nonurban settings. Journal of Physical Activity and Health. 2012; 9(8):1080–1088. [PubMed: 22207600]
Hanson S. Gender and mobility: new approaches for informing sustainability. Gender, Place and Culture. 2010; 17(1):5–23. doi: 10.1080/0966369093498225.
Hart, R. Children's experience of place. Irvington Publishers; New York: 1979.
Hillman, M., Adams, J., Whitelegg, J. One false move … : a study of children's independent mobility. Policy Studies Institute; London: 1990.
Hintzen NT, Bastardie F, Beare D, Piet GJ, Ulrich C, Deporte N, Egekvist J, Degel H. VMStools: open-source software for the processing, analysis and visualisation of fisheries logbook and VMS data. Fisheries Research. 2012; 115:31–43.
Hoehner CM, Schootman M. Concordance of commercial data sources for neighborhood-effects studies. Journal of Urban Health. 2010; 87(4):713–725. [PubMed: 20480397]
Horton FE, Reynolds DR. Effects of urban spatial structure on individual behavior. Economic Geography. 1971; 47(1):36–48.
Kalita SM, Whelan R. No McMansions for Millennials. The Wall Street Journal. Jan 13.2011 Kent JL. Driving to save time or saving time to drive? The enduring appeal of the private car.
Transportation Research Part A: Policy and Practice. 2014; 65(0):103–115. doi: 10.1016/j.tra. 2014.04.009.
Kuhnimhof T, Armoogum J, Buehler R, Dargay J, Denstadli JM, Yamamoto T. Men shape a downward trend in car use among young adults—evidence from six industrialized countries. Transport Reviews. 2012; 32(6):761–779.
Kyttä M. The extent of children's independent mobility and the number of actualized affordances as criteria for child-friendly environments. Journal of Environmental Psychology. 2004; 24(2):179– 198.
Lucas K. Transport and social exclusion: Where are we now? Transport Policy. 2012; 20(0):105–113. doi: 10.1016/j.tranpol.2012.01.013.
Marzoughi R. Teen travel in the Greater Toronto Area: A descriptive analysis of trends from 1986 to 2006 and the policy implications. Transport Policy. 2011; 18(4):623–630. doi: 10.1016/j.tranpol. 2011.03.004.
Master SV, Foss RD, Marshall SW. Graduate driver licensing and fatal crashes involving 16- to 19-year old drivers. JAMA: Journal of the American Medical Association. 2011; 306(10):1098–1103. [PubMed: 21917580]
Matthews, M. Making sense of place: children's understanding of large-scale environments. Barnes & Noble Books; Savage, MD: 1992.
McCartt AT, Teoh ER, Fields M, Braitman KA, Hellinga LA. Graduated Licensing Laws and Fatal Crashes of Teenage Drivers: A National Study. Traffic Injury Prevention. 2010; 11(3):240–248. doi: 10.1080/15389580903578854. [PubMed: 20544567]
McCormack GR, Giles-Corti B, Bulsara M. The relationship between destination proximity, destination mix and physical activity behaviors. Preventive Medicine. 2008; 46(1):33–40. [PubMed: 17481721]
A
uthor Man
uscr
ipt
A
uthor Man
uscr
ipt
A
uthor Man
uscr
ipt
A
uthor Man
uscr
McDonald NC, Trowbridge MJ. Does the built environment affect when American teens become drivers? Evidence from the 2001 National Household Travel Survey. Journal of Safety Research. 2009; 40(3):177–183. doi: 10.1016/j.jsr.2009.03.001. [PubMed: 19527810]
Ministry of Infrastructure and the Environment. Not car-less, but car-later. Ministry of Infrastructure and the Environment; The Hague: 2014.
Minnesota Statutes. Chapter 171. Drivers' licenses and training schools. 2013.
Mitra, R., Faulkner, GE., Buliung, RN., Stone, MR. Urban Studies. 2014. Do parental perceptions of the neighbourhood environment influence children's independent mobility? Evidence from Toronto, Canada. doi: 10.1177/0042098013519140
Newsome TH, Walcott WA, Smith PD. Urban activity spaces: Illustrations and application of a conceptual model for integrating the time and space dimensions. Transportation. 1998; 25(4):357– 377.
O'Brien M, Jones D, Sloan D, Rustin M. Children's independent spatial mobility in the urban public realm. Childhood. 2000; 7(3):257–277.
Pendall, R. The next big question facing cities: Will Millennials stay?. The Atlantic Cities. Sep 11. 2012 http://www.theatlanticcities.com/jobs-and-economy/2012/09/next-big-question-facing-cities-will-millennials-stay/3229/
Rai RK, Balmer M, Rieser M, Vaze VS, Schönfelder S, Axhausen KW. Capturing human activity spaces: New geometries. Transportation Research Record: Journal of the Transportation Research Board. 2007; 2021(1):70–80.
Rodríguez DA, Cho G, Evenson KR, Conway TL, Cohen D, Ghosh-Dastidar B, Pickrel JL, Veblen-Mortenson S, Lytle LA. Out and about: Association of the built environment with physical activity behaviors of adolescent females. Health & Place. 2012; 18(1):55–62. doi: 10.1016/j.healthplace. 2011.08.020. [PubMed: 21945085]
Saksvig BI, Catellier DJ, Pfeiffer K, Schmitz KH, Conway T, Going S, Ward D, Strikmiller P, Treuth MS. Travel by walking before and after school and physical activity among adolescent girls. Archives of Pediatrics & Adolescent Medicine. 2007; 161(2):153. [PubMed: 17283300] Schlich R, Schonfelder S, Hanson S, Axhausen KW. Structures of Leisure Travel: Temporal and
Spatial Variability. Transport Reviews. 2004; 24(2):219–237. doi: 10.1080/0144164032000138742.
Schoettle B, Sivak M. The Reasons for the Recent Decline in Young Driver Licensing in the United States. Traffic Injury Prevention. 2014; 15(1):6–9. doi: 10.1080/15389588.2013.839993. [PubMed: 24279960]
Schönfelder, S., Axhausen, KW. On the variability of human activity spaces. In: Keiner, M.Koll-Schretzenmayr, M., Nussbaumer, G., editors. The real and the virtual worlds of spatial planning. Springer; Berlin: 2004. p. 237-262.
Schönfelder S, Axhausen KW. Activity spaces: measures of social exclusion? Transport Policy. 2003; 10(4):273–286.
Shaw, B., Watson, B., Frauendienst, B., Redecker, A., Jones, T., Hillman, M. Children's independent mobility: a comparative study in England and Germany (1971–2010). Policy Studies Institute; London: 2013.
Shults RA, Williams AF. Trends in driver licensing status and driving among high school seniors in the United States, 1996–2010. Journal of Safety Research. 2013; 46(0):167–170. doi: 10.1016/j.jsr. 2013.04.003. [PubMed: 23932698]
Sivak M, Schoettle B. A Note: The Changing Gender Demographics of U.S. Drivers. Traffic Injury Prevention. 2012a; 13(6):575–576. doi: 10.1080/15389588.2012.727110. [PubMed: 23137087] Sivak M, Schoettle B. Update: Percentage of Young Persons With a Driver's License Continues to
Drop. Traffic Injury Prevention. 2012b; 13(4):341–341. doi: 10.1080/15389588.2012.696755. [PubMed: 22817547]
Sivak M, Schoettle B. Recent changes in the age composition of US drivers: implications for the extent, safety, and environmental consequences of personal transportation. Traffic Injury Prevention. 2011; 12(6):588–592. [PubMed: 22133334]
Srivastava, G., Schönfelder, S. Arbeitsberichte Verkehrs- und Raumplanung. 2003. On the temporal variation of human activity spaces.
A
uthor Man
uscr
ipt
A
uthor Man
uscr
ipt
A
uthor Man
uscr
ipt
A
uthor Man
uscr
Stevens J, Murray DM, Catellier DJ, Hannan PJ, Lytle LA, Elder JP, Young DR, Simons-Morton DG, Webber LS. Design of the trial of activity in adolescent girls (TAAG). Contemporary Clinical Trials. 2005; 26(2):223–233. [PubMed: 15837442]
Susilo YO, Kitamura R. Analysis of day-to-day variability in an individual's action space: exploration of 6-week Mobidrive travel diary data. Transportation Research Record: Journal of the
Transportation Research Board. 2005; 1902(1):124–133.
Tefft BC, Williams AF, Grabowski JG. Driver licensing and reasons for delaying licensure among young adults ages 18–20, United States, 2012. Injury epidemiology. 2014; 1(1):4–4. [PubMed: 27747671]
Thompson, D., Weissmann, J. The Atlantic. Sep. 2012 The Cheapest Generation. 2012
Transportation for America. Survey: To recruit and keep millennials, give them walkable places with good transit and other options. Jul 7. 2014 [Homepage of Transportation for America], [Online]. Available: http://t4america.org/2014/04/22/survey-to-recruit-and-keep-millennials-give-them-walkable-places-with-good-transit-and-other-options/#.U1bQ6ZuN7Gg.twitterhttp://
t4america.org/2014/04/22/survey-to-recruit-and-keep-millennials-give-them-walkable-places-with-good-transit-and-other-options/2014
Trowbridge MJ, McDonald NC. Urban sprawl and miles driven daily by teenagers in the United States. American Journal of Preventive Medicine. 2008; 34(3):202–206. [PubMed: 18312807]
Valentine G. “Oh yes I can.” “Oh no you can't”: children and parents' understandings of kids' competence to negotiate public space safely. Antipode. 1997; 29(1):65–89.
Weston, LM. What helps and what hinders the independent mobility of non-driving teens. The University of Texas at Austin; 2006.
Williams AF. Teenagers' Licensing Decisions and Their Views of Licensing Policies: A National Survey. Traffic Injury Prevention. 2011; 12(4):312–319. doi: 10.1080/15389588.2011.572100. [PubMed: 21823938]
A
uthor Man
uscr
ipt
A
uthor Man
uscr
ipt
A
uthor Man
uscr
ipt
A
uthor Man
uscr
A
uthor Man
uscr
ipt
A
uthor Man
uscr
ipt
A
uthor Man
uscr
ipt
A
uthor Man
uscr
Table 1
Availability of Location Information for Reported Activities
Minneapolis San Diego Survey Year 2008 2010 2008 2010
N (%) N (%) N (%) N (%)
Total Respondents 150 146 153 141
Activities Reported in the Diary 3,667 (100%) 3,816 (100%) 3,304 (100%) 3,364 (100%)
Activities with Respondent-provided Location Address 3,389 (92%) 3,634 (95%) 2,998 (91%) 3,076 (91%)
Activities with Location Inferred from GPS 108 (3%) 55 (1%) 69 (2%) 124 (4%)
Activities with No Location Information 170 (5%) 127 (3%) 237 (7%) 164 (5%)
Activities with Geocoded Location 3,497 (95%) 3,689 (97%) 3,067 (93%) 3,200 (95%)
A
uthor Man
uscr
ipt
A
uthor Man
uscr
ipt
A
uthor Man
uscr
ipt
A
uthor Man
uscr
ipt
Table 2
Activity Data for Construction of Weekday Activity Space Metrics
Minneapolis San Diego
2008 2010 2008 2010 Total
Initial Number of Weekday Activities with Geocoded Locations 2,613 2,757 2,362 2,470 10,202
Activities Removed Because >70km from Home 20 8 12 6 46
Activities Added due to Missing Home and School Locations 30 6 14 12 62
Final Number of Geocoded Weekday Activities 2,623 2,755 2,364 2,476 10,218
Number of Respondents with Geocoded Weekday Activities 150 146 153 141 590
Respondents with ≤2 Activity Locations 6 7 16 2 31
Respondents with Missing Demographics 2 2 5 5 14
A
uthor Man
uscr
ipt
A
uthor Man
uscr
ipt
A
uthor Man
uscr
ipt
A
uthor Man
uscr
Table 3
Reported Travel Mode for Weekdays (N=545)
Minneapolis San Diego 2008 % 2010 % 2008 % 2010 %
Adult-Dependent Total 36.2% 21.6% 59.3% 49.2%
Driven by Parents 26.0 16.6 45.1 36.3
Driven by Other Adults 10.2 5.0 14.3 13.0
Independent Total 62.4% 77.6% 37.9% 49.0%
Driven by Self 23.3 43.2 10.1 23.2
Driven by Friends 15.6 22.4 5.9 9.3
Walking 7.9 4.0 15.4 12.1
Biking 0.2 0.3 0.1 0.0
Public Transit 0.2 0.1 5.0 3.5
School Bus 14.2 7.2 1.2 0.8
Other 1.0 0.4 0.2 0.1
Missing Mode 1.4 0.8 2.8 1.8
A
uthor Man
uscr
ipt
A
uthor Man
uscr
ipt
A
uthor Man
uscr
ipt
A
uthor Man
uscr
ipt
Table 4
Sociodemographic Characteristics
Minneapolis San Diego 2008 2010 2008 2010
# of Respondents 142 137 132 134
Mean Age (SD) 16.4 (0.4) 17.3 (0.5) 16.3 (0.5) 17.2 (0.5)
Mean Grade (SD) 10.5 (0.5) 11.5 (0.5) 10.5 (0.5) 11.5 (0.5)
License Category
None 21.8% 11.0% 74.2% 57.5%
Learner's Permit 36.6% 14.6% 9.9% 9.7%
Provisional 12.7% 18.3% 9.9% 20.9%
Full License 28.9% 56.2% 6.1% 11.9%
Has Access to Own Car 31.7% 56.2% 16.7% 26.9%
Race/Ethnicity
Non-Hispanic White 83.8% 84.7% 22.7% 23.9%
Latina 4.2% 4.4% 54.5% 53.7%
Non-Hispanic Asian 5.6% 5.8% 7.6% 7.5%
Non-Hispanic Black 3.5% 2.9% 6.8% 6.0%
Other 2.8% 2.2% 8.3% 9.0%
Bilingual 2.1% 3.6% 20.5% 20.1%
Qualifies for Free or Reduced Price Lunch 15.5% 16.8% 37.1% 34.3%
Two Parents in Household 78.9% 77.4% 64.4% 63.4%
Two Employed Parents 72.5% 75.2% 56.8% 58.2%
Two College Educated Parents 45.1% 40.9% 7.6% 10.4%
On School Team(s) 53.5% 46.7% 46.2% 38.1%
Employed 48.6% 61.3% 12.1% 16.4%
Walked to School as 8th Grader 19.0% 19.0% 45.5% 46.3%
A
uthor Man
uscr
ipt
A
uthor Man
uscr
ipt
A
uthor Man
uscr
ipt
A
uthor Man
uscr
Table 5
Built Environment Characteristics near Respondents' Homes
Minneapolis San Diego 2008 (n=142) 2010 (n=137) 2008 (n=132) 2010 (n=134)
Average number of Destinations within 800m (SD) 8.7 (15.5) 9.1 (15.6) 11.9 (11.6) 11.7 (11.2)
Average number of Destinations within 1600m (SD) 32.7 (34.1) 32.8 (33.4) 43.5 (28.9) 43.2 (28.7)
Average number of Types of Destinations Within 800m (SD) 3.2 (2.7) 3.4 (2.7) 4.9 (2.6) 4.9 (2.6)
Average number of Types of Destinations Within 1600m (SD) 7.3 (3.6) 7.4 (3.5) 8.5 (1.7) 8.5 (1.7)
A
uthor Man
uscr
ipt
A
uthor Man
uscr
ipt
A
uthor Man
uscr
ipt
A
uthor Man
uscr
ipt
Table 6
Standardized Proportion with Full or Provisional Licenses by Sociodemographic Characteristics, Standardized by Grade
Minneapolis San Diego
All 55.9% 23.8%
Grade
10th 24.7% 7.5%
11th 65.7% 26.9%
12th 77.3% 36.9%
Free and Reduced Price Lunch
No 60.6% 30.8%
Yes 31.4% 11.3%
Race and ethnicity
Non-Hispanic white 57.6% 44.3%
Non-Hispanic black 40.0% 27.4%
Hispanic 47.2% 14.1%
Non-hispanic Asian 56.3% 28.1%
Other 45.8% 21.7%
A
uthor Man
uscr
ipt
A
uthor Man
uscr
ipt
A
uthor Man
uscr
ipt
A
uthor Man
uscr
Table 7
Mobility and Travel Independence by Grade
Minneapolis San Diego 10th 11th 12th 10th 11th 12th
Sample Size 73 140 66 67 134 65
Standard Deviation Ellipse (SDE) (km2) 63.8 60.3 51.6 36.1 34.0 47.2
Natural Log Standard Deviation Ellipse 17.1 17.2 17.2 16.5 16.4 16.7
Non-School/Home Activities per Day 1.58 1.48 1.52 1.16 1.27 1.27
A
uthor Man
uscr
ipt
A
uthor Man
uscr
ipt
A
uthor Man
uscr
ipt
A
uthor Man
uscr
ipt
Table 8
Binary Logit Model of the Probability of Holding a Provisional or Full License
Coefficient Standard Error p-value
Age in Months 0.080 0.028 0.005
Two Parent Household 0.701 0.352 0.046
Two Parents Employed 0.628 0.333 0.060
Two College Educated Parents 0.616 0.396 0.120
Qualifies for Free Lunch −0.342 0.395 0.387
Black −1.233 1.200 0.304
Black * San Diego 0.605 1.498 0.686
Asian −0.201 0.783 0.798
Asian * San Diego 0.133 1.075 0.902
Latina 1.492 1.290 0.247
Latina * San Diego −3.062 1.369 0.025
Other −0.682 1.091 0.532
Other * San Diego −0.614 1.374 0.655
Bilingual −0.397 0.573 0.489
On School Sports Teams 0.513 0.316 0.105
Employed 0.022 0.349 0.950
Walked to School as an 8th Grader −0.759 0.355 0.032
Built Environment Variables
Total Destinations (800 m) −0.005 0.012 0.654
Distance Home to School (m) −0.043 0.056 0.448
Distance Home to School * San Diego −0.309 0.158 0.051
San Diego 0.349 0.710 0.623
Survey Variables
Year = 2010 −0.236 0.870 0.787
Constant −16.132 5.738 0.005
N 293
A
uthor Man
uscr
ipt
A
uthor Man
uscr
ipt
A
uthor Man
uscr
ipt
A
uthor Man
uscr
Table 9
Factors Influencing Adolescent Weekday Mobility
Activity Space (ln) Activities per Day Percent Adult-Dependent Activities Coef. SE p-value Coef. SE p-value Coef. SE p-value
Individual Variables
Grade 11 −0.219 0.181 0.226 −0.066 0.116 0.567 −0.083 0.034 0.014
Grade 12 −0.259 0.254 0.309 −0.052 0.178 0.770 −0.135 0.052 0.009
Full or Prov. License −0.048 0.165 0.771 0.001 0.111 0.992 −0.212 0.035 <0.001
Access to Own Car 0.177 0.160 0.268 0.223 0.105 0.033 −0.133 0.032 <0.001
Two Parent Household −0.375 0.148 0.011 −0.322 0.092 <0.001 0.010 0.029 0.739
Two Parents Employed 0.042 0.149 0.778 0.086 0.093 0.356 0.001 0.026 0.965
Two College Educated Parents 0.390 0.153 0.011 0.017 0.11 0.874 0.008 0.025 0.748
Free Lunch −0.007 0.195 0.971 0.265 0.126 0.036 −0.003 0.033 0.924
Black −0.058 0.260 0.824 −0.598 0.241 0.013 −0.060 0.050 0.231
Black * SD −0.416 0.463 0.369 0.042 0.283 0.883 0.164 0.090 0.069
Asian 0.368 0.286 0.198 −0.471 0.183 0.010 0.146 0.071 0.039
Asian * SD −0.839 0.429 0.051 −0.246 0.245 0.315 −0.001 0.096 0.992
Latina 0.893 0.273 0.001 0.065 0.316 0.836 0.021 0.111 0.847
Latina * SD −0.879 0.392 0.025 −0.181 0.350 0.606 0.032 0.120 0.789
Other Race −0.655 0.532 0.218 0.278 0.227 0.221 −0.070 0.110 0.522
Other Race * SD 0.116 0.640 0.856 −0.575 0.294 0.051 0.194 0.132 0.142
Bilingual −0.223 0.258 0.388 −0.218 0.113 0.055 0.004 0.043 0.925
On School Sports Teams 0.156 0.124 0.211 −0.032 0.075 0.666 −0.023 0.024 0.333
Employed 0.091 0.159 0.567 0.192 0.135 0.156 −0.037 0.029 0.199
Employed * SD 0.116 0.303 0.701 0.299 0.240 0.212 −0.104 0.059 0.077
Walked to School as an 8th Grader −0.244 0.156 0.118 0.079 0.112 0.481 −0.045 0.028 0.113
Built Environment Variables
Total Destinations (800 m) −0.017 0.005 0.001 −0.003 0.004 0.532 −0.001 0.001 0.319
Distance Home to School 0.134 0.016 <0.001 0.021 0.012 0.077 0.000 0.004 0.910
SD 0.072 0.254 0.777 −0.067 0.158 0.671 0.117 0.047 0.014
Survey Variables
Year = 2010 0.221 0.179 0.218 −0.055 0.109 0.611 0.022 0.028 0.440
Days Recorded 0.011 0.042 0.798 −0.191 0.068 0.005 −0.002 0.007 0.812
Constant 16.519 0.408 <0.001 2.865 0.502 <0.001 0.577 0.075 <0.001
N 545 545 545
R2 0.241 0.186 0.474
Rho 0.277 0.218 0.392