THYMIC DEVELOPMENT OF AUTOREACTIVE T CELLS IN NOD MICE, AND THE ALTERED TRAFFICKING OF T CELLS FOLLOWING ANTIBODY MEDIATED
CROSSLINKING OF THE CD4 CORECEPTOR
Yves Maurice Morillon II
A dissertation submitted to the faculty of the University of North Carolina at Chapel Hill in partial fulfillment of the requirements for the degree of Doctor of Philosophy in the
Department of Microbiology and Immunology.
Chapel Hill 2014
Approved by: Barbara Vilen Glenn Matsushima Lishan Su
© 2014
ABSTRACT
Yves Maurice Morillon II: Thymic development of autoreactive T cells in NOD mice, and the altered trafficking of T cells following antibody mediated crosslinking of the CD4
coreceptor
(Under the direction of Roland Tisch)
Two key processes in driving type 1 diabetes are the development and trafficking of
cell-specific T cells into the pancreas. The first part of this dissertation examines thymic development of autoreactive T cells, whereas the second part explores novel T cell trafficking pathways upon antibody binding to CD4.
The production of autoreactive T cells occurs through a failure of negative selection in the thymus. We utilized a thymic transplant approach to investigate possible ontogenic changes in autoreactive T cell production. Various aged NOD thymi were transplanted into NOD.scid recipients, which were then assessed for pathology. The development of diabetes was restricted to recipients of newborn thymi, insulitis was observed in recipients of 7 and 10 day, but not older thymi. Increased diabetes and insulitis was associated with increased diabetogenic T effectors and not with altered regulatory T cell frequency or activity. In contrast, recipients of older thymi developed colitis, characterized by IFNand IL-17
producing T cells reactive to gut microbiota. These findings demonstrate that thymic
development of autoreactive T cells is restricted to a narrow window, and that the efficacy of thymic negative and positive selection increases with age in mice.
recently reported diabetes remission in NOD mice following administration of anti-CD4 and anti-CD8 antibodies. Remission was associated with T cell purging from the pancreas and pancreatic lymph nodes. In this study, we investigated the mechanisms of purging following anti-CD4 treatment. Shortly after anti-CD4 treatment, the activity of the GTPases Rac1 and Rac2 were markedly increased. Notably, Rac1 and Rac2 function are associated with T cell migration. In addition, T cell polarization was increased, and expression of lymph node homing adhesion molecules were decreased, concomitant with T cell egress from the
DEDICATION
ACKNOWLEDGEMENTS
I would like to thank the members of my committee, Dr. Barb Vilen, Dr. Glenn Matsushima, Dr. Maureen Su, and Dr. Lishan Su, for their expertise and time. In addition, I would like to acknowledge and thank Dr. Steve Clarke for his input and guidance. I would like to especially thank my mentor, Dr. Roland Tisch for dedicating his time and energy into the successful completion of not only the work described here, but for the guidance
throughout my graduate school career. I am especially thankful for all the opportunities that were provided to me.
I would like to thank the members of the Tisch lab, both past and present, for their scientific input, collaboration, and moral support. Without their assistance, my successes would have been much more difficult, and my time in the lab much less enjoyable. In particular, I would like to thank Dr. Bo Wang, for both his conceptual and technical input, without which, my graduate experience would have been much less fruitful. I would also like to thank Dr. Maureen Su, as well as the members of her lab, for their valuable input during lab meetings.
TABLE OF CONTENTS
LIST OF TABLES ... ix
LIST OF FIGURES ... x
LIST OF APPENDICES ... xi
ABBREVIATIONS ... xii
Chapter 1: Background and Significance ... 1
Etiology of Type 1 Diabetes ... 1
Thymic Selection and Central Tolerance ... 3
Age Dependent Changes in Central Tolerance ... 5
Onset of Type 1 Diabetes Primarily Occurs in Younger Individuals ... 6
Insight into Basic T Cell Biology By Manipulating T1D Via Immunotherapy ... 7
T Cell Migration From Blood to Lymphoid Tissue ... 8
Intracellular Events Leading to T Cell Migration ... 9
Chapter 2: Thymic Development Of Autoreactive T Cells In NOD Mice Is Regulated In An Age-Dependent Manner ... 12
Introduction ... 12
Materials and Methods ... 14
Results ... 17
Discussion ... 21
Materials and Methods ... 35
Results ... 39
Discussion ... 43
Chapter 4: Discussion ... 52
Discussion ... 52
Conclusion ... 58
Appendix ... 60
LIST OF TABLES
Table I. T cell infiltration of organs in NOD.scid recipients of
different-aged NOD thymi. ... 27 Table II. Disease incidence in NOD.scid mice adoptively transferred
with splenocytes from different-aged NOD-thymus recipients. ... 27 Table III.Relative T cell infiltration of organs in NOD.scid
LIST OF FIGURES
Figure 1. Reciprocal development of diabetes and colitis in NOD.scid
recipients is dependent on the age of NOD donor thymus. ... 26 Figure 2. Distinct T cell phenotypes and specificities detected in
recipients of different aged NOD donor thymi. ... 28 Figure 3. Colitogenic T cells respond to intestinal microbial antigens... 29 Figure 4. Development of diabetes is not due to increased Foxp3+Treg
frequency or suppression. ... 30 Figure 5. Temporal development of autoreactive T cells is independent of
AIRE in some organs. ... 30 Figure 6. T cells migrate from lymph nodes and enter circulation following
administration of YTS177. ... 47 Figure 7. CD4+ T cells exhibit increased sensitivity to chemokines after
YTS177 treatment. ... 48 Figure 8. PLN derived T cells rapidly adopt a polarized phenotype following
YTS177 treatment. ... 49 Figure 9. Increased Rac1 and Rac2 activity in PLN T cells after YTS177
treatment. ... 50 Figure 10. Altered activity upstream of Rac activation in T cells following
YTS177 treatment. ... 51 Figure 11: A model for age dependent thymic production of autoreactive
and colitogenic T cells. ... 57 Figure 12. Model for altered T cell trafficking following YTS177 mediated
LIST OF APPENDICES
Appendix 1. Diabetes development is unaffected by colitogenic
T cells. ... 60 Appendix 2. Organ infiltration in NOD.scid recipients of 12 wk-old
ABBREVIATIONS
AIRE autoimmune regulator APC antigen presenting cells
APECED autoimmune polyendocrinopathy-candidiasis-ectodermal dystrophy CBL cecal bacterial lysate
CKR chemokine receptor
cTEC cortical thymic epithelial cell DC dendritic cell
DN double negative
DP double positive
Foxp3+ Treg Foxp3-expressing immunoregulatory CD4+ T cell GEF guanine nucleotide exchange factor
GlyCAM-1 glycosylation-dependent cell adhesion molecule-1 ICAM-1 inter-cellular adhesion molecule-1
IGRP islet-specific glucose-6-phosphatase catalytic subunit–related protein IS immunological synapse
Lck lymphocyte-specific protein tyrosine kinase LFA-1 leukocyte function-associated molecule-1 Mac-1 macrophage-1 antigen
MHC major histocompatibility complex MLN mesenteric lymph node
NOD nonobese diabetic
PI3K Phosphoinositide 3-kinase PLN pancreatic lymph node RAG recombinase activating gene SP single positive
T1D type 1 diabetes TCR T cell receptor Teff effector T cell
TSA tissue-specific antigen
Chapter 1: Background and Significance
Etiology of Type 1 Diabetes
Type 1 diabetes (T1D) is an autoimmune disease characterized by the destruction of insulin producing cells located in the islets of Langerhans of the pancreas (1, 2). Clinical
disease, as defined by an inability to regulate blood glucose levels, develops once
approximately 85-90% of cell mass has been destroyed or rendered nonfunctional. The
initiating events in the development of T1D are unknown; however, both genetic and epigenetic/environmental factors play a role. Susceptibility to T1D is associated with a number of genes (3) with greatest risk in humans linked to genes encoding specific alleles of human leukocyte antigen class II molecules (4). Ill-defined environmental factors also play a role, which is most popularly described using the “Hygiene hypothesis”, where “cleaner” environments and better hygiene are associated with increased incidence of T1D, as well as a reduction in disease in less developed and less hygienic regions (5).
T1D is mediated by several immune effector cell types (6-8). Experimentally, nonobese diabetic (NOD) mice lacking either CD4+ or CD8+ T cells fail to develop
spontaneous T1D (6). Indirect evidence also suggests a key role for CD4+ and CD8+ T cells in human T1D; for instance both cell types are found infiltrating the islets of pancreata from T1D patients, with CD8+ T cells being the most abundant (7).
macrophages, and dendritic cells (DC). Macrophages, DC, and B cells are among the first adaptive immune cells to enter the islets (8). The importance of B cells in T1D pathogenesis is evident in NOD MT-/- mice, which lack B cells, and do not develop diabetes (9). Certain
B cell subsets are suggested to be important in disease development, although studies have correlated increased subset presence with onset of disease (10), no studies report an absolute requirement for a particular subset. Although cell-specific autoantibodies are detected and
remain an indicator of T1D in both mice and humans, the necessity of autoantibodies in disease progression has yet to be demonstrated. It is therefore believed that B cells serve as a critical APC (11), directing autoantigen presentation through recognition of a self-reactive monoclonal B cell receptor. This idea is supported by depleting B cells in NOD mice using an anti-CD20 therapy (12). Transiently depleting B cells significantly delays or protects from diabetes onset.
Ultimately, it is autoreactive T cells, which have escaped mechanisms of both central and peripheral tolerance which carry out the final destruction of cells. Investigations have
peripheral tolerance, in part mediated by CD4+ Treg, prevent the development of a pathological autoimmune response. A reduction in Treg frequency and/or function is believed to result in preferential differentiation and expansion of pathogenic cell-specific CD4+ and CD8+ T cells, typically exhibiting a type 1 phenotype marked by IFN secretion
(17).
In the event that autoimmune T cells escape mechanisms of central and peripheral tolerance, they must be primed by autoantigen expressing APC. Once activated, T cells exit the lymph nodes and enter into the target tissue. In the case of T1D, the draining pancreatic lymph nodes (PLN) are the key site for cell-specific T cell activation, expansion and
differentiation prior to trafficking into the pancreas (18). Once in the islets, established T effectors encounter cognate antigen to drive cell destruction.
This thesis will concentrate on two distinct aspects of T1D. In Chapter 2, we focus on central tolerance and provide evidence that the efficacy of thymic negative selection is regulated in a temporal manner. In Chapter 3, we investigate the mechanisms by which an antibody-mediated T cell coreceptor-based immunotherapy affects the trafficking properties of cell-specific T cells.
Thymic Selection and Central Tolerance
(RAG) and expression of a functional in frame TCR variable (V) chain (20). Only DN thymocytes that successfully produce a pre-TCR complex, a V chain with an invariant surrogate V chain, continue on to the double positive (DP) thymocyte stage (21, 22). DP thymocytes must first rearrange a functional V chain in order to express an TCR. DP
thymocytes also characteristically express both CD4 and CD8. It is at this stage, that DP thymocytes undergo positive selection in which survival relies on the successful TCR recognition of MHC class I and II expressed by cTEC. In the absence of TCR signals generated upon appropriate MHC class I and II binding, DP thymocytes undergo apoptosis by “neglect”. Attrition is high since only 3-5% of thymocytes successfully progress past the DP stage (23).
Successful completion of positive selection results in migration from the thymic cortex to the medulla, where DP thymocytes mature to become single positive (SP) thymocytes, expressing either the CD4 or CD8 receptor. SP thymocytes undergo negative selection via interactions with medullary thymic epithelial cells (mTEC) and thymic DC. Notably, mTEC via the autoimmune regulator (AIRE) transcription factor express a
Thymic negative selection relies on the affinity/avidity of TCR recognition of the self-antigen peptide-MHC complex; increased binding promotes apoptosis and purging of the TCR repertoire (29). Alternatively, interactions with increased affinity/avidity may promote development of Foxp3+Treg (30). Thymocytes continually interact with self-expressing APC over a period of up to 12 days (31), which ensures efficient elimination of autoreactive T cells prior to entering the periphery. The process of thymic selection is estimated to take 16-19 days. As efficient and stringent as thymic selection is, some autoreactive T cells escape, and in the absence of sufficient peripheral tolerance mechanisms, autoimmune disease can result.
Thymocytes require interactions with both cTEC and mTEC in order to survive and develop into T cells, however, the thymic stroma also requires thymocyte interactions in order to mature and develop (32-34). Mice deficient in the ability of thymocytes to progress through selection also exhibit reduced thymic cortical or medullary mass.
Age Dependent Changes in Central Tolerance
During development of both humans and mice, thymus maturation is associated with structural reorganization of the cortex and medulla coupled with an increase in size due to an expanding pool of thymic stroma, APC and thymocytes. In humans, the thymus is estimated to continue to develop until the teen aged years, at which time thymic involution begins (35). A similar phenomenon is observed in rodents, where development continues until 4 weeks of age, after which involution is observed (36). Ontogenic changes in thymic structure may impact the efficacy of positive and negative selection events.
NOD mice early in ontogeny, after 3 weeks of age AIRE was dispensable in preventing the development of systemic autoimmunity (37).
Another ontogenically regulated key event that may influence the efficacy of thymic selection is the origin of thymocyte precursors. During embryonic development in mice, T cell precursors are derived from the liver up until embryonic day 13 (38, 39) followed by a switch to bone marrow derived precursors by embryonic day 15. Key phenotypic differences exist between thymocytes derived from embryonic liver versus adult bone marrow.
Thymocytes derived during embryonic development are hyperproliferative (40-42) whereas adult thymocytes exhibit little proliferative ability (43). Embryonic precursors give rise to longer lasting thymocytes when compared to those derived from bone marrow (42, 44). In addition, embryonic precursors have been shown to utilize V6 as well as V11 in much
higher frequency than their adult counterparts (45, 46). Although an investigation into particular specificities has not been completed, disparate usage of particular V chains based
on precursor origin is suggestive of differences in specificity. Taken together, it is plausible that a functional difference exists in thymic selection early versus later in ontogeny.
Onset of Type 1 Diabetes Primarily Occurs in Younger Individuals
T1D has been commonly referred to as “juvenile diabetes”, implying that disease onset primarily occurs in young individuals. Evidence for a skewing towards early onset was provided in an epidemiologic study of European populations which described disease onset in humans primarily occurring prior to 14 years of age (47). Early development of disease is mirrored in the NOD mouse, where insulitis typically begins at 3 weeks of age, progressing to clinical onset between 15 and 25 weeks of age. Evidence of early production of
NOD mice thymectomized at day 3 post birth (48, 49). Suggesting a sufficient number of autoreactive T cells have been produced by 3 days of age for disease to develop.
Early disease development provides support that autoreactive T cells are produced early in ontogeny. However, the question remains if autoreactive T cells are continuously produced at the same frequency throughout life. In view of the various age-dependent changes in the thymus and thymocyte precursors, an intriguing hypothesis is that early in ontogeny, autoreactive T cells more readily escape negative selection. The implications of a narrow developmental window of autoreactive T cell production would provide a temporal target to intervene in the prevention of T1D.
Insight into Basic T Cell Biology By Manipulating T1D Via Immunotherapy
Identifying therapeutic targets is paramount in preventing and treating T1D. The body of knowledge currently available provides us with a large source of potential targets,
however, basic knowledge in the mechanisms behind T cell production and activity is still lacking. One of the defining characteristics of T cells is their ability to rapidly circulate through the body, searching for cognate antigen and to respond as needed. However, regulation of T cell circulation in the absence of an inflammatory environment is still not fully understood. A novel approach to combating autoimmune disease would be one where pathogenic T cells are rendered unresponsive to inflammatory cues to block tissue pathology.
Foxp3+ Treg isolated from maintenance phase long term remission animals are able to suppress the adoptive transfer of diabetes. In vitro models have also demonstrated an increased suppressive ability of Foxp3+Treg isolated from long term (>100 days) treated vs untreated NOD mice. For the purpose of this thesis, we will concentrate on the effect of only the anti-CD4 (YTS177) immunotherapy during the induction phase of remission, which is characterized by T cell purging from the pancreas and PLN. While YTS177 alone is not capable of inducing diabetes remission, it is capable of causing CD4+ T cell migration from the pancreas and peripheral lymph nodes.
T Cell Migration From Blood to Lymphoid Tissue
T cell migration is a dynamic process where environmental cues signal T cells to phenotypically change to promote directed and purposeful movement. T cells are among the most migratory cells in the body (51), continually circulating from blood to the lymphatics (52), termed homing. Circulating T cells have a circular morphology with even distribution of chemokine receptors (CKR) and adhesion molecules. In response to chemokines or vascular expressed adhesion molecules, T cells begin to slow, roll, and tether to endothelial surfaces (53). This is primarily accomplished through the interactions of CD62L binding to its respective ligand glycosylation-dependent cell adhesion molecule-1 (GlyCAM-1) (or other sialylated ligands) (54). Firm adhesion ultimately halts circulating T cells via the interaction of leukocyte function-associated molecule-1 (LFA-1) or 41 with their
the T cell. The leading edge also becomes enriched with polymerizing F-actin, creating cellular protrusions which serve to pull the cell forward, allowing for transendothelial
migration. The uropod becomes enriched with a variety of adhesion molecules such as CD43, CD44, ICAM-1 and others (57). The function of the uropod is still unclear, however it has been suggested that it may sequester adhesion molecules not required for transendothelial migration (58).
T cells enter lymphoid organs by crossing high endothelial venules (53). Following lymph node entry, T cells “sample” or “scan” MHC presented antigen by APC searching for recognition of their cognate antigen, this process is regulated by the interaction of LFA-1 on T cells and ICAM-1 on APC (59). When antigen recognition occurs, “sampling” turns to firm adhesion via the generation of the immunological synapse (IS) (60). In the absence of antigen recognition, T cells disengage from their initial contact and either continue to sample MHC presented antigen or egress from the lymphoid tissue to return to circulation. The molecular events leading to lymph node egress are not fully understood; however, T cells must again polarize and cross endothelial barriers in order to return to circulation (61).
Intracellular Events Leading to T Cell Migration
signal. Upon binding of CD4 to conserved regions of the MHC class II molecule expressed by APC, the Src family tyrosine kinase, lymphocyte-specific protein tyrosine kinase (Lck), becomes active via phosphorylation at tyrosine 394 (63). Having adopted kinase potential, p394 Lck is then able to phosphorylate ZAP-70 (64) which in turn acts as a kinase in the phosphorylation of the guanine nucleotide exchange factor (GEF), Vav (65). GEFs have the ability to activate small Rho GTPases, such as Rac, by facilitating the exchange of GDP for GTP. A limited number of GEFs have been described in the context of T cell activation and migration including: Vav, Tiam1, Dock2, and Sos (66, 67). The utilization of different GEFs in the activation of Rac has been associated with distinct phenotypic activities (66). Rac activation through the activity of Dock2 or Tiam1 has been associated with lymph node egress (68-70). Vav1 activation of Rac has been linked to T cell activation (71), although evidence also exists showing Vav regulation of cytoskeletal reorganization, suggesting a role in polarization and migration (72, 73). A role for Sos has been more difficult to determine, as Sos1 knockout mice exhibit embryonic lethality (74).
established (81). T cells from Rac2 knockout animals exhibit defects in polarization and actin polymerization, as well defects in downstream TCR signaling (82). The common theme of both isoforms of Rac is control of the cytoskeleton and as such, polarization and migration. In short, Rac is the molecular switch, toggling T cells between a stationary and migratory state.
Downstream effector molecules of Rac activation can vary, however. Control of the cytoskeleton is accomplished mainly through an association with the Wiskott-Aldrich syndrome protein (WASP) (83). WASP knockout mice exhibit a phenotype very similar to those of certain GEF knockouts, where T cells have a defect in activation and polarization (84). Activation defects can be traced back to an inability to modulate the cytoskeleton in response to activation cues, for instance, blocking upstream Rac activation results in a failure of PKC- to localize to the IS during TCR priming, and as such prevents downstream TCR
signaling (73).
Chapter 2: Thymic Development Of Autoreactive T Cells In NOD Mice Is Regulated In An Age-Dependent Manner1
Introduction
Events ongoing in the thymus play a critical role in shaping the repertoire of T cells (85, 86). Positive selection in the thymic cortex generates a pool of T cells restricted to self-MHC molecules. On the other hand, negative selection in the medulla of the thymus ensures that thymocytes reactive to self-antigens are purged via induction of apoptosis or anergy (14, 87). mTEC (88-90) and dendritic cells (DC) (27, 28, 91) drive thymocyte negative selection by expressing and/or presenting self-antigens, respectively. A constellation of tissue-specific antigens (TSA) is expressed by mTEC (88, 92) and expression of many of these TSA is controlled by the Aire transcription factor (88, 93, 94). The parameters that influence the efficiency of thymic negative selection are ill-defined, but are believed to include the avidity of the interaction of thymocytes with mTEC and DC, intrinsic responses of thymocytes to apoptosis induction, and/or levels of thymic TSA expression and presentation (24, 95-98).
1 The citation is as follows: He, Q., Morillon, YM 2nd, Spidale, N.A., Kroger, C.J., Liu, B., Sartor, R.B., Wang,
Inefficient thymic negative selection has been associated with various T cell-mediated autoimmune diseases such as T1D (13, 14, 99). T1D in humans and rodent models, such as the NOD mouse, is characterized by the CD4+ and CD8+ T cell-mediated destruction of the insulin-producing cells residing in the pancreatic islets of Langerhans (2). In NOD mice the
diabetogenic response involves progressive insulitis in which T cells and other immune effectors infiltrate the islets over time. Insulitis is first detected at 3-4 wk of age and relatively few cell autoantigens and epitopes are targeted by CD4+
and CD8+ T cells (100-103). By 12 wk of age, a late preclinical stage of T1D, the islets in NOD mice are heavily infiltrated, marked by effector T cells (Teff) targeting numerous cell autoantigens and
epitopes. Aberrant survival of islet resident Foxp3+Treg is then believed to promote a wave of robust cell destruction and the onset of overt diabetes (17, 104). NOD mice also exhibit
T cell autoimmunity to other tissues such as the thyroid (105, 106) and salivary gland (107), and low levels of colitis (108, 109) are detected suggesting general defects in mechanisms regulating autoimmune and inflammatory responses, respectively.
thymic negative selection, in addition to establishing strategies to prevent T cell-mediated autoimmunity.
We investigated the ontogeny of autoreactive T cells using a thymus transplant approach. Immunodeficient NOD.scid recipients were implanted with thymus grafts from different aged NOD donor mice, and the pathogenicity of the resulting T cell pool assessed. Here we demonstrate that thymic production of organ-specific autoreactive Teff is limited to a 10 d period after birth, indicating that the efficacy of thymic negative selection is regulated in a temporal manner.
Materials and Methods
Mice.
NOD/LtJ, NOD.CB17-Prkdcscid/J (NOD.scid), and NOD.129S2(B6)-Airetm1.1Doi/DoiJ (NOD.Airenull) were originally purchased from The Jackson Laboratory (Bar Harbor).
NOD.Cg-Tg(TcrTcrBDC2.5)1Doi/DoiJ (NOD.BDC2.5) mice have been previously
described (115). NOD.BDC2.5 mice were bred with NOD.129P2(C)-Tcratm1Mjo/DoiJ (NOD.Cnull
) mice to generate NOD.BDC2.5.Cnull mice. All mice were bred and
maintained in specific pathogen-free facilities at the University of North Carolina at Chapel Hill. Mouse experiments were approved by the University of North Carolina at Chapel Hill Institutional Animal Care and Use Committee.
Thymus transplantation and disease assessment.
Thymic lobes from newborn (within 48 hr of birth) and various aged female NOD or NOD.Airenull mice were implanted under the kidney capsule of 6 wk-old female NOD.scid
were scored as diabetic. The body weight of animals was measured weekly, and the development of weight loss was considered as the clinical onset of colitis.
Immunohistological analyses.
Various tissues were fixed in 10% neutral buffered formalin (Fisher Scientific), paraffin embedded, and non-overlapping sections prepared and stained with hematoxylin and eosin (H&E) or Alcian blue. Severity of insulitis and colitis were graded as previously described (116, 117).
For thymus immunostaining, thymi were frozen in O.C.T. compound (Sakura Finetek USA) and 7μM sections cut. Sections were fixed and permeabilized in ice cold
acetone/methanol for 5 min, then washed in PBS. Thymus sections were stained with UEA-1*biotin (Sigma Aldrich) and Troma-1 (anti-cytokeratin-8) (Developmental Studies
Hybridoma Bank, University of Iowa) followed by Streptavidin*PE (eBiosciences) and AlexaFluor*488 goat anti-rat IgG (Invitrogen); each step was incubated 1 hr at room temperature. Montage thymus images were taken using a Zeiss Axioplan 2 microscope 10x objective, and analyzed with Slidebook software (Intelligent Imaging Innovations).
T cell analyses.
Cells isolated from the spleen, PLN, MLN and colon were stimulated with PMA (50ng/ml)/ionomycin (1g/ml)in complete RPMI 1640 medium at 370C for 4 to 5 hr and
Brefeldin A was included in the culture for the last 2 hr of incubation. Cells were washed, stained with Abs specific for CD4 (GK1.5), CD8 (53-6.7), CD3 (2C11) and TCR(H57).
After fixation and permeabilization using the Fixation/Permeabilization kit (eBioscience), cells were stained with Abs specific for intracellular IL-17 (TC11-18H10) and IFN
per the manufacturer’s instructions (eBioscience). T cells were stained as previously described (50) with in house prepared soluble IAg7 multimers covalently linked to BDC mimetic or HEL peptides or H2Kd tetramers complexed with IGRP or HA peptides (118, 119). Data were acquired with CyAn flow cytometer (DakoCytomation) and analyzed using FlowJo (Tree Star Inc.) or Summit (DakoCytomation) software.
Single cell suspensions were prepared from NOD.scid thymus recipients 6 wks post-transplantation and 5-10x105 cells/well cultured in triplicate in complete RPMI1640 and 100g/ml cecal bacterial lysate (CBL) (120) prepared from 6 wk-old NOD mice in 96-well round bottom plates at 37°C for 48 hr. The supernatants were harvested, and IFNand IL-17
measured using ELISA kits (eBiosciences) according to the manufacturer's instructions. For adoptive transfer experiments, splenocytes were harvested from NOD.scid
thymus recipients 6 wk post-transplantation and CD4+ and CD8+ T cells purified by negative selection using mouse CD4 or CD8 T Cell Isolation Kits (Miltenyi Biotec). Female
NOD.scid mice 6 wk of age were injected i.p. with 2x10⁶ T cells per mouse, and then monitored for diabetes, body weight and rectal prolapse. In some experiments T cells were labeled prior to transfer with CellTrace Violet (Life Technologies) according to the
manufacturer’s instructions.
Statistical analysis.
Results
Development of diabetes is restricted to a narrow postnatal thymic age.
Thymic structural organization differs with ontogeny; the newborn thymus is
characterized by small “islands” of medullary tissue whereas the medulla “coalesces” into a large, well organized structure with age (Figure 1A). To assess the ontogeny of cell-specific T cells, NOD.scid mice were engrafted under the kidney capsule with thymi from newborn and older NOD female mice, which represent different stages of T1D. Mature T cells were detected in the blood of thymus recipients as early as 1 wk post-implantation; by 4-6 wk ~40% of mononuclear cells consisted of CD4+ T cells in recipients of newborn and adult thymi (Figure 1B). The reconstitution of CD8+ T cells, however, was delayed in adult versus newborn thymus recipients (Figure 1B).
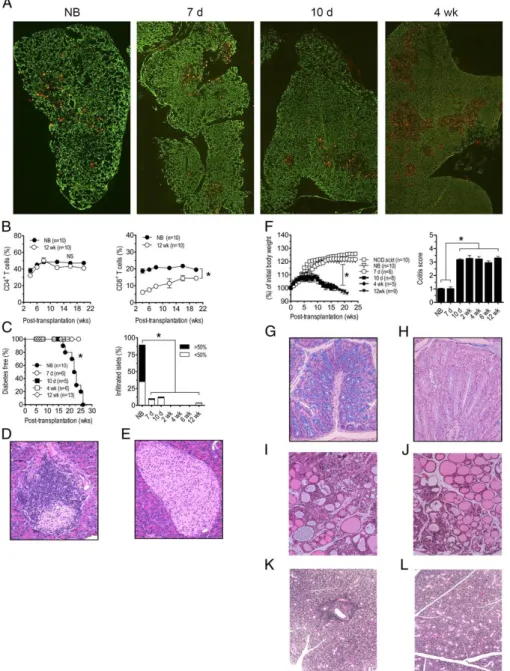
Overt diabetes was detected in all NOD.scid mice receiving newborn thymi, and islets exhibited significant insulitis indicating T cell-mediated cell destruction (Figure 1C,D,
Table I) Recipients of 7 and 10 d-old thymi remained diabetes-free; insulitis, however, was detected albeit at a reduced severity relative to newborn thymus recipients (Figure 1C, Table I). In contrast, NOD.scid recipients of thymi from 2 wk and older NOD donors failed to develop both insulitis and diabetes (Figure 1C,E, Table I). Similarly, the salivary gland and thyroid were infiltrated in recipients of newborn and 7 d thymi (Figure 1I,K) but not 10 d or older thymi (Figure 1J,L, Table I).
infiltration of the lamina propria by mononuclear cells, and the depletion of goblet cells in the crypts (Figure 1G,H). NOD.scid mice receiving newborn and 7 d thymi, however, exhibited only limited colitis and no weight loss or rectal prolapse (Figure 1F, Table I).
Adoptive transfer experiments confirmed the organ-specific nature of pathogenic T cells developing in the thymus recipients. Splenocytes isolated from recipients of newborn and 7 d thymi readily transferred diabetes but not colitis to NOD.scid mice (Table II). In contrast, splenocytes from animals receiving 10 d or older thymi developed colitis but not diabetes (Table II). Together these findings demonstrate that thymic development of
diabetogenic and colitogenic T cells are reciprocally regulated in an age-dependent manner. cell-specific Teff are increased in the PLN of newborn thymus recipients.
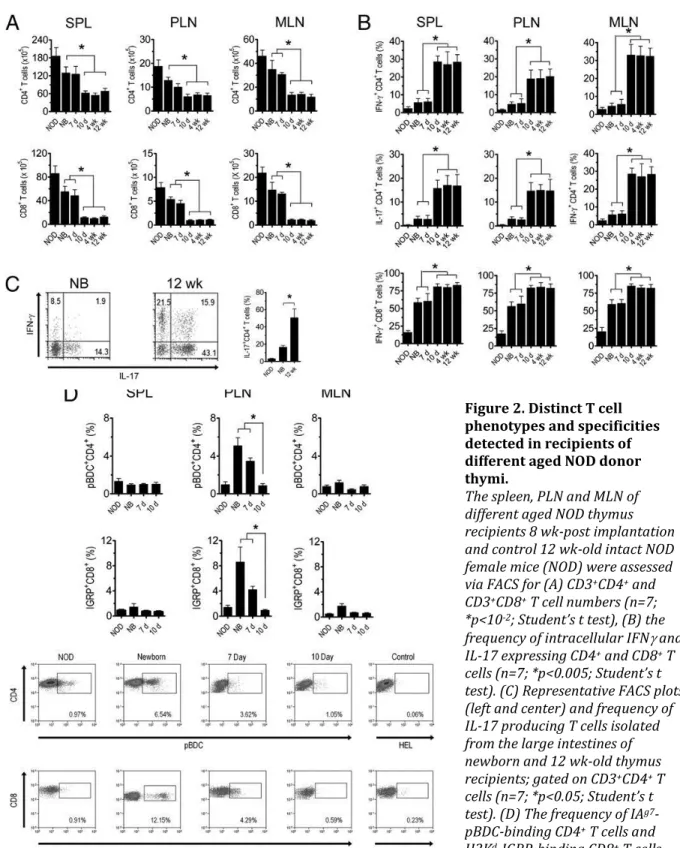
FACS analyses demonstrated that the number of CD4+ and CD8+ T cells was increased ~2 and ~3-fold, respectively, in the spleen, PLN, and MLN of recipients of newborn and 7 d old thymi versus 10 d and older thymi (Figure 2B).
The frequency of cell-specific CD4+
To examine temporal changes in antigen reactivity of colitogenic T cells, splenocytes prepared from thymus recipients were stimulated with CBL and IL-17 and IFN secretion measured. IL-17 and IFNsecretion in response to CBL was substantially increased in
cultures from animals receiving thymi from 10 d and older NOD donors (Figure 3A). CBL also induced IL-17 and IFNsecretion in cultures prepared from newborn and 7 d thymus
recipients albeit at significantly reduced levels (Figure 3A). CD4+ T cells alone from adult thymus recipients were sufficient to transfer diabetes (Figure 3B). The importance of T cell reactivity to colonic microbiota in the development of colitis was further demonstrated in NOD.scid recipients of thymi from 6 wk-old NOD.BDC2.5 versus NOD.BDC2.5.Cnull
donors. Severe colitis developed in NOD.scid recipients of NOD.BDC2.5 thymus (Figure 3C), in which T cells expressed both the BDC2.5 clonotypic and endogenous TCR. On the other hand, severity of colitis was markedly reduced in NOD.scid recipients when the specificity of NOD.BDC2.5.Cnull
CD4+ T cells was restricted to the cell autoantigen chromogranin A (122) (Figure 3C). Recipients of NOD.BDC2.5 (or NOD.BDC2.5.Cnull
)
thymi, however, developed diabetes (Figure 3D) indicating that colitis per se did not block
cell autoimmunity. In sum these results demonstrate that increased thymic development of
cell-specific T cells is restricted to a 7 d window after birth. Furthermore development of colitogenic T cells specific for microbiota is significantly increased at, and maintained after 10 d of age in NOD mice.
Thymus age-dependent development of diabetes is not due to changes in Foxp3+Treg and immunoregulation in the PLN of recipients.
autoimmunity in recipients of post-newborn thymi may also be due to a reciprocal increase in Foxp3+Treg residing in the PLN to block expansion of diabetogenic Teff. To distinguish between these two possibilities, the frequency of Foxp3+Treg was assessed in the spleen, PLN and MLN of thymus recipients. Interestingly, PLN Foxp3+CD25+CD4+ T cells were increased in newborn and 7 d versus 10 d and older thymus recipients, whereas the frequency of spleen and MLN resident Foxp3+CD25+CD4+ T cells was similar independent of thymic age (Figure 4A).To assess the immunoregulatory activity in the PLN, NOD.BDC2.5 CD4+ T cells were transferred into recipients of newborn and 4 wk thymi, and proliferation measured. No marked difference was detected in the level of NOD.BDC2.5 CD4+ T cell proliferation between the respective thymus recipients (Figure 4B).These results indicate that the block in cell autoimmunity in thymus recipients is not due to an increase in the Foxp3+
Treg pool or immunoregulation in the PLN, but attributed to reduced numbers of cell antigen-specific T
cells.
The temporal development of autoreactive T cells occurs in the absence of Aire expression.
Regulation of TSA expression by AIRE may contribute to the temporal thymic development of autoreactive T precursors. To test this possibility the pathology of NOD.scid
recipients transplanted with thymi from different aged NOD mice deficient in AIRE
expression (NOD.Airenull) was investigated. NOD.Airenull mice lack cell autoimmunity but develop multi-organ T cell-mediated inflammation (123), which includes exocrine
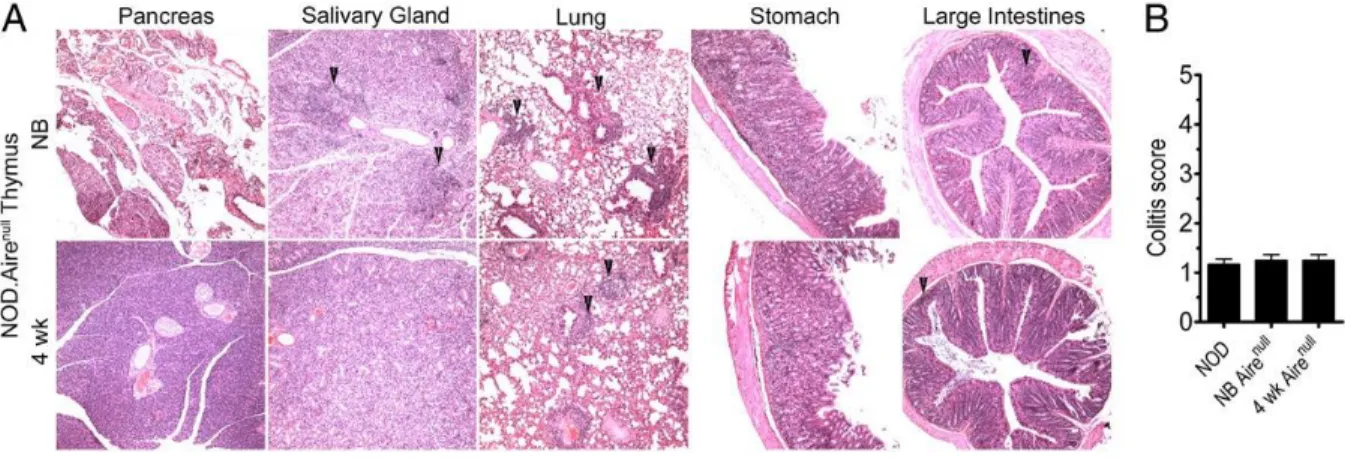
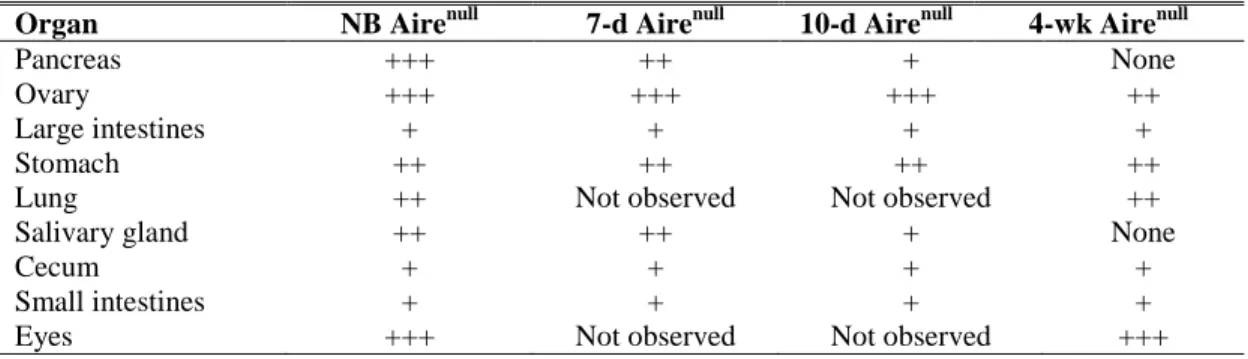
glands was detected in recipients of 7 and 10 d old NOD.Airenull thymi, and no infiltration of these tissues was observed in 4 wk-old thymus recipients (Figure 5ATable III). On the other hand, T cell infiltration continued to be detected in the eyes, ovaries, stomach and lungs of animals implanted with day 7 and older NOD.Airenull thymi (Figure 5A,B). The severity of colitis in the recipients, however, was limited regardless of NOD.Airenull thymi age (Figure 5B). These results demonstrate that temporal regulation of thymic development of
autoreactive T cells can occur in the absence of AIRE expression albeit for certain tissue-specificities and not others.
Discussion
The dynamics of and the parameters that influence thymic output of autoreactive T cells are poorly understood. To address these issues a thymus transplant model system was employed. This approach provides a “snapshot” of the specificities of autoreactive T cells produced in the thymus at a given age.
We demonstrate that thymic production of cell-specific T cells is regulated in a
temporal manner in NOD mice. Insulitis and diabetes developed in recipients of NOD newborn thymi (Figure 1C,D), which corresponded with an increased frequency of PLN-resident pBDC-specific CD4+ and IGRP-specific CD8+ T cells (Figure 2D), 2 major clonotypes associated with the progression of cell autoimmunity in NOD mice. These
results are consistent with findings demonstrating that NOD mice develop diabetes with normal kinetics and incidence despite thymectomy 3 d after birth, indicating that a sufficient pool of diabetogenic T cells is established early in ontogeny (49). Interestingly,
autoimmunity has been reported in immunodeficient children with congenital athymia
insulitis (Figure 1C) and the frequency of cell-specific T cells in recipients of 7 and 10 d old NOD thymi (Figure 2D). This reduction in cell-specific T cells was not due to a
reciprocal increase in the pool of PLN-resident Foxp3+Treg or enhanced tissue-specific immunoregulation that would be expected to block the expansion of diabetogenic Teff (Figure 4).Furthermore, colitis per se had no suppressive effect on cell autoimmunity. For
instance, both diabetes and colitis were detected in NOD.scid mice receiving NOD.BDC2.5 thymi (Figure 3C,D) or a mixture of splenocytes from colitogenic and diabetic donor animals (Appendix 1), showing that the progression of the 2 pathologies is independent and not mutually exclusive. Together these findings indicate that the lack of insulitis and diabetes, and reduced frequency of diabetogenic T cells in recipients of post-newborn thymi is the result of diminished thymic production of cell-specific T cells. Importantly, thyroiditis and
sialitis detected in newborn thymus recipients were also reduced in recipients of 7 and 10 d-old thymi (Figure 1I-L, Table I) demonstrating that thymic production of autoreactive T cells in general is regulated in an age-dependent manner.
To explain the temporal decline in autoreactive T cell production we favor a model in which the efficacy of thymic negative selection increases during postnatal life. Several mutually nonexclusive possibilities may account for this effect. Reduced expression of TSA due to limiting Aire expression may lead to inefficient thymic negative selection of
critical to block the multi-organ autoimmunity typical of NOD.Airenull mice (37). Our observation that recipients developed significant infiltration of the ovaries, stomach, lungs and eyes implanted with newborn and older NOD.Airenull thymi (Figure 5, Table III) supports a role for AIRE in the temporal development of these tissue-specific T cells. Strikingly, however, exocrine pancreatitis and sialadenitis failed to develop in recipients of thymi from 10 d or older NOD.Airenull donors (Figure 5, Table III) suggesting that AIRE-dependent TSA expression alone does not account for the observed temporal production of autoreactive T cells specific for these tissues.Age-dependent changes in the stimulatory capacity of the thymic APC pool, due to the number, composition and/or maturation status of mTEC and thymic DC may contribute to the efficiency of thymic negative selection (37, 98, 125, 126). Alternatively, the development of autoreactive T cells may reflect intrinsic
An interesting observation made in this study was that thymic development of colitogenic T cells was also temporally regulated. Negligible colitis was detected in
recipients of newborn and 7 d NOD thymi (Figure 1F). However, severe colitis developed in recipients of thymi from NOD donors 10 d of age and older (Figure 1F) which was marked by an increased number and frequency of IL-17 and IFN producing CD4+ T cells specific for CBL (Figure 2B). Unlike cell-specific T cells, which were selectively increased in the
PLN (Figure 2D), CBL reactivity was readily detected in all tissues examined (Figure 3A), likely reflecting systemic trafficking of a relatively large pool of colitogenic Teff.
Recognition of commensal microbiota antigen was necessary for colitis; recipients of thymi from NOD.BDC2.5.Cnull
donors which express chromogranin A-specific TCR (122) failed to develop significant colitis (Figure 3B). In contrast, increased colitis was detected in animals receiving thymi from adult NOD.BDC2.5 mice, which co-express transgenic and endogenous TCR (Figure 3B). These findings demonstrate that in addition to autoreactive T cells, the development of T cells specific for exogenous (e.g. microbial) antigens is regulated temporally, but in a reciprocal relationship to autoimmune T cells. In this instance,
production of T cells specific for microbial antigens is enhanced after postnatal life,
Since T cell reconstitution occurred under identical conditions in NOD.scid
recipients, lymphopenic expansion cannot explain the temporal development of autoreactive and colitogenic T cell repertoires. It is likely, however, that lymphopenia favored the
differentiation of pathogenic Teff driving autoimmunity and colitis. Development of
autoreactive T cells that is largely restricted to early ontogeny further underscores the role of peripheral mechanisms in maintaining life-long self-tolerance. Our findings may also in part explain the long-lasting and robust tolerance typically induced by administration of self-antigen to neonates (132-134). Here, deletion early in ontogeny would be expected to permanently purge the corresponding autoreactive clonotype(s) from the immune system.
In conclusion, our results demonstrate that thymic development of T cells specific for self and foreign antigens is tightly regulated over a short ontogenic time window. These findings also indicate that the pool of cell (and other tissue)-specific T cells is to a large
Figure 1. Reciprocal development of diabetes and colitis in NOD.scid recipients is dependent on the age of NOD donor thymus.
(A) Cytokeratin-8 (green, cortex) and UEA-1 (red, medulla) immunostaining of sections from newborn, 7 d-, 10 d-, and 4 wk-old NOD thymi; images were taken at 100X magnification. (B) NOD.scid mice were engrafted with thymi from newborn (NB) or 12 wk-old (n=10) NOD female donors and the frequency of CD4+ (left
panel) and CD8+ (right panel; *p<10-4) T cells measured in peripheral blood. (C) Diabetes (left panel; *p<10-4
versus recipients of 7 d or older thymi; Kaplan-Meier Log Rank) and the frequency of insulitis (right panel; n=8; *p<10-4; Student’s t test) in thymus recipients; representative H&E staining of pancreatic sections of
recipients of newborn (D) and 12 wk-old thymi (E). (F) Body weight (left panel; *p<10-4; 2-way ANOVA) and
colitis scores (right panel; *p<10-4; Student’s t test) of recipients (n=8) of different aged thymi and control
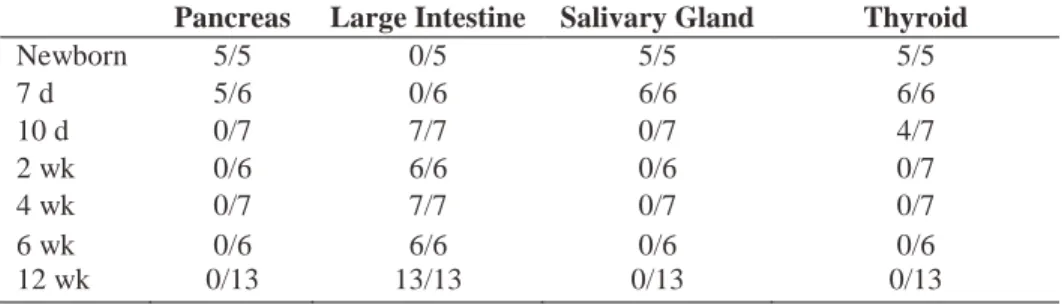
Table I. T cell infiltration of organs in NOD.scid recipients of different-aged NOD thymi.
Thymi from various-aged female NOD mice were transplanted under the kidney capsule of 6-wk-old NOD.scid recipients.
Pancreas Large Intestine Salivary Gland Thyroid
Newborn 5/5 0/5 5/5 5/5
7 d 5/6 0/6 6/6 6/6
10 d 0/7 7/7 0/7 4/7
2 wk 0/6 6/6 0/6 0/7
4 wk 0/7 7/7 0/7 0/7
6 wk 0/6 6/6 0/6 0/6
12 wk 0/13 13/13 0/13 0/13
Table II. Disease incidence in NOD.scid mice adoptively transferred with splenocytes from different-aged NOD-thymus recipients.
Diabetes Colitis
Figure 2. Distinct T cell phenotypes and specificities detected in recipients of different aged NOD donor thymi.
The spleen, PLN and MLN of different aged NOD thymus recipients 8 wk-post implantation and control 12 wk-old intact NOD female mice (NOD) were assessed via FACS for (A) CD3+CD4+ and
CD3+CD8+ T cell numbers (n=7;
*p<10-2; Student’s t test), (B) the
frequency of intracellular IFN and IL-17 expressing CD4+ and CD8+ T
cells (n=7; *p<0.005; Student’s t test). (C) Representative FACS plots (left and center) and frequency of IL-17 producing T cells isolated from the large intestines of newborn and 12 wk-old thymus recipients; gated on CD3+CD4+ T
cells (n=7; *p<0.05; Student’s t test). (D) The frequency of IAg7
-pBDC-binding CD4+ T cells and
H2Kd-IGRP-binding CD8+ T cells
with representative FACS plots from PLN isolated cells; gated on CD3+ and CD4+ or CD8+ T cells respectively
Figure 3. Colitogenic T cells respond to intestinal microbial antigens.
(A) Secretion of IFN and IL-17 by isolated T cells stimulated with CBL, as measured by ELISA, in the spleen, PLN, and MLN of recipients of different aged thymi 8 wk post-implantation (n=7; *p<10-4;
Student’s t test). (B) Splenic CD4+ and CD8+ T cells
isolated from NOD.scid thymus recipients 8 wk post-implantation, and adoptively transferred into NOD.scid mice, which were monitored for body weight loss (left panel; *p<0.05, 2-way ANOVA) and development of rectal prolapse (right panel; *p<0.05, 2-way ANOVA). (C) Representative colonic sections stained with Alcian blue, and colitis scores (*p<0.05; Student’s t test) and (D) diabetes incidence for recipients (n=5) of thymi from 6 wk-old NOD.BDC2.5 and NOD.BDC2.5Cnulldonors.
Figure 4. Development of diabetes is not due to increased Foxp3+Treg frequency or suppression.
(A) Frequency of Foxp3+CD25+CD4+ T cells in recipients of different aged NOD thymi (n=7) 6 wk-post
implantation or 12 wk-old intact NOD female mice (NOD). (B) In vivo proliferation of cell trace-labeled NOD.BDC2.5 CD4+ T cells 4 d post-transfer in the PLN of recipients of newborn and 4 wk-old NOD thymus 6
wk post-implantation or unmanipulated NOD.scid controls. Data is reported as proliferation index (left) with representative FACS histograms gated on CD3+CD4+cell trace+ T cells (right) (n=5). Error bars
represent SEM.
Figure 5. Temporal development of autoreactive T cells is independent of AIRE in some organs.
NOD.scid mice received thymi from different aged NOD.Airenull donors. (A) Representative H&E stained
sections of organs; arrows highlight areas of infiltration. (B) colitis scores of different aged NOD.Airenull
Table III. Relative T cell infiltration of organs in NOD.scid recipients of different-aged NOD.Airenull
thymi.
+++, Heavy/complete T cell infiltration; ++, moderate T cell infiltration; +, mild T cell infiltration.
Organ NB Airenull 7-d Airenull 10-d Airenull 4-wk Airenull
Pancreas +++ ++ + None
Ovary +++ +++ +++ ++
Large intestines + + + +
Stomach ++ ++ ++ ++
Lung ++ Not observed Not observed ++ Salivary gland ++ ++ + None
Cecum + + + +
Chapter 3: Altered T Cell Trafficking Following Antibody Mediated Crosslinking of the CD4 Coreceptor.
Introduction
T cell trafficking from lymph nodes into tissues or blood is a highly regulated process. Secondary lymphatics serve as a primary site for adaptive immunity. A distinct chemokine milieu and integrin expression profile help to maintain a non-inflammatory “standby” state (135, 136), such that T cells can probe for productive antigen interactions, and when absent, continue to traffic to additional lymph nodes. Dysregulation of appropriate trafficking cues and mechanisms can result in a failure to mount an efficient protective immune response, or in the development of a pathological response, associated for instance with autoimmunity. We recently reported that non-depleting antibodies specific for the CD4 (YTS177) and CD8 (YTS105) T cell coreceptor molecules induce remission in new onset diabetic NOD mice (50). Remission was accompanied by a reduction of T cell cellularity in both the pancreatic islets, and draining PLN. This “purging” event was independent of apoptosis induction and was attributed to altered trafficking properties of the pancreas and PLN resident CD4+ and CD8+ T cells. The mechanisms involved in T cell purging from the PLN induced by co-receptor therapy remain unclear.
endothelial cells by T cells (135, 138). Steady state T cells have a rounded morphology with evenly distributed CKRs and adhesion molecules (135, 139). Upon a productive encounter in lymph nodes, T cells and APCs form an immunological synapse, where T cells recognize cognate antigen via interactions of the TCR and the peptide-MHC complex (62, 137). Additional costimulatory signals, and engagement of the CD4 or CD8 coreceptors, are required for full T cell activation (140). Phosphorylation of LCK at tyrosine 394 (63) located at the intracellular region of CD4 or CD8 is an early event contributing to downstream TCR signaling. Once activated the cell membrane is polarized and T cells egress from lymphatics (138). In the absence of a productive APC:T cell interaction, T cells exit the lymph nodes and enter circulation in response to elevated blood levels of S1P (141), followed by re-entry into lymphatics.
polarized T cell, which allows extension of the leading edge, ultimately pulling the T cell forward or allowing for T cell scanning of APC (61). The trailing pole of a T cell is comprised of the “uropod”, where adhesion molecules such as ICAM-1, CD43, and CD44 localize (144, 146).
The T cell specific pleomorphic effects of Rac activation include: lymphoid egress or entrance, circulation in blood and lymphatics, or entry into target tissues (61, 147, 148). The different outcomes of Rac activation are contextual, but can at least partially be attributed to the activating GEF. For instance, Rac activation as a result of the GEF Dock2, has been reported to promote T cell homing to lymph nodes (149), whereas Tiam1 mediated Rac activation is implicated more specifically in T cell adhesion and transendothelial migration (70). While over 70 GEFs have been identified (150), those identified in the context of T cell activity belong to the Sos, Vav, Tiam, and Dock families (66, 68-70, 72, 73).
Materials and Methods
Preparation of recombinant proteins
pGEX GST-PBD and pGEX GST-RhoAG17A fusion proteins were prepared from lysates from Bl21 Escherichia coli cells induced with 100 µM IPTG for 16 hours at RT. For GST-PBD, bacterial cells were lysed in 20 mM Tris pH 7.8, 1% Triton X-100, 10 mM MgCl2 1 mM DTT, 1mM PMSF, and 10 µg/ml aprotinin and leupeptin. For GST-RhoAG17A
bacterial cells were lysed in 20 mM HEPES pH 7.8, 150 mM NaCl, 10 mM MgCl2, 1mM PMSF, and 10 µg/ml aprotinin and leupeptin. The recombinant proteins were isolated from the bacterial lysates by incubating with glutathione-Sepharose 4B beads (GE Healthcare) at 4oC for 4 hours. The beads were sedimented and washed 3 times in 20 mM HEPES, pH 7.5; 150 mM NaCl, 1 mM DTT.
GST-PBD and GST-RhoAG17A Pull-down Assay
Western Blotting
Samples were run on SDS-PAGE gels and transferred to polyvinylidene fluoride membranes (Millipore). Membranes were blocked and incubated with the specified primary antibodies followed by species-specific secondary antibodies conjugated with horseradish peroxidase. Blots were developed with a chemiluminescent HRP substrate, and visualized on x-ray film or ChemiDoc™ MP System (BioRad) and corresponding software. For
quantification, blots were scanned and the intensity values determined using Image J software (NIH) and protein levels were normalized to control protein levels. All quantification graphs include ≥3 independent experiments. Error bars represent SEM.
Immunoprecipitation
Cells were lysed in preheated gel sample buffer containing 200 mM Tris pH 6.8, 20% glycerol, 4% SDS and 5% 2-ME, and boiled for 5 minutes and sheared with needle. Samples were then diluted with 20 volumes of 20 mM Tris, pH 7.5, 150 mM NaCl, 1% Triton X-100 and 1% DOC, 10 µg/ml othrovanidate 1mM PMSF, and 10 µg/ml aprotinin and leupeptin, 2 μg of PY-20 mAb anti-phospho-tyrosine antibody for 2 hours at 4o
C. Protein G-Sepharose was then added and samples were rotated for 2 hours at 4oC. Beads were then washed in dilution buffer and analyzed by western blotting. All quantification graphs include ≥3 independent experiments. Error bars represent SEM.
Transendothelial migration assay
S1P (Sigma) or 100 µM CXCL12 (Sigma) at 37°C and 5% CO2. An input control was taken. Cells in the lower chamber for each condition were collected and counted by flow
cytometery.
Mice
NOD/LtJ mice were bred and maintained in specific pathogen-free facilities at the University of North Carolina at Chapel Hill (UNC-CH). All animal experiments were approved by the UNC-CH Institutional Animal Care and Use Committee.
Antibody preparation and treatment
The YTS177.9 hybridoma was a gift from Dr. Waldmann (Oxford, U.K.). Antibody was purified via ammonium sulfate precipitation from culture supernatants.
12 week old prediabetic female NOD mice were given intraperitoneal injection (IP) with 600 g YTS177 or the 2A3 rat IgG2a isotype control (BioXCell).
Treatment with inhibitors
Ly294002 (LC Laboratories): Mice were injected IP with 75mg/kg 6 hours prior to YTS177 or isotype treatment. An additional dose of Ly294002 was given daily until mice were euthanized. NSC237666 (Santa Cruz Biotechnology): Mice were injected IP with 3mg/kg 2 hours prior to YTS177 or isotype treatment. An additional dose of NSC237666 was given every 12 hours until mice were euthanized.
Primary cell isolation
Spleen and PLN suspensions were made by mechanical dissociation using frosted glass slides. Single cell suspensions were made by filtering suspensions through a 40 M
Lympholyte M (Cedarlane). Primary mouse pulmonary endothelial cells (EC) were isolated from 1 week old NOD mice as described in Sobczak et al. (154) and grown in EGM-2 Bullet Kit (Lonza).
Flow cytometry
Cells were stained with anti-CD3 (145-2C11), anti-CD62L (MEL-14), anti-CD4 (RM-4-5), anti-LFA-1 (M17/4). When appropriate, cells were fixed with 1.5%
paraformaldehydediluted in FACS buffer. Flow cytometry data was acquired at the UNC-Flow Cytometry Facility using the Cyan (DakoCytomation) cytometer and analyzed with Summit (DakoCytomation).
Microscopy
Tissues were homogenized as previously described directly in 1.5%
paraformaldehydediluted in 2% FBS containing PBS. Cells were stained with anti-CD3 (145-2C11), anti-LFA-1 (M17/4), Phalloidin Alexa 488 (Life Technologies). Confocal microscopy data was acquired at the UNC-Microscopy Services Laboratory using the Olympus FV500 Confocal Laser Scanning microscope. Image analysis was completed using Image J software (NIH).
Statistics
Results
Antibody mediated CD4 binding results in T cell egress from the pancreatic lymph nodes.
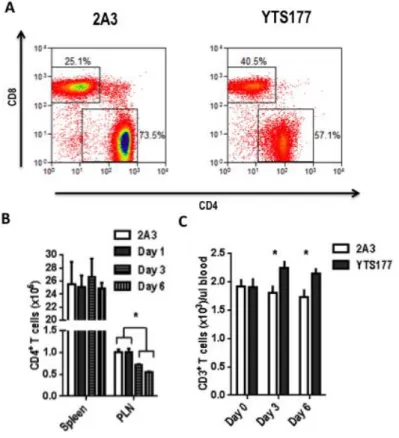
We have previously reported that treating new onset diabetic NOD mice with non-depleting anti-CD4 (YTS177) and anti-CD8 (YTS105) antibodies results in diabetes remission (50). Reversal of diabetes is mediated in part by purging of CD4+ and CD8+ T cells from the pancreas and PLN. To define the short-term effects of coreceptor crosslinking, 12 week old pre-diabetic NOD mice were administered 600 g of either YTS177 or 2A3 (an
isotype control), and 1, 3, or 6 days later, T cells in the spleen and PLN analyzed by flow cytometry (Figure 6A). Following YTS177 treatment, CD4+ T cells migrated from the PLN between days 1 and 3 post-treatment, reaching maximum egress by day 6 (Figure 6B). No reduction was observed in CD4+ T cell numbers in the spleen within 6 days post treatment. The YTS177-mediated decrease in PLN was concomitant with a temporal increase in CD4+ T cells in blood (Figure 6C).
Migration of T cells from lymph nodes into blood is controlled by S1P levels in circulation interacting with the S1P receptor (S1Pr) on T cells (141). To determine if
YTS177-bound CD4+ T cells have increased reactivity to S1P, an in vitro transwell approach was utilized. Chemotaxis in response to S1P across a 5 m transwell was increased in a dose
on the surface of the transwells. Endothelial cells provide receptor-ligand interactions, as well as junctions for T cells to traffic through. Albeit reduced, under these more stringent conditions, the frequency of YTS177 treated CD4+ T cells migrating across the endothelial coated transwells was increased ~3-fold relative to CD4+ T cells from 2A3-treated animals (Figure 7D). Increased migration of YTS177 treated T cells towards S1P was not due to upregulated S1Pr expression, as no difference in receptor surface expression was observed following YTS177 treatment (Figure 7F). Increased chemotaxis by YTS177-treated T cells was also observed in response to CXCL12 (SDF-1) (Figure 7E). Notably, under all of the experimental conditions tested, CD8+ T cell chemotaxis was unaltered demonstrating the specificity of the effects of YTS177 binding to CD4 (Figure 7). Taken together, these results suggest that CD4+ T cells exhibit an enhanced migratory phenotype after YTS177 treatment, which is not specific to the chemotactic cues of just one chemokine.
Increased migration is a function of T cell polarization.
T cell polarization results in clustering of CKRs to the leading edge, which in the absence of CKR upregulation allows for greater sensitivity to chemotactic cues. T cell polarization was examined via confocal microscopy. Consistent with characteristic
polarization, increased localization of F-actin and LFA-1 to the leading edge, as well as an altered, oblong morphology was observed 6 hours post YTS177 treatment (Figure 8A). Forty eight hours post YTS177 treatment, immediately prior to lymph node egress, T cell
Retention and entry of T cells in lymph nodes is adhesion molecule dependent, specifically the expression of the integrin LFA-1 and the selectin CD62L. Six hours post YTS177 treatment, a reduction in LFA-1 expression was detected (Figure 8D) suggesting a reduction in lymph node retention (155). A reduction in CD62L expression was also seen by 6 hours post YTS177 treatment (Figure 8E), suggesting reduced potential for entry into lymph nodes. Together these data suggest a phenotypic change in T cells resulting in a polarized and migratory phenotype directed out from lymphatics and into circulation.
Signaling downstream of CD4 engagement results in a pro-migratory phenotype.
T cell polarization is controlled by activation of the small RhoGTPase Rac1 and Rac2. To investigate the mechanism of T cell polarization and migration as a result of CD4 engagement, activation of Rac1 and Rac2 in T cells isolated from the PLN of YTS177 or 2A3 treated NOD mice was assessed. A temporal increase, reaching a maximum of ~3 and ~8-fold for Rac1 and Rac2 activation, respectively, was detected by 6 hours post treatment with YTS177 versus 2A3 (Figure 9A).
T cell egress from lymph nodes and migration into circulation requires T cell polarization; circulating cells do not require polarization, as such, should not exhibit Rac activation. To determine if the effect is specific to lymph nodes, we compared Rac activation of lymph node and spleen derived cells from YTS177 and 2A3 treated mice. No significant difference in the activation of either Rac1 or Rac2 was observed in the spleen of YTS177 versus 2A3 treated animals (Figure 9) consistent with the lack of T cell purging in the spleen (Figure 6B).
molecule of the CD4 coreceptor. LCK can be found in an active state, characterized by its phosphorylation at tyrosine 394, or an inactive state exhibiting phosphorylation at tyrosine 505 (157). Six hours post YTS177 treatment, active LCK was reduced with a concomitant increase in the inactive form (Figure 10A). LCK has been shown to initiate the TCR signaling cascade; therefore reduced kinase activity by LCK would result in a reduction of TCR signaling. Reduced LCK activity suggests the classical model of Rac activation through TCR signaling would not apply, as such, an alternate pathway must be responsible.
To determine the upstream GEF responsible for Rac activation after YTS177 treatment, a Rac.G15A pulldown was performed, which serves to isolate all activated Rac GEFs. No increase following YTS177 treatment was detected in the activity of Vav1, Vav2, or Dock2, which are GEFs normally associated with T cell Rac activation (Figure 10B). To identify the Rac GEF mediating YTS177-induced Rac activation, the Rac GEF inhibitor NSC237666 was utilized. This inhibitor blocks activation of Rac1 by a specific family of GEFs that includes Tiam1 and Trio. NSC237666 had no marked effect on YTS177-induced purging of CD4+ T cells in the PLN (Figure 10C). These data indicate that the class of GEFs inhibited by NSC237666, including Tiam1 and Trio, play no role in Rac activation and the downstream migratory phenotype we observe after YTS177 treatment.
Phosphoinositide 3-kinase (PI3K) signaling in T cells is associated with a number of events including T cell migration and activation of T cell-associated GEFs such as Vav, Sos, Dock, and Tiam. Accordingly, the effect of the PI3K inhibitor Ly294002 on
provided us with evidence that the observed migratory phenotype following YTS177 treatment was independent of PI3K activation and that the involved GEF was not reliant on PI3K activity.
Discussion
We provide evidence that CD4 crosslinking can have marked effects on the trafficking properties of T cells by: 1) promoting Rac1/2 activation and membrane
polarization, 2) downregulating surface adhesion molecules, and 3) enhancing reactivity to chemokines such as S1P and CXCL12.
Sequestration of adhesion molecules and CKR to the poles of T cells is characteristic of T cell polarization and is typically associated with enhanced cellular migration. Although receptor clustering was not investigated, we observed clustering of adhesion molecules and cytoskeletal changes consistent with T cell polarization (Figure 8A,B). Literature describes a role for both Rac1 and Rac2 in the polarization and migration of T cells in response to activation cues (61, 147). Our demonstration of increased Rac activation within hours after antibody mediated CD4 crosslinking would suggest an increased migratory capacity. The mechanisms of Rac mediated migration are known to be via cytoskeletal changes and T cell polarization (61). Consistent with this, we observed increased Rac activation and polarization within 6 hours post YTS177 treatment, which in the case of polarization becomes statistically different from isotype control treated T cells within 48 hours post treatment. T cell
where in the case of T cell activation, an inflammatory environment would be present to immediately direct T cells to target tissue. In the case of antibody mediated crosslinking of CD4, we hypothesize that only by 2 days post treatment has a sufficient shift in the
chemokine gradient occurred towards circulation to warrant lymph node egress. In short, T cells are primed to migrate early after treatment, but in the absence of a sufficient directional cue, remain in the lymphatics.
In addition to polarization, Rac is associated with expression of the integrin LFA-1, which controls T cell:DC and T cell:endothelial interactions via association with its ligand ICAM-1 (55). T cells from LFA-1 knockout mice exhibit accelerated egress from lymph nodes, and as such have reduced numbers in peripheral lymph nodes (155). LFA-1 blockade results in populations of T cells exiting the lymph nodes and entering blood (159). Following YTS177 treatment, we observed a systemic CD4 specific downregulation of LFA-1.
Although the mechanism of LFA-1 blockade mediated egress is unclear, the importance of further investigation is highlighted by the fact that this approach is currently being
investigated for clinical use in the context of islet transplantation tolerance (160). While it has been described that LFA-1 plays a central role in lymph node entry and egress (155), mechanisms remain ill defined. Our model provides insight into the potential upstream and downstream mediators of LFA-1 activity.
molecules LFA-1 and CD62L interacting with their respective ligands ICAM-1 and GlyCAM-1 (161), among others. The importance of CD62L in the entry of T cells into lymphatics is highlighted by the fact that CD62L deficient mice exhibit deficiencies in homing to lymph nodes (162). The observed systemic decrease in CD62L expression following YTS177 treatment may play a role in preventing T cell extravasation and re-entry into lymph nodes. Together, these data would support a model where T cells exit the
lymphatics and are then unable to return and therefore remain in circulation.
The current model of Rac-mediated T cell polarization and migration is dependent on TCR activation. The inactivation of LCK (Figure 10A) suggested an alternative signaling pathway induced by CD4 upon YTS177 binding. A similar result was reported following HIV gp120 binding to CD4 (163), where increased Rac activation was observed; other studies have also shown that gp120 binding inactivates the TCR signaling cascade (164). While we cannot conclude that the downstream signaling resulting from antibody and gp120 binding are identical, it provides support of an inactivating TCR signal resulting in Rac activation. Additionally, we have demonstrated Rac activation independent of the GEFs Vav1, Vav2, Trio, Dock2, and Tiam1, those normally implicated in T cell activation dependent migration (66, 68-70, 72, 73). Taken together, these data provide evidence of an alternate pathway to T cell polarization and migration.
within 6 hours after CD4 crosslinking. Although we were unable to identify the GEFs activating Rac, we are able to rule out those normally associated with Rac activation in the context of positive/activating TCR signaling. Taken together, our data supports a model where antibody mediated CD4 engagement causes downstream signaling independent of the TCR, resulting in Rac activation. Rac acts as a molecular switch, ultimately turning on a migratory program in T cells, resulting in their egress from lymph nodes and into circulation, and that a loss of adhesion molecules results in their inability to re-enter lymphatics (Figure 12).
T cells searching for activation through cognate antigen recognition continually migrate between circulation and lymph nodes. Activation of CD4+ T cells typically occurs in the lymph nodes and results in T cell polarization. Likewise, a lack of TCR activation also results in T cell polarization and mobilization. The ultimate action of T cells is context dependent, in the case of an immune response, T cells enter target tissues, in the absence of an immune response, T cells enter circulation. The primary difference between the two scenarios, outside of T cell activation, is the surrounding cytokine environment and chemokine gradient. Regardless of inflammatory state, T cells are primed for directed movement. The ability to control T cell polarization and migration provides a unique approach to control a pathological inflammatory response associated with autoimmunity for instance. Indeed, co-treatment with non-depleting anti-CD4 and -CD8 antibody is highly effective at suppressing ongoing cell autoimmunity and reversing diabetes in NOD mice.
across transwells following the knockdown of Rac via lentiviral expression of shRNA. We will also further investigate the TCR independent nature of polarization and migration by utilizing the upstream TCR signaling inhibitor Desatineb, which inhibits LCK activation, as well as the downstream TCR signaling inhibitor FK506, which inhibits calcineurin. We are confident that future data will continue to support our model of alternative pathway
activation of Rac resulting in T cell polarization and lymph node egress.
Figure 6. T cells migrate from lymph nodes and enter circulation following administration of YTS177.
Figure 7. CD4+ T cells exhibit increased sensitivity to chemokines after YTS177 treatment.
Figure 8. PLN derived T cells rapidly adopt a polarized phenotype following YTS177 treatment.