THE DEVELOPMENT AND IMPLEMENTATION OF MICROSCOPY STRATGIES FOR INVESTIGATING PROTEIN DIFFUSION AND CHROMATIN BINDING
Michael August Tycon
A dissertation submitted to the faculty of the University of North Carolina at Chapel Hill in partial fulfillment of the requirements for the degree of Doctor of Philosophy in the
Department of Chemistry
Chapel Hill 2013
Approved by:
Christopher Fecko
Nancy Allbritton
Dorothy Erie
Linda Spremulli
ii ©2013
iii ABSTRACT
Michael August Tycon:
The Development and Implementation of Microscopy Strategies for Investigating Protein Diffusion and Chromatin Binding
(Supervised by Dr. Christopher J. Fecko)
Nearly all cellular processes, notably transcription, translation, and genomic repair, are enacted by multiprotein complexes that coalesce into functional assemblies in response to constantly fluctuating cellular demands. A complex interplay of endogenous and exogenous cellular cues regulates the assembly and activity of these complexes by both active and passive mechanisms, with a current fundamental dilemma in the field of molecular biology being the elucidation of the mechanisms governing the assembly of these supramolecular complexes. Such complexes arise through two processes, the nucleation of macromolecular assemblies and target binding site recognition. Collectively, this phenomenon is anthropomorphized
as“protein recruitment”, yet this term conceals the underlying physical interactions that govern the spatiotemporal formation of such assemblies, turning protein activity into a series of “black boxes” with prescribed functions. In response to this overarching question, microscopy
iv
Methods were developed enabling the observation of model systems of complex recruitment dynamics and have been used to illustrate paradigms of biological function. An initial effort was focused on designing optical systems for observation of DNA repair protein diffusion. The ability to generate user-defined DNA photolesions in real time, a highly characterized binding site of many classes of DNA repair proteins, creates opportunities for optical imaging experiments in which protein behavior before and after a biological
perturbation can be observed. To this end a two-photon DNA damage method was developed, which enabled the production of UV-type DNA photolesions by blue light and is highly
compatible with conventional laser-scanning optical microscopy configurations. This visible light damage method was compared to alternative damage induction processes, and the advantages of the two-photon method enumerated.
Continuing towards an integrated system for observing protein diffusion, a popular single-molecule imaging DNA immobilization and visualization technique was characterized. In this work, the extent of optically-induced DNA binding site artifacts was established with a unique pairing of a widefield microscopy based single-molecule and gel electrophoresis based ensemble biochemical DNA damage assays. The results indicated that many commonly used DNA visualization practices, from imaging parameters through fluorescent intercalaters, lead to extensive photodamage and can perturb native DNA-protein interactions.
v
diffusion of RNA Polymerase II subunits in live cell nuclei. The findings substantiate a hybrid model of macromolecular assembly in which a broad distribution of macromolecular species allow for mechanistic flexibility in the assembly of transcription complexes. This provides evidence for further speculation on mechanisms controlling gene expression.
vi
To my parents, friends, and teachers
To Uncle Marty, the first person to teach me that a doctor is not necessarily an MD To Miss Belle for giving me a reason to stick around
To my departed Firebird which brought me from Canada to North Carolina &
vii
ACKNOWLEDGMENTS
“If you try and take a cat apart to see how it works, the first thing you have on your hands is a non-working cat”
-Douglas Adams
The modern world of highly interdisciplinary scientific research cannot occur alone in an intellectual vacuum, much to the chagrin of those that prefer to work holed up in a dark room. Rather, it requires intellectual and practical collaboration at every step, in a mutualistic
relationship in which all should benefit from the synergy of talents. In the same vein, this truth applies to the education that molds such researchers, in which learning is a partnership
between students and teachers, both friends and professors. To this end, there are many people I would like to thank whom either contributed to my intellectual development, directly assisted me in my research, or helped keep me sane throughout my time in the chemistry department of the University of North Carolina.
Foremost, I would like to thank my advisor, Dr. Christopher J. Fecko. We collectively gambled on each other and I like to think we both learned a great deal along the way. Whether through the sheer amount of time we have spent together or the efficiency of his teaching over the past five years, he has helped to shape my understanding of the scientific method and made me into a better (more skeptical) scientist. No one that spends any amount of time with Chris cannot come to appreciate his critical reasoning and the extent of his academic insight- I hope some of this has rubbed off on me.
viii
No mention of my graduate school career would be complete without a nod to the usual incoming class of analytical students in 2008. We were and still are a neurotic, OCD-laden, and resourceful bunch. They said we were too slow for graduate school but too dumb to quit, and that has been largely accurate. In particular, my best-wishes go out to Natalie Bjorge and Joe Gateri. My first three years at UNC would have been a dull and sober place were it not for the antics of Miss Bjorge. As for Mr. Gateri- with how many people can you have an entire
conversation in movie quotations?
Foremost among the class of UNC Chemistry 2008, my affections and many thanks to the lovely Miss Anna M. Belle. She is a wonderfully neurotic and quirky girl,quick to carry other people in times of distress while slow to ask for help herself. You have been a constant source of support throughout the mess that has been the past five years. Thanks for the early morning goodnight calls and remember to sit back and relax sometimes. My tailgate is always down for a drink.
The past five years would be much less memorable were it not for Pasha Takmakov, Paul Walsh, Richard Kiethley, and Scott Nichols. Thank you all for the intellectual and social contributions to my well-being. Additionally, I would like to thank Holly Wolcott and Punya Navaratnarajah for assistance in troubleshooting difficult experimental techniques at great expense to their own time.
I did not get to graduate school through my handwork alone and would like to thank the many people who helped before I arrived at UNC. For me, my pursuit of scientific knowledge has always been accompanied by friends. My McGill crew closed the library down on many an occasion, and Amir Amiri and Jordan Wilson were always there besides me on the late nights. Further, my thanks go out to both Professor Eric Salin and Professor David Burns. Collectively, you both believe in a meritocracy, recognized my abilities, and gave me my first chance at research.
Anytime I recollect on those that have helped shape my appreciation for science and mold my work ethic, my thoughts immediately conjure up my high school biology and chemistry teachers- Mrs. Mary Jane Roethlin and Mrs. Morturano. I am likely still trying to impress you both and never have been able to pick a favorite subject.
I would like to thank my sister, Laura, for needling me during my graduate school career and goading me to the finish line. Finally, my gratitude and love to my parents, Joseph and Mary Tycon. You both always seemed to effortlessly cultivate a spirit of creativity and
ix
Table of Contents
LIST OF TABLES ... xiii
LIST OF FIGURES ... xiv
LIST OF ABBREVIATIONS ... xvii
CHAPTER 1 INTRODUCTION What is Protein Recruitment and how do We Study it? ... 1
Differing Systems to Study Protein Recruitment ... 1
Strategies to Investigate Protein-Target Binding Site Recognition ... 3
1. Protypical DNA Damage Repair Pathway ... 3
2. Optically Manipulating DNA ... 4
3. Designing a Platform for the In Vitro Study of Repair Pathways ... 6
4. Sensitized Methods of Photochemical DNA Damage Induction ... 7
Strategies for Investigating the Assembly of Macromolecular Complexes ... 10
1. Models of Macromolecular Protein Assembly Dynamics in Cell Nuclei ... 10
2. Mechanism Evaluation: Choosing the Right Time and Place ... 12
Research Aims and Scope ... 14
References ... 15
CHAPTER 2 GENERATION OF DNA PHOTOLESIONS BY TWO-PHOTON ABSORPTION OF A FREQUENCY-DOUBLED TI:SAPPHIRE LASER Overview: ... 19
Introduction ... 20
Materials and Methods ... 22
1. Materials ... 22
2. DNA sample preparation ... 23
x
4. UV irradiation ... 25
5. Femtosecond laser irradiation ... 25
Results and Discussion ... 28
1. Development of a QPCR assay of DNA damage ... 29
a. Conditions for quantitative PCR ... 30
b. Statistical treatment of randomly distributed DNA photolesions ... 33
2. UV-induced DNA photodamage ... 35
3. Two-photon absorption-induced DNA photodamage ... 38
Conclusion ... 47
References ... 48
CHAPTER 3 QUANTIFICATION OF DYE-MEDIATED PHOTODAMAGE DURING SINGLE-MOLECULE DNA IMAGING Overview: ... 51
Introduction ... 52
Materials & Methods ... 54
1.Observing double-strand photocleavage using flow-stretched DNA ... 54
a. Surface functionalization, microfluidic chamber fabrication, and DNA substrate preparation ... 54
b. DNA staining and injection for SMI ... 56
c. Single-molecule imaging ... 56
d. Radical scavenger buffer preparation ... 57
2.Single-molecule image processing ... 57
3.Ensemble DNA damage assay... 58
a. Bulk DNA sample preparation ... 58
b. Bulk sample irradiation ... 59
c. Gel electrophoresis ... 59
4.Ensemble damage assay: Ascorbic acid mediated DNA degradation ... 59
5.Gel quantification ... 60
Results ... 60
1. Double-strand photocleavage of individual DNA molecules ... 60
2. Ensemble study of single and double-strand photocleavage ... 65
xi
a. Modeling for DNA cleavage ... 68
b. Fitting ensemble data ... 74
c. Fitting double-strand photocleavage of flow-stretched DNA ... 77
d. Effect of scavengers ... 79
e. Extrapolation between SMI conditions and ensemble studies ... 80
4. Degradation of DNA by ascorbic acid ... 80
Discussion ... 83
Conclusion ... 87
References ... 89
CHAPTER 4 RNA POLYMERASE II SUBUNITS EXHIBIT A BROAD DISTRIBUTION OF MACROMOLECULAR ASSEMBLY STATES IN THE INTERCHROMATIN SPACE OF CELL NUCLEI Overview: ... 91
Introduction ... 92
Materials and Methods ... 98
1.Fly Strains ... 98
2.Salivary Gland Extract Preparation ... 98
3.Two-photon microscopy configuration and FRAP Procedures ... 99
Results ... 100
1.Automated “shotgun ptFRAP” data collection ... 100
2.Different recovery dynamics observed for RNAPII subunits ... 101
3.Confirming the distribution of heterogeneous RNAPII subunit complexation states ... 108
4. Distribution modeling: decomposing apparently anomalous recovery curves into components exhibiting Brownian diffusion ... 110
Discussion ... 117
1.A new perspective for in vivo diffusion: apparent anomalous diffusion ... 117
2.RNAPII distributions indicate an intermediate assembly mechanism ... 122
Conclusion ... 126
References ... 128
CHAPTER 5
xii
Overview: ... 131
Introduction ... 131
Computations ... 133
1.The Distribution Model: ... 133
2.Distributions of Diffusing Species: ... 134
3.Incomplete FRAP Recovery Simulations ... 135
Results and Discussion ... 138
1.Accuracy of Predicting a Binary Mixture ... 144
2.Accuracy of Predicting a Biologically Relevant Distribution ... 144
3.Accuracy of Predicting a Binary Mixture with an Artificial Immobile Fraction ... 145
4.Accuracy of Predicting a Gamma Distribution with an Artificial Immobile Fraction ... 146
Conclusions ... 150
References ... 151
APPENDIX A: QUANTIFICATION OF GEL ELECTROPHORESIS DATA USING FOUR GAUSSIAN PEAKS TO OVERCOME BACKGROUND HETEROGENEITIES ... 152
APPENDIX B: AUTOMATED QUANTIFICATION OF DNA MOLECULE STRAND CLEAVAGE ... 172
APPENDIX C: AUTOMATED “SHOTGUN PTFRAP” IMAGING PROCESSING PROGRAMS ... 185
APPENDIX D: SUPPORTING INFORMATION FOR THE CHAPTER 4 ... 189
1.High expression levels of fusion proteins are not responsible for the observed anomalous diffusion ... 189
2.Determining the resolution of the Point FRAP method ... 192
3.Establishing the robustness of the Distribution model on experimental data ... 195
4.Slow Diffusion Components under the FRAP resolution method are not required for an accurate fit ... 198
5.FRAP fitting results for each dataset ... 200
xiii LIST OF TABLES
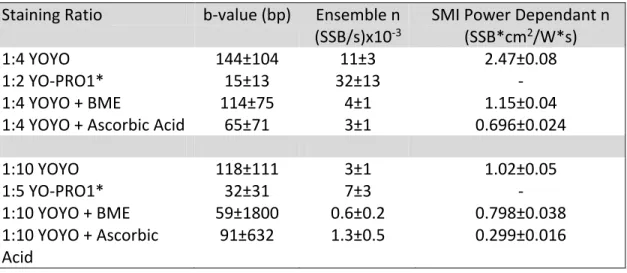
Table 3.1- Characteristic parameters describing the single strand breakage rates by imaging condition ... 78
xiv
LIST OF FIGURES
Figure 2.1-Schematic diagram of the irradiation apparatus. ... 27
Figure 2.2-Detection of DNA photolesions using quantitative PCR. ... 32
Figure 2.3- Poisson statistics are required to determine the number of DNA lesions from the quantitative PCR assay ... 34
Figure 2.4- UV dose dependent lesion formation. ... 37
Figure 2.5- Power-dependent damage produced by irradiation of DNA samples with focused femtosecond pulses at 425 nm, 450 nm and 475 nm. ... 42
Figure 3.1- SMI strand cleavage assay and damage quantification for flow-stretched, YOYO- stained lambda DNA at a dye to nucleotide ratio of 1:4. ... 63
Figure 3.2- Ensemble breakage assay and damage quantification. ... 67
Figure 3.3- Stochastic DNA damage model and fitting of the ensemble data. ... 70
Figure 3.4- Comparison of the single-strand breakage rates (n) obtained by fitting results of the ensemble (A) or the SMI (B) damage assays to the stochastic DNA damage model. ... 76
Figure 3.5- Extrapolation of the intensity-dependent SMI single-strand breakage rates to the laser intensity used for the ensemble measurements. ... 82
Figure 3.6- Ascorbic acid mediated DNA Damage. ... 84
Figure 4.1- Image Collection and Automated Processing Methodology “Shotgun ptFRAP”. ... 95
Figure 4.2- Comparison of in vivo subunit recovery dynamics. ... 102
Figure 4.3- Summary of the best-fit apparent anomalous modeling parameters. ... 106
Figure 4.4- Comparison of in vitro subunit recovery dynamics. ... 109
Figure 4.5- Brownian diffusion coefficient distributions. ... 112
Figure 5.1: Extracting a binary mixture from a simulated FRAP curve at different SNR. ... 136
xv
Figure 5.3: Inclusion of an artificial immobile fraction impairs fitting by the distribution
model on datasets with 50 dB SNR. ... 140
Figure 5.4: Inclusion of an artificial immobile fraction impairs fitting by the distribution model on datasets with 35 dB SNR. ... 141
Figure 5.5: Results of extracting the underlying distribution from a gamma function input with the inclusion of an artificial immobile fraction at 50 dB SNR ... 142
Figure 5.6: Results of extracting the underlying distribution from a gamma function input with the inclusion of an artificial immobile fraction at 35 dB SNR. ... 143
Figure 5.7: Effect of including an artificial immobile fraction on distribution fitting to a binary mixture without noise. ... 148
Figure 5.8: Effect of including an artificial immobile fraction on distribution fitting to a gamma distribution without noise... 149
Figure A.1- Output of gel_analysis2, indicating the region of interest for each lane... 160
Figure A.2- Representative output of a single lane analysis. ... 164
Figure A.3- Output of the Gaussian fits to each DNA band for every lane. ... 170
Figure A.4- Quantification of the three plasmid forms from the initial gel image. ... 171
Figure B.1- Compiling datafiles into an image stack ... 175
Figure B.2- Initial frame of a time-lapse movie recording the cleavage of elongated DNA molecules. ... 176
Figure B.3- False-color output used to guide user selection of intact DNA molecules. ... 177
Figure B.4- DNAid1 output enabling user selection. ... 178
Figure B.5- Final output and resulting mask. ... 179
Figure B.6- Output of the DNAidstack2 program. ... 183
Figure D.1- High expression levels of fusion proteins are not responsible for the observed anomalous diffusion... 191
xvi
Figure D.3- Establishing the Robustness of the Distribution Model on Experimental Data ... 197
xvii
LIST OF ABBREVIATIONS
AA- Ascorbic Acid
AFM- Atomic Force Micrscopy
APTES- (3-Aminopropyl)triethoxysilane b- Critical distance in basepairs
B(t)- Nicked or singly broken DNA molecules BBO- β Barium Borate
BME- β-mercaptoethanol bp- Basepairs
BSA- Bovine Serum Albumin
CALI- Chromophore Assisted Laser Inactivation CI- Confidence Interval
CPD- Cyclopyrimidine Dimer Deff- Effective Diffusion Coefficent
DNA- Deoxyribonucleic Acid dNTP- Deoxynucleotide DSB- Double Strand Break
EDTA- Ethylenediaminetetraacetic acid
EMCCD- Electron Multiplied Charge Coupled Device eV- Electron Volt
xviii FRAP- Fluorescence Recovery after Photobleaching FWHM- Full Width at Half Maximum
GFP- Green Fluorescent Protein GM- Goeppert Mayer
gp- Temporal laser pulse shape
HPLC- High Performance Liquid Chromatography Hz- Hertz
KI- Potassium Iodide KIO3- Potassium Iodate
Mg(OAc)2- Magnesium acetate
mM- millimeter
NA- Numerical Aperture
NA2- number of photons absorbed per nucleotide per second
NaCl- Sodium Chloride
NaHCO3- Sodium Bicarbonate
NER- Nucleotide Excision Repair OD- Optical Density
P(n)- Probability that a DNA strand has n lesions PCR- Polymerase Chain Reaction
PEG- Polyethylene Glycol PSF-Point Spread Function
xix QPCR- Quantitative Polymerase Chain Reaction QY-ΦD, Quantum Yield of dimerization
RFP- Red Fluorescent Protein RNAP- Ribonucleic Acid Polymerase ROS- Radical Oxygen Species
RSD- Relative Standard Deviation SD- Standard Deviation
SMI- Single Molecule Imaging SSB- Single Strand Break TE- Tris EDTA
TIR- Total Internal Reflection
TIRFM- Total Internal Reflection Fluorescence Microcopy TPA- Two-Photon Absorption
Tris- tris(hydroxymethyl)aminomethane U(t)- Undamaged DNA molecules
UV- Ultraviolet
v/v- volume per volume XFP- Fluorescent Protein Y-Linearized DNA molecules
μ- Average number of lesions on each DNA strand σ- Two-photon cross section
CHAPTER 1
INTRODUCTION
WHAT IS PROTEIN RECRUITMENT AND HOW DO WE STUDY IT? “You can observe a lot just by watching”
-Yogi Berra
Differing Systems to Study Protein Recruitment
2
which an active complex, either partially or fully assembled, locate a unique binding site, often a miniscule genomic element in comparison to the entire nuclear material6. For protein
complexes involved in genome metabolism, it has recently been shown that a sharp delineation between these processes is not possible (Chapter 4).
Underlying all aspects of protein recruitment are the transport mechanisms, active or passive, by which proteins traverse the cellular interior7, 8. It is through interrogating these transport mechanisms and identifying their signaturesthat we can hope to gain insights into the mechanistic details of recruitment. Given the dynamic nature of protein transport and
simultaneous requirements of capturing spatial and temporal details of the processes, optical microscopy has emerged at the forefront of tools uniquely suited for such investigations. In addition to passive imaging techniques that enable high resolution visual observations, powerful perturbation methods and spectroscopies such as Fluorescence Recovery after Photobleaching (FRAP), Fluorescence Loss in Photobleaching (FLIP), and Fluorescence Correlation Spectroscopy (FCS), have evolved allowing in vivo measurements of transport dynamics9, 10. Further, recent instrumentation advances have opened up the field of single molecule imaging (SMI); giving experimenters the ability to track and manipulate individual biomolecules in both artificially enhancedbiological and syntheticin vitro systems11, 12.
3
are discussed, along with important implications for evaluating the results of many optical imaging experiments. Later, variants onhigh time resolution FRAP methods will be discussed and applied to the investigation of the spatiotemporal formation of large protein complexes in the context of DNA transcription. Given the possible mechanistic universality of the underlying chemical and physical interactions of protein recruitment, two highly conserved pathways will be considered. Initially, the most ubiquitous DNA repair pathway, Nucleotide Excision Repair (NER)13, is used as a model system to drive the development of the optical platform to study protein recruitment in vitro. Next, arguably one of the most crucial genome metabolic processes, transcription by RNA Polymerase II14, will be considered as a paradigm of in vivo supramolecular assembly.
Strategies to Investigate Protein-Target Binding Site Recognition
1. Protypical DNA Damage Repair Pathway
The chemical stability of DNA and simplistic elegance of its replication often obscures the myriad ways in which damage can be incurred, through the action of endogenous cellular factors (typically radical oxygen species) or exogenous mutagenic agents, particularly ultra-violet (UV) or ionizing radiation15.These agents can cause structural changes as significant as strand breaks or dimer formation between adjacent bases. These various forms of damage, collectively termed mutations, lead to loss of genomic fidelity and resulting disease states.
4
classes are highly conserved in both prokaryotes and eukaryotes13, underscoring the common mechanistic universality. The least specific repair pathway, nucleotide excision repair (NER), is responsible for correcting damage that results in structural alterations to DNA13, operating through excision of oligonucleotides flanking the damage site.
Common to all three pathways of DNA repair is the concerted action of multiprotein complexes which must be sequentially recruited to the site of damage amidst the vast majority of highly dynamic chromatin16, 17.While several models of NER action have been proposed, most feature 3-dimensional, diffusion mediated nuclear transport to enable rapid surveillance of the nuclear volume coupled with occasional 1-dimensional sliding diffusion along the DNA
backbone. NER is best understood in the model system Escherichia coli, where the Uvr A, B, and C endonuclease system demonstrate concerted action to identify and remove damage sites. Thus DNA repair pathways offer an excellent opportunity to observe site-specific protein recruitment. Once coupled with strategies to induce DNA damage in real-time that initiate the recruitment process, the entire process can be tracked.
2. Optically Manipulating DNA
5
real-time generation of CPDs with high spatial resolution. These lesions function as user
controlled binding sites, triggering the switch from scanning to binding of damaged DNA. While photolesions are usually formed by exposure to 260 nm emission from UV light sources, this results in a random spatial distribution of lesions throughout the sample19.Advances using polycarbonate masks with 3-5 μm holes to restrict UV exposure have reduced the 2D regions of lesion formation to smaller than a cell nucleus20, 21. However, such spatial control is still very poor in comparison to the resolution offered by modern microscopic techniques and worse still in comparison to the biological length scales needed to discern differences in diffusion
modality. Further, no spatial control is possible in the third dimension. Since the poor
transmission of light below 350 nm restricts the pairing of UV light sources with a microscopy-based apparatus, two-photonirradiation has been harnessed as a means to deliver UV energy with conventional optics.
6
two-photon microscopy and photodamage production. Depth discrimination is then paired with equatorial control provided by the raster scanning of laser-scanning microscopy, allowing for the precise irradiation of microscale spatial volumes.
3. Designing a Platform for the In Vitro Study of Repair Pathways
In contrast to previous decades in which traditional biochemical techniques were employed to study bulk systems 13, 32, researchers now prefer SMI methods that offer the spatiotemporal resolution required to decipher protein dynamics on a biologically relevant timescale and to observe biological variability in nanoscopic systems. The implementation of single molecule detection is primarily based on the application of optical fluorescence microscopy due to the high contrast acquired by the use of bright fluorophores against dark backgrounds, even in biologically relevant aqueous environments. All such implementations require reducing the sample size under investigation to a sub-100 fl volumes33. Currently, the principle techniques to restrict the sample volume are total-internal reflection fluorescence microscopy (TIRFM) and laser scanning methods such as confocal or multiphoton microscopy. In the former, the sample volume investigated is limited by the effective field of illumination created by the very shallow evanescent field that results from reflection off an interface causing total-internal reflection (TIR) 34.
To achieve sample immobilization and provide a restricted imaging volume, schemes for the immobilization of DNA molecules tethered to a glass substrate and elongated by
7
molecules above a biologically inert surface11, 37. This provides a method to couple multiphotonphotolesion formation with a TIRF based imaging apparatus.
The direct imaging of fluorescently labeled Uvr protein components engaged in a search complex35, 38, pre and post lesion induction, provides the most direct means to ascertain the mechanism by which target search occurs.To this end,pairingSMI methods with a novel, TPA real-time induction of protein recruitmentwould further elucidate the intricacies of NER in the highly characterized biological systems system.
4. Sensitized Methods of Photochemical DNA Damage Induction
Modern high-resolution optical microscopy is premised upon the use of the fluorescent marker species for the identification and tracking of intracellular or purified biological
components. In the case of biological tissue imaging, fluorophores can be endogenously expressed XFP variants or exogenously incorporated molecules, either actively or passively uptaken from the environment. Markers have been engineered that are specific for cellular substructures, targeting incorporation into lipophilic domains for membrane studies or that exhibit high binding affinities to DNA to mark nuclear locations or track genomic processes. Further extending the utility of microscopy to probe highly dynamic biological processes, high-quantum efficiency fluorophores coupled with advancements in optical image collection have resulted in the bourgeoning field of single molecule microscopy for both in vitro and in
8
Paramount among the assumptions made in the use of fluorescent reporter molecules is that they do not perturb the system under observation. Unfortunately, this assumption is not always valid. The optical excitation of light-emitting molecules (fluorophores) often results in photodamage arising from chemical reactions of the fluorophore in its lowest energy electronic excited state, leading to photochemical damage. The most probable pathway for energy relaxation from this excited state is photon emission, but there exist other possible excitation-relaxation pathways that can produce reactive intermediates. These pathways can lead to fluorophore photobleaching, a permanent chemical rearrangement of the fluorophore where fluorescence is no longer the primary relaxation pathway. Most fluorophores undergo 105 – 106 excitation cycles before photobleaching; entry into this non-emissive state may indicate the production of reactive species 39, 40. The production of these damaging species may be
cryptically occurring even without a visible loss of fluorescence from the sample. In either case, photochemical damage is typically cumulative as it relies upon the net number of excitation events only and not the rate at which the excitation events occur.
9
transfer between molecular oxygen and the excited fluorophore results in the formation of singlet oxygenand electron transfer between the two speciescreates a super-oxide and a fluorophore radical. All of these species, termed radical oxygen species (ROS) are highly reactive and are generated by the favorable downhill energetics of electron transfer to ground state oxygen, coupled with the rapid diffusion of molecular oxygen and therefore frequent interactions 40. These highly unstable species are rapidly quenched in aqueous environments leading to the formation of hydroxyl radicals. The short-lived hydroxyl radical is the prime damage mediating species, resulting in radical induced damage to proximal biomolecules 41.
ROS are frequently generated when imaging nucleic acids stained with intercalating dyes, in both in vitro and in vivo applications. This can lead to widespread genomic damage, the effect of which must be carefully considered when using DNA stains 42. The formation of damaging hydroxyl radicals proximal to the site of fluorophore incorporation results in species that can attack DNA to produce various forms of oxidative radical photodamage 43, notably single strand breaks 44, 45. Individual damage events typically cleave only one strand of the DNA sugar-phosphate backbone 46, 47; the accumulation of many single-strand breaks leads to
10
Although the generation of damage mediating radicals is detrimental for most
experiments, it can offer a degree of spatiotemporal user control in instances when initiating cellular damage is desirable 42, 45. The common DNA intercalating dyes used for imaging application, such as Hoechst and DAPI (in vivo use) or YOYO-1, TOTO-1, Picogreen, and related dye monomers (in vitro staining), are all capable of selectively targeting DNA for
fragmentation49. The incorporation of these intercalating dyes enables DNA fragmentation to be initiated at particular wavelengths in a dose-dependent manner. This is useful for studies of DNA damage and repair mechanisms, where localized photochemical damage can be used to elucidate repair pathways. It has been shown that careful selection of the type of dye and DNA binding mode can be applied to tune the DNA backbone cleavage, biasing damage towards double strand cleavage or single strand breaks 50.
Strategies for Investigating the Assembly of Macromolecular Complexes
1. Models of Macromolecular Protein Assembly Dynamics in Cell Nuclei
The second facet of protein recruitment that we have targeted for investigation
concerns the spatiotemporal formation of the macromolecular complexes responsible for most cellular processes, in particular genome metabolism. The post-processing of nascent RNA transcripts by the spliceosome and transcription of DNA by RNA Polymerase II (RNAP II) represent the epitome of supramolecular complexes essential for genome metabolism5, in which function is well resolved but assembly is poorly understood1, 8, 51. Elucidating the
11
Currently, two competing models of macromolecular assembly, categorized as either top-down53 or bottom-up54, are jockeying for acceptance, with a large body of literature supporting both propositions. In top-down assembly, the constituents of the final complex are hypothesized to bind one another prior to DNA interactions and form a stable macromolecular machine termed a “factory”53, 55. Such factories likely persist for a long duration in the cellular environment, stabilized by the numerous binding interactions of the many subunits, and represent the most efficient initiation of a metabolic function. This approach is supported by the well-documented observation of large, multi-mega Dalton RNAP complexes that have been identified by optical and electron microscopy, as well as mass spectrometry56-59. These
factories have been found to persist in vivoand in vitro for long durations, even when transcription halts60. It remains unclear how the factory initially assembles, either in a concerted, step-wise manner, or through uncorrelated, stochastic interactions.
12
proceeds through a step-wise process, or through stochastic binding interactions of the component subunits at their genomic site of action. In the latter variant, assembly would be particularly inefficient since most stochastic interactions would likely be out of sequence and lead to an aborted intermediate. While FRET evidence has accumulated that indicates spliceosome subunits do form partially assembled intermediates, their role in the final assembly is not yet understood5.
2. Mechanism Evaluation: Choosing the Right Time and Place
13
factories following macromolecular assembly. Further, biochemical studies that have suggested step-wise or stochastic assembly mechanisms again suffer from a lack of cellular context, in which molecular crowding or subunit confinement could drastically alter protein interactions64.
In general, all studies of macromolecular assembly have been complicated by the confounding presence of chromatin, which provides varying degrees of molecular confinement and presents nucleation sites for complex formation3, 3, 14, 65, 66. In fact, both assembly models posit cellular molecular crowding and the resulting reduced diffusional mobility as favorable evidence. Bottom-up assembly is viewed as benefiting from the reduced diffusional mobility of complex subunits, which would lengthen interaction times and promote more frequent
collisions, thereby promoting macromolecular assembly from stochastic collision events. In contrast, proponents of the top-down assembly mechanism cite the crowded nuclear environment as favorable for maintaining the stability of an assembled complex, yet the inability of a large factory to effectively diffuse throughout the nuclear volume is often
overlooked. Only by observing protein behavior with high spatiotemporal resolution in a model system where the effects of chromatin can be eliminated, can the initial stages of
macromolecular assembly be discerned.
14
Importantly, recent work completed by our group has indicated that a hybrid mechanism likely mediates complex formation. We have found that large macromolecular assemblies exhibit remarkable stability both in vivo and in vitro, yet likely form through the stochastic assembly of partially assembled intermediates with or without the assistance of chromatin nucleation sites.
Research Aims and Scope
Through my graduate research, methodologies have been developed for gaining insights into the multifaceted phenomenon of protein recruitment. As detailed in Chapter 2, my initial projects focused on the development of single molecule imaging techniques, and confirm two-photon DNA photodamage with visible light. Damage cross sections were determined for biologically relevant DNA samples at different visible wavelengths. This work was later
15 REFERENCES
(1) Hemmerich, P. Zellbiologie 2005, 31, 18.
(2) Matera, A. G.; Izaguire-Sierra, M.; Praveen, K.; Rajendra, T. K. Dev. Cell 2009, 17, 639-647. (3) Dundr, M.; Hoffmann-Rohrer, U.; Hu, Q.; Grummt, I.; Rothblum, L. I.; Phair, R. D.; Misteli, T.
Science 2002, 298, 1623-1626.
(4) Rippe, K. Curr. Opin. Genet. Dev. 2007, 17, 373-380.
(5) Rino, J.; Carmo-Fonseca, M. Trends Cell Biol. 2009, 19, 375-384.
(6) Houten, B. V.; Croteau, D. L.; Vecchia, M. J. D.; Wang, H.; Kisker, C. Mut. Res. 2005, 577, 92-117.
(7) van Mameren, J.; Peterman, E. J. G.; Wuite, G. J. L. Nucleic Acids Res.2008, 36, 4381-4389. (8) Hager, G.; Elbi, C.; Becker, M. Curr. Opin. Genet. Dev.2002, 12, 137.
(9) Mueller, F.; Mazza, D.; Stasevich, T. J.; McNally, J. G. Curr. Opin. Cell Biol. 2010, 22, 403-411. (10) Krichevsky, O.; Bonnet, G. Rep Prog Phys 2002, 65, 251-297.
(11) Graneli, A.; Yeykal, C. C.; Prasad, T. K.; Greene, E. C. Langmuir 2006, 22, 292-299. (12) Xie, X. S.; Choi, P. J.; Li, G.; Lee, N. K.; Lia, G. Annu. Rev. Biophys.2008, 37, 417-444. (13) Friedberg, E. C.; Walker, G. C.; Siede, W. DNA repair and mutagenesis; ASM Press:
Washington D.C., 1995; .
(14) Darzacq, X.; Shav-Tal, Y.; de Turris, V.; Brody, Y.; Shenoy, S. M.; Phair, R. D.; Singer, R. H. Nat Struct Mol Biol 2007, 14, 796-806.
(15) Friedberg, E. C. Nature 2003, 421, 436-440.
(16) Mone, M. J.; Bernas, T.; Dinant, C.; Goedvree, F. A.; Manders, E. M. M.; Volker, M.;
Houtsmuller, A. B.; Hoeijmakers, J. H. J.; Vermeulen, W.; Driel, R. v. Proc. Natl. Acad. Sci. U. S. A. 2004, 101, 15933-15937.
16
(18) Patrick, M. H.; Rahn, R. O. Photochemistry and Photobiology of Nucleic Acids; Academic Press: New York, 1976; Vol. II, pp 35-96.
(19) Patrick, M. H. In Physical and chemical properties of DNA; Wang, S. Y., Ed.; Photochemistry and Photobiology of Nucleic Acids; Academic Press: New York, 1976; Vol. 2, .
(20) Katsumi, S.; Kobayashi, N.; Imoto, K.; Nakagawa, A.; Yamashina, Y.; Muramatsu, T.; Shirai, T.; Miyagawa, S.; Sugiura, S.; Hanaoka, F.; Matsunaga, T.; Nikaido, O.; Mori, T. J. Invest. Dermatol. 2001, 117, 1156-1161.
(21) Mone, M. J.; Volker, M.; Nikaido, O.; Mullenders, L. H. F.; Zeeland, A. A. v.; Verschure, P. J.; Manders, E. M. M.; Driel, R. v. EMBO Rep. 2001, 2, 1013-1017.
(22) Lukas, C.; Melander, F.; Stucki, M.; Falck, J.; Bekker-Jensen, S.; Goldberg, M.; Lerenthal, Y.; Jackson, S. P.; Bartek, J.; Lukas, J. EMBO Journal 2004, 23, 2674-2683.
(23) Trautlein, D.; Deibler, M.; Leitenstorfer, A.; Ferrando-May, E. Nucleic Acids Res. 2010, 38, e14.
(24) Daddysman, M.; Fecko, C. Biophys. J. 2011, 101, 2294-2303.
(25) Tycon, M. A.; Chakraborty, A.; Fecko, C. J. J. Photochem. Photobiol. B, Biol. 2011, 102, 161-168.
(26) Gut, I. G.; Hefetz, Y.; Kochevar, I. E.; Hillenkamp, F. J Phys. Chem1993, 97, 5171-5176. (27) Hefetz, Y.; Dunn, D. A.; Deutsch, T. F.; Buckley, L.; Hillenkamp, F.; Kochevar, I. E. J. AM.
CHEM. SOC.,1990, 112, 8528-8532.
(28) Zipfel, W. R.; Williams, R. M.; Webb, W. W. Nat. Biotechnol. 2003, 21, 1369-1377. (29) Bekker-Jensen, S.; Lukas, C.; Melander, F.; Bartek, J.; Lukas, J. J. Cell Biol.2005, 170,
201-211.
(30) Bekker-Jensen, S.; Lukas, C.; Kitagawa, R.; Melander, F.; Kastan, M. B.; Bartek, J.; Lukas, J. J. Cell Biol.2006, 173, 195-206.
(31) Denk, W.; Strickler, J. H.; Webb, W. W. Science 1990, 248, 73-76. (32) Friedberg, E. C. DNA Repair 2002, I, 855-867.
17
(34) Axelrod, D. In Total internal reflection fluorescence microscocpy; Torok, P., Kao, F., Eds.; Optical Imaging and Microscopy; Heidelberg: Berlin, 2007; Vol. 87, pp 195-236.
(35) Kad, N.M., Wang, H., Kennedy, G.G., Warshaw, D.M., Van Houten,B. Mol. Cell 2010, 37, 702-713.
(36) - Tanner, N. A.; - Loparo, J. J.; - van Oijen, A. M. - J Vis Exp , - e1529.
(37) Blainey, P. C.; Oijen, A. M. v.; Banerjee, A.; Verdine, G. L.; Xie, X. S. PROC. NATL. ACAD. SCI. U.S.A.2006, 103, 5752-5757.
(38) Wang, H.; Tessmer, I.; Croteau, D. L.; Erie, D. A.; Houten, B. V. Nano Letters 2008, 8, 1631-1637.
(39) Halliwell, B.; Aruoma, O. I. FEBS Lett. 1991, 281, 9-19.
(40) Schweitzer, C.; Schmidt, R. Chem. Rev. 2003, 103, 1685-1757. (41) SIES, H. Eur. J. Biochem.1993, 215, 213-219.
(42) Limoli, C. L.; Ward, J. F. Radiat. Res 1993, 134, 160-169. (43) Saran, M.; Bors, W. Radiat Environ Biophys 1990, 29, 249-262. (44) Teoule, R. Int. J. Radiat. Biol. 1987, 51, 573-589.
(45) Ward, J. F. Int. J. Radiat. Biol. 1990, 57, 1141-1150.
(46) Guo, H.; Tullius, T. D. PROC. NATL. ACAD. SCI. U.S.A.,. 2003, 100, 3743-3747. (47) Siddiqi, M. A.; Bothe, E. Radiat. Res , 112, 449-463.
(48) Caldecott, K. W. Nature Rev. Genet.2008, 9, 619-631. (49) Akerman, B., Tuite, E. Nucleic Acids Res. 1996, 24, 1080.
(50) Tycon, M. A.; Dial, C. F.; Faison, K.; Melvin, W.; Fecko, C. J. Anal. Biochem. 2012, 426, 13-21. (51) Cardoso, M. C.; Leonhardt, H. J. Cell. Biochem. 1998, 70, 222-230.
(52) Misteli, T. Cell 2007, 128, 787.
18 (55) Cook, P. R. Science 1999, 284, 1790-1795.
(56) Melnik, S.; Deng, B.; Papantonis, A.; Baboo, S.; Carr, I. M.; Cook, P. Nature Methods 2012, 8, 963.
(57) Eskiw, C.; Fraser, P. J. Cell Sci. 2011, 124, 3676.
(58) Chakalova, L.; Debrand, E.; Mitchell, J. A.; Osborne, C. S.; Fraser, P. Nature Rev. Genet,2005, 6, 669-677.
(59) Osborne, C.; Chakalova, L.; Brown, K.; Carter, D.; Horton, A.; Debrand, E.; Goyenechea, B.; Mitchell, J.; Lopes, S.; Reik, W.; Fraser, P. Nat. Genet. 2004, 36, 1065-1071.
(60) Mitchell, J. A.; Fraser, P. Genes Dev.2008, 22, 20.
(61) Wilson, C. J.; Chao, D. M.; Imbalzano, A. N.; Schnitzler, G. R.; Kingston, R. E.; Young, R. A. Cell 1996, 84, 235-244.
(62) Schneider, D. A.; Nomura, M. PROC. NATL. ACAD. SCI. U.S.A., 2004, 101, 15112-15117. (63) Grummt, I. Genes Dev.,2003, 17, 1691.
(64) Hancock, R. J. Struct. Biol. 2004, 146, 281-290.
CHAPTER 2
GENERATION OF DNA PHOTOLESIONS BY TWO-PHOTON ABSORPTION OF A FREQUENCY-DOUBLED TI:SAPPHIRE LASER
"The microscope with its accessories is by far the least understood, the most inefficiently operated, and the most abused of all laboratory instruments"
-Charles Shillaber
Overview:
20
photodamage indicates that the onset of DNA damage occurs at lower intensities in vivo; we suggest possible explanations for this discrepancy.
Introduction
Irradiation by ultraviolet (UV) light is one of the most extensively used methods for exploring the biological consequences of DNA damage and repair. Nucleic acids exhibit an absorption maximum near 260 nm, but efficiently absorb light with wavelengths between 200-300 nm 1, 2. The most common method of photolesion formation is by exposure to 254 nm radiation from low pressure mercury lamps. Although simple to implement, this method creates photolesions with a random spatial distribution; it is often desirable to generate
21
Ultimately, while these methods can localize the extent of DNA damage in two dimensions, they do not offer confinement in the third dimension.
As an alternative, we explored the use of multiphoton absorption of DNA as a means to produce photolesions with conventional optics. Nonresonantmultiphoton absorption is the process in which two or more photons interact with a molecule simultaneously to generate an excited state equivalent in energy to the summation of the absorbed photons 17. Since
simultaneous absorption requires a large photon flux, the probability of two-photon absorption depends quadratically on the intensity of the incident light. This property is exploited to achieve depth discrimination in two-photon microscopy since absorption can only occur at the focal point of an objective lens as it is the region of highest intensity 18, 19. Similarly, two-photon absorption-induced DNA damage has the advantage of generating photolesions in a three-dimensionally pre-defined region of space, which is superior to the spatially random and widespread regions of damage induced by widefield UV illumination. Additionally, it does not require the introduction of an exogenous sensitizer that could perturb normal cellular
functions.
22
naturally occurring and intentionally added) as mediators of energy transfer have not been fully considered. More information is needed about the amount of direct multiphoton absorption of DNA, so that this phenomenon can be applied in conjunction with ultrasensitive microscopy-based methods to study DNA repair protein dynamics 23, 24.
It is challenging to assay DNA photolesions produced by two-photon absorption because of the inherently microscopic conditions in which they are produced. DNA damage assays premised on techniques as varied as gel electrophoresis 25, HPLC 26, and radiolabeling 27 require significantly more sample than is that contained in the ~femtoliter focal volume of an objective lens. To compensate, we have adopted the approach of irradiating 10 μL droplets by
repeatedly raster scanning a focused laser beam through the sample in different axial planes using a laser scanning system. We have also developed a highly sensitive quantitative
polymerase chain reaction (QPCR) to detect DNA damage. By combining these techniques, we have observed two-photon absorption-induced DNA damage, and determined the relevant absorption cross sections at 425, 450, and 475 nm. A comparison of our results to previously published in vivo studies indicates that the generation of photodamage by two-photon
absorption in vitro requires higher intensities than expected based on the in vivo experiments.
Materials and Methods
1. Materials
23
purchased as the GeneAmp XL PCR kit from Applied Biosystems, and custom primers were synthesized by Integrated DNA Technologies. A QIAquick PCR Purfication kit was obtained from Qiagen and the Quant-iTTMPicoGreendsDNAreagent was obtained from Invitrogen. PCR was performed in an EppendorfMastercycler, absorption measurements were made on a NanoDrop 1000 Spectrophotometer and the PicoGreen fluorescence assay was read on a BMG PheraStar plate reader. UV-induced DNA damage was generated with a SpectrolineCrosslinker containing 254 nm tubes (the crosslinker was operated with only half of the maximum number of bulbs to reduce the photon flux). The laser setup is described in detail below.
2. DNA sample preparation
The PCR amplification efficiency of supercoiled DNA is poor 28, so the samples used to develop the QPCR assay and for subsequent irradiation studies were prepared from linearized pBR322 DNA. Additionally, concerns that commercial products may contain trace amounts of photosensitizers motivated us to use DNA samples generated in-house by PCR.
We linearized supercoiled pBR322 with EcoRI (5 units/mg plasmid, recommended by New England BioLabs), confirmed the product by 1% agarose gel electrophoresis, and then amplified it using the GeneAmp XL PCR kit. The initial PCR reaction mixture was composed of sterile water, 5 pg/μL linearized pBR322, 1X rTth buffer, 200 μMdNTPs, 1.2 μMMg(OAc)2, 0.1 mg/mL BSA, and 0.4 μM of each primer. The rTth polymerase was diluted in 1X rTth buffer and 1 unit was added to each amplification reaction. The primers sequences, which amplify a 4.3 kb fragment of pBR322, are28:
24
pBR399R (5’- TGGATCTCAACAGCGGTAAGA-3’)
The dNTPs and primer solutions were stored as aliquots to avoid excessive freeze thaw cycles. The DNA was amplified using a three-step temperature program: initial denaturation at 94oC for 1 min, then 28 cycles of denaturation at 94oC (15s), annealing at 62oC (30s), and elongation at 66oC (240s) in the EppendorfMastercycler. The PCR product from several tubes was consolidated and purified with a PCR cleanup kit. The DNA concentration was measured by absorption at 260 nm (typical concentrations after PRC ~180 ng/uL) and stored as single-use aliquots at -80° C for use as a DNA template in subsequent experiments.
As a control for the QPCR assay, a portion of the PCR-generated linearized pBR322 was enzymatically nicked with Nb.BSmI, which cleaves only one strand of the double-stranded DNA substrate. The enzyme was heat inactivated and removed using the PCR cleanup kit. The DNA concentration was measured by absorption at 260 nm and stored as single-use aliquots at -80° C for subsequent experiments.
3. QPCR assay of DNA damage
The QPCR assay was used to amplify DNA templates that have been diluted with Millipore water to a working concentration of 0.05ng/μL. The initial PCR reaction mixture is identical to the aforementioned mixture used to generate template. Each QPCR assay run includes four mandatory controls: an undamaged pBR322, a serial dilution at half the
25
temperature program described above. This number of PCR cycles used was determined empirically with the goal of maintaining a two-fold increase in amplification between control samples. Samples were run in duplicate or triplicate.
Following the PCR amplification, the PCR products were quantified using the PicoGreen DNA quantification assay. The samples were prepared in a 96 well plate to be processed by the PheraStar plate reader, with filters corresponding to the 488/520 nm excitation/emission spectrum of PicoGreen. In addition to the PCR products, a set of pBR322 standards made by serial dilution was run to calculate the final concentration of the amplified products and to calculate the true starting concentrations of the template stocks. The dilution series always included a blank sample (water) to correct the fluorescence measurements. The PCR products were diluted with TE buffer (10mM Tris-EDTA, pH 8.3, adjusted with dilute NaOH and HCl) and mixed with diluted PicoGreen solution as per the manufacturer’s instructions.
4. UV irradiation
In order to determine the quantum yield of photolesions in response to 254nm UV light, linearized pBR322 (0.05 ng/μL) was irradiated in a UV oven with an emission peak at 254 nm. Sample aliquots (20μL) and a KI/KIO3 chemical actinometer (20μL) 29, 30 were simultaneously irradiated on a glass slide for varying exposure times, generating damage at a range of UV dosages 29, 30. The number of incident photons was determined by the actinometer.
26
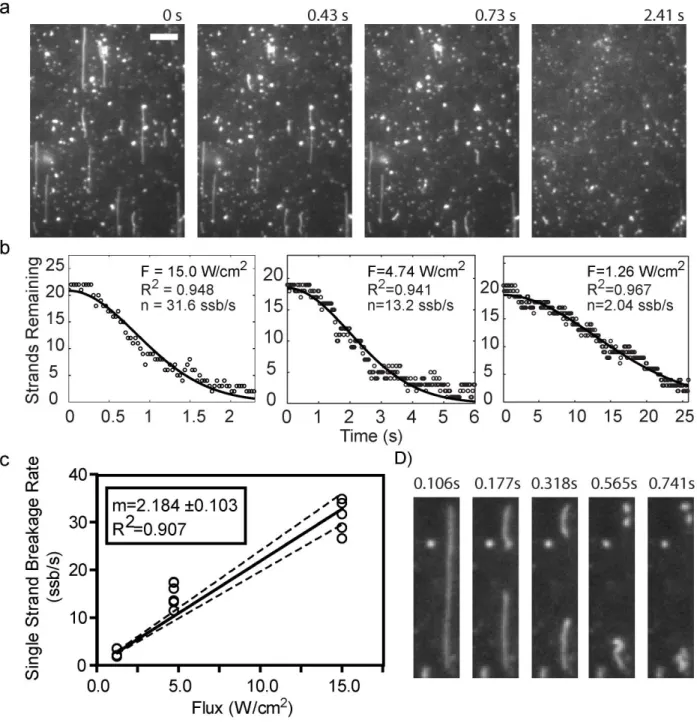
In order to investigate photolesion formation that results from two-photon absorption, homogenous DNA samples were irradiated by focused 400-500 nm ultrashort pulses using the apparatus diagrammed in Figure 2.1. Our setup used tunable near-infrared, ~140 fs pulses produced at 80 MHz by a Coherent Chameleon Ultra II Ti:sapphire oscillator. An electro-optic modulator and polarizer placed directly after the laser controlled the intensity used for each experiment. We generated the second harmonic frequency of the pulses by focusing the beam into a 2 mm path length β-barium borate crystal cut for type-I phase matching. The focal length of the lens, and thus doubling efficiency, was somewhat limited by the requirement that the visible beam be relatively symmetric and free of astigmatism. The residual near-infrared light was rejected with a contrast ratio of at least 100:1 by reflecting the beam off of two dichroic mirrors. The visible femtosecond pulses were introduced into a home-built laser-scanning microscope based on an Olympus IX81 inverted microscope. Mirrors mounted on computer-controlled galvanometers determined the angle with which the laser beam enters the objective lens. To irradiate a large field of view but maintain sufficiently high peak intensities, a 10X, 0.30NA objective lens was used to focus the beam within the sample. The back aperture of the lens was slightly underfilled to maximize transmission while maintaining a tight focus. The beam was raster scanned in a sinusoidal pattern through each axial plane of the sample. The focal plane was adjusted by translating the objective lens in the axial dimension using the motorized nosepiece of the microscope.
27
Figure 2.1-Schematic diagram of the irradiation apparatus.Femtosecond pulses from a tunable Ti:sapphire laser are attenuated by a Pockels cell/polarizer and subsequently focused into a β-barium borate (BBO) crystal that doubles their frequency. After removing the residual
28
crosstalk. A metal guide and micrometer were used to position different wells reproducibly with respect to the objective lens. The sample in each well was irradiated by raster scanning a focused beam through the sample using the galvanometer-mounted mirrors, and then
repeating for each axial plane. The number of axial scans performed was determined by the height of the liquid column in the well, and it was confirmed that over-scanning the height of the well did not cause additional photodamage. The axial plane spacing was approximately equal to the full-width at half-maximum of the calculated point spread function, and the number of laser pulses incident on each point in the sample was estimated from the calculated point spread function and average velocity. The irradiation intensity was adjusted for each sample by varying the incident laser power using the aforementioned electro-optic modulator without adjusting the beam focusing, and the incident laser power measured at the objection prior to irradiation. The point spread function was measured at 450 nm by imaging 100 nm fluorescent beads immobilized on a glass surface. For each wavelength, 10 μL of linearized pBR322 samples (0.05 ng/μL) was irradiated at a series of incident powers. Each sample was removed from the microwell plates and the amount of DNA damage was evaluated using the PCR-based assay described above. Care was taken to ensure that the control samples were treated identically to irradiated samples, with the exception of exposure to the laser.
Results and Discussion
29 1. Development of a QPCR assay of DNA damage
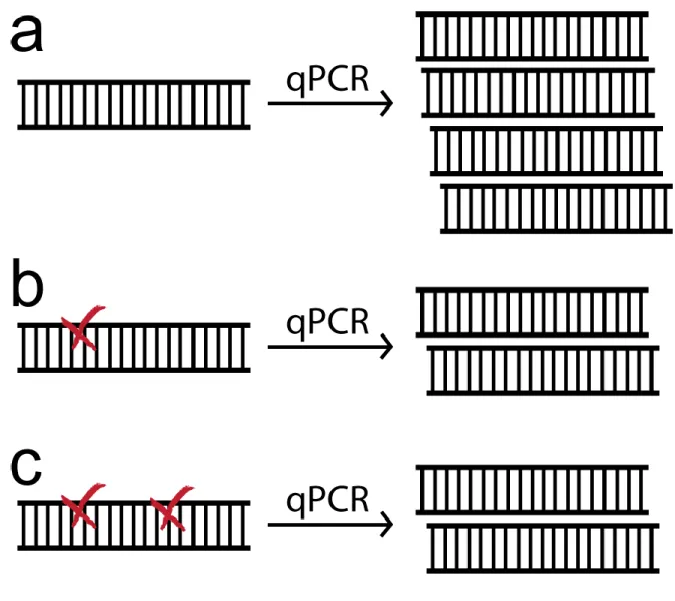
The assay used to quantify the formation of photolesions after irradiation was based on a method developed by Van Houtenand co-workers31-33. The method is premised on a
reduction in DNA polymerase transcription efficiency by strand breaks or by bulky forms of damage, such as thymine dimers, which block the progress of polymerases not containing exonuclease activity34. In the first round of PCR amplification, a single lesion removes a
damaged strand from future replication, as the truncated transcription product will not be able to anneal with the primers required to initiate the next round. Thus damaged sample
populations are not amplified as quickly due to the reduction in the number of strands available for transcription, and will manifest damage relative to an undamaged control sample (Fig. 2.2-a). The sensitivity of this assay is related to the length of the PCR target, since a single lesion in a long template causes a larger reduction in the quantity of DNA produced than a single lesion in a shorter template. The use of long DNA templates and the ability of PCR to amplify sub-nanogram quantities of starting template makes this assay ideal for measuring low damage rates of microscale samples33.
30
optimization of a quantitative PCR protocol for the DNA template under investigation followed by validation that amplification linearity was reliable.
a. Conditions for quantitative PCR
PCR reactions proceed through three phases: early exponential growth, reduced efficiency “leveling off” as reagents become limiting, and finally saturation or plateau33. In order to maintain the linear relationship between sample input and output concentrations, the QPCR reaction must be kept in the exponential phase, where a semilog analysis yields a linear plot. For a quantitative assay, the cycle number chosen is a compromise between saturation and signal to noise limits. The cycle used should be low enough for undamaged samples to remain in the exponential phase while amplifying, but high enough to yield a large degree of amplification of the control relative to damaged samples to achieve a good signal to noise ratio when measuring the amount of PCR product.
We determined the optimal quantitative amplification conditions by generating PCR growth curves of a linearized pBR322 DNA template at 0.05 and 0.025 ng/μL concentrations and selecting the cycle number that best corresponded to a two-fold amplification, in our case cycle 14 (Fig. 2.2-b). It should be noted that the actual template concentration used in each experiment was measured using the PicoGreen assay, and kept dilute enough to avoid high amplification nearing PCR saturation.
31
analyzed in triplicate and a relative standard deviation (RSD) of less than 5% was typical. A linear dynamic range of approximately 50:1 was established. The upper end of this range is set by the need to remain in the exponential PCR region and the lower end is limited by variability in the background fluorescence in the PicoGreen assay (which is the source of the small y-intercept in the fit of Fig. 2.2-c). This range set the boundaries for output amplifications still considered reliable, and contributed to the determination that a pBR322 input concentration for PCR of 0.05 ng/μL provided the desired sensitivity.
After optimizing the assay, two controls were included in all subsequent PCR
32
Figure 2.2-Detection of DNA photolesions using quantitative PCR.(a)The presence of a bulky photolesion (x) in the irradiated sample causes a reduction in PCR amplification. (b) Depiction of the exponential, linear, and plateau phase of the PCR reaction. The exponential phase cycle resulting in a two-fold increase in amplification was chosen, cycle 14 for our samples. (c) A dilution series of the input amount of DNA was used to determine the range over which
33
b. Statistical treatment of randomly distributed DNA photolesions
Since the number of damage sites on a single strand is not detected directly, the amount of damage must be treated statically. This results from an inability to distinguish the reduction in amplification from multiple lesions on the same strand from the reduction in amplification from a single lesion (Fig. 2.3). The formation of photolesions is a random process governed by the Poisson distribution 35, which is applicable to situations involving occurrences that happen at a well-defined average rate but that are independent of previous events. The probability P that a specific strand has exactly n lesions if the average number of lesions per strand is µ is given by:
𝑷(𝒏) =µ𝒏𝒏!𝒆−µ (1)
The average number of lesions formed per strand can be determined from the probability of detecting a strand that is devoid of lesions, known as the zero class probability (n = 0).
The QPCR assay only amplifies undamaged strands, so its output is directly proportional to the zero class probability 32. Therefore, the average number of lesions formed on each strand is calculated from the measurable ratio of the amount of DNA produced in the PCR reaction of the irradiated DNA to the amount produced from unirradiated DNA:
µ = − ln (DNA produced from unirradiated templateDNA produced from irradiated template ) (2)
34
Figure 2.3- Poisson statistics are required to determine the number of DNA lesions from the
35 2. UV-induced DNA photodamage
We evaluated the ability of the QPCR assay to detect photolesions by investigating the damage resulting from DNA exposure to well defined dosages of 254 nm UV radiation. The exposures were conducted in a Spectroline UV oven and the amount of radiation was measured by means of a chemical actinometer. This method enabled the accurate determination of the number of photons incident on the sample by means of measuring the formation of UV sensitive product with a spectrophotometer. The amount of lesions produced by the UV light was quantified using the QPCR assay.
The rate of lesions formation dependence exhibited a well defined linear response up to a threshold exposure nearing 3 x 10-12einsteins followed by a plateau of ~4 lesions/strand (Fig. 2.4). Typical error estimates on the assay lesion measurements were around 10% RSD for these exposures. The linear region is consistent with a one photon excitation process in
36
The initial linear region of the damage curve was used to determine the quantum yield of lesion formation. A linear regression was performed to obtain the slope (Fig. 2.4), which was used in conjunction with the pBR322 concentration to obtain the QY of lesion formation. We have defined ΦD here as moles photolesions/moles photons absorbed, which does not account for thymine proximity or abundance. This represents a value indicative of the damage rates that could be realized with genomic DNA. The calculation of the UV dosage absorbed
accounted for the differential absorption of 254 nm light by DNA as compared to the absorbing actinometer species 29 by the ratio of their photon absorptions using Beer’s Law. These values were estimated from the optical density of the actinometer as reported by Rahn et al. (OD=200 at 254nm) and the optical density of double stranded nucleic acid (OD=1 at 260 nm for 50 ng/µL). The pathlength of irradiation was the radius (0.21216 cm) of the 20 µL hemisphere to which the sample was assumed to conform. These corrections yielded a value for the ΦD of 7.86 (± 0.73) x 10-4.
Our experimentally determined quantum yield is considerably smaller than often cited ΦD of 0.02 36 (determined for E. coli samples) but similar in magnitude to the more recent value of 1.8 x 10⁻³ determined for pBR322 by Gut et. al36.This discrepancy between our reported value and previous investigations could be the result of the selectivity of our assay, since abasic sites that contribute to the lesions detected in enzyme based assays are not detected by QPCR 37, or due to the nature of the nucleic acids under investigation. Many previous investigations
37
38
dimerization 25. More native configurations of genomic DNA could reduce the possibility of dimer formation through a low abundance of thymine bases compared to chain length, spatial separation of adjacent pyrimidines along the chain, and reduction in the occurrence of
favorable thymine-thymine configurations due to secondary structure formation 38, 39.
As a further comparison, if the photon absorption is scaled by the number of adjacent thymine bases (as is the case with the often cited value of 0.2) , which accounts for the number of absorption events that can lead to dimer formation, then ΦD is revised to 0.0133, in close agreement with previous determinations. These two approaches imply different models of energy transfer along the DNA chain length following an absorption event. Assuming each nucleotide has a similar absorption cross section, the latter model (in which the quantum yield is scaled for the number of adjacent thymines) corresponds to a mechanism in which all absorption events generate an exciton that propagates along the DNA chain until neighboring thymines are encountered (thymines exhibit the highest probability for dimerization of the four nucleotides). Thus energy transfer is efficient and can potentially occur over long distances. The former calculation, in which the cross section is unscaled by neighboring thymine
abundance, implies that energy transfer is very limited, with dimerization only occurring if the absorption event occurs in close proximity to neighboring thymine bases. Comparisons to work conducted with poly-thymine, which indicated a QY much higher than the value we
determined, tend to suggest the latter model in which excitons can travel large distances over DNA before arriving at a thymine-thymine energy trap 1.
39
Based on the two-photon absorption cross section data of fluorescent molecules, it is possible to achieve two-photon absorption in the wavelength region corresponding to twice the one-photon absorption spectrum for many species, but the two-photon absorption maximum can be blue-shifted relative to twice the one-photon absorption maximum 19. This line of reasoning predicts that DNA could exhibit two-photon absorption of visible light between 400-600 nm, with a maximum at or below 520 nm. The near-infrared pulses produced by a
femtosecond Ti:sapphire laser can be frequency-doubled to produce visible pulses in this wavelength range with peak intensities sufficiently high to achieve two-photon absorption in molecules with a reasonable cross section. Therefore, we decided to irradiate DNA with focused femtosecond visible pulses and employ the QPCR assay to quantify the extent of two-photon absorption-induced damage. To produce a realistically detectable amount of damaged DNA, we employed our multiphoton microscope setup to scan the focused beam through a small volume of DNA solution. We chose a 10X 0.3NA objective lens to maximize the scan area, with the realization that the beam waist is larger than is typically used for high-resolution imaging. This required us to irradiate samples with higher average laser powers than are used in multiphoton microscopy.
We used irradiation wavelengths of 425 nm, 450 nm, and 475 nm. These wavelengths were chosen to maximize power available after frequency-doubling our Ti:sapphire laser output, since we determined that the incident power needed to be greater than 100 mW in order to obtain detectable amounts of damage. Within experimental error, the rate of lesion formation had a quadratic dependence on the incident power (Fig. 2.5), a defining
40
was found to be less than 8%, with the absolute error ± 0.62 Lesions/Strand. The most parsimonious model to describe the power dependent damage curves was determined using the F-test. This allowed the effect of higher order regression models to be distinguished, which confirmed the data was best modeled by a quadratic expression.
After confirming that photon absorption can lead to damage, we calculated the two-photon absorption cross section of DNA from our data. Our method for calculating this quantity was derived from a basic definition of the two-photon cross section, in which the number of photons absorbed per nucleotide per second, NA2, is proportional to the product of the two-photon cross section of lesion formation and the square of the intensity. Our
experimental observables are related to the time-averaged quantities:
〈𝑁𝐴2〉 = 𝜎2〈𝐼2〉 (3)
The value of NA2 can be calculated from the observed number of lesions per strand by:
〈𝑁𝐴2〉 =
𝐿𝑒𝑠𝑖𝑜𝑛𝑠 𝑆𝑡𝑟𝑎𝑛𝑑 ⁄
𝛷𝐷∗𝑇∗𝑛 (4)
41
Given the important dependence of the peak laser power and two-photon cross
42
Figure 2.5- Power-dependent damage produced by irradiation of DNA samples with focused