OXIDATIVE ELECTROCHEMISTRY OF MOLECULAR CATALYSTS
Andrew G. Walden
A dissertation submitted to the faculty at the University of North Carolina at Chapel Hill in partial fulfillment of the requirements for the degree of Doctor of Philosophy in the
Department of Chemistry.
Chapel Hill 2016
Approved by:
Alexander J. M. Miller
Joseph L. Templeton
Maurice S. Brookhart
Frank A. Leibfarth
ABSTRACT
Andrew G. Walden: Oxidative Electrochemistry of Molecular Catalysts (Under the direction of Alexander J. M. Miller)
The tris(2-pyridyl)phosphine oxide (Py3PO) complex [Ru(Py3PO)(bpy)(OH2)]2+ (bpy
is 2,2'-bipyridine) is a pH-dependent water oxidation electrocatalyst that accelerates
dramatically with increasing pH — up to 780 s−1 at pH 10 (~1 V overpotential). Despite retaining the pentakis(pyridine) ligand arrangement common to previously reported catalysts, the tripodal Py3PO ligand framework supports much faster electrocatalysis. The early stages
of the catalytic cycle are proposed to follow the typical pattern of single-site ruthenium
catalysts, with two sequential 1H+/1e– proton-coupled electron transfer (PCET) oxidations, but the pH-dependent onset of catalysis and rapid rates are distinguishing features of the
present system.
Witha view towards replacing sacrificial hydrogen acceptors in alkane
dehydrogenation catalysis, electrochemical methods for oxidative activation of a
pincer-ligated iridium hydride intermediate were explored. A 1H+/2e– oxidation process was observed in THF solvent, with net hydride loss leading to a reactive cationic intermediate
that can be trapped by chloride. Analogous reactivity was observed with the concerted
hydride transfer reagent Ph3C+, and with chemical oxidants and bases, connecting chemical
Coordination by pyridine was shown to stabilize the cationic hydride intermediate
generated from 1H+/2e– oxidation of iridium hydrides complexes. A series of cationic hydride complexes incorporating pyridine, 2,6-lutidine, 2-ethylpyridine, or 2-phenylpyridine
was synthesized and characterized. The deprotonation of these cationic hydrides resulted in
solvent activation reactions as well as formation of cyclometallated derivatives of
2-phenylpyridine and added biphenyl. Activation of strong C-H bonds upon deprotonation
strongly suggests the generation of the 14e– Ir(I) species that is implicated in alkane dehydrogenation mechanisms. This reactivity coupled with dihydride oxidation at an
ACKNOWLEDGEMENTS
I would first like to thank Professor Alex Miller, who has been a supportive and
encouraging boss. I would also like to thank my labmates in the Miller Group. Thank you
all for making the Miller Lab a great place to be.
Thank you to my many collaborators in both the Solar Fuels EFRC at UNC and as
part of CENTC. Particular thanks to Professor Alan Goldman, Akashi Kumar, Nick Lease,
and Andrea Casuras. Also thank you to Dr. Peter White for your help with crystallography.
Thank you to Joe Templeton and Maurice Brookhart for your guidance during my
time at UNC. To Simon Meek and Frank Leibfarth thank you for serving on my defense
TABLE OF CONTENTS
LIST OF TABLES………..…………..ix
LIST OF FIGURES……….………..x
LIST OF SCHEMES………..xiv
LIST OF ABBREVIATIONS AND SYMBOLS………...xvi
CHAPTER 1: Introduction ……...1
1.1 Catalysis and Electrochemical Method………1
1.2 Water Oxidation..……….5
1.3 Electrochemical Alkane Dehydrogenation..………..………12
1.4 References………..………....17
CHAPTER 2: Rapid Water Oxidation Electrocatalysis by a Ruthenium Complex of the Tripodal Ligand Tris(2-pyridyl)phosphine Oxide………...20
2.1 Introduction………20
2.2 Synthesis of Py3PO Ligand and Ruthenium Complexes………...22
2.6 Electrokinetic Analysis………..47
2.7 Hydrogen Peroxide as an Intermediate Toward Water Oxidation……...………..56
2.8 Experimental………..62
2.9 References………..78
CHAPTER 3: Electrochemical and Chemical Routes to Hydride Loss from an Iridium Dihydride………...……….82
3.1 Introduction………....82
3.2 Electrochemical Oxidation of Iridium Dihydride Species.………85
3.3 Identifying the Oxidation Product……...………..87
3.4 Stoichiometric Reactions………...………89
3.5 Chemical and Electrochemical Reactivity……….………91
3.6 Experimental Details……….………...….…...93
3.7 References………..…………99
CHAPTER 4: Synthesis and Reactivity of Cationic Hydride Speceis….…..………...101
4.1 Introduction………..101
4.2 Trapping Cationic Hydride Species with Pyridine Bases………...103
4.3 Synthesis of Cationic Hydride Intermediates………..………106
4.4 Deprotonation of Cationic Hydride Pyridine Complexes………113
4.6 Experimental Details………119
LIST OF TABLES
Table 2.1. Values of kobs determined from ic/ip method at pH 10.………..52
Table 2.2. Catalytic rate constants for [Ru(tpy)(bpy)(OH2)]2+ 4…...…..………52
Table 4.1. Crystal Data for 3…..………...132
Table 4.2. Bond Lengths for 3……….…..133
Table 4.3. Bond Angles for 3………..………..134
Table 4.4. Crystal Data for 4……….137
Table 4.5. Bond Lengths for 4……….…..138
Table 4.6. Bond Angles for 4………..………..………139
Table 4.7. Crystal Data for 6…..………...142
Table 4.8. Bond Lengths for 6………...………..……...………...………..143
LIST OF FIGURES
Figure 2.1. Structural representation of 2 from XRD.………...24
Figure 2.2. CV of 2 in CH3CN…….………...………...25
Figure 2.3. CV of 3 at various pH in H2O…….………..27
Figure 2.4. CPE of 3 at 1.09 V vs. NHE……….………28
Figure 2.5. UV-vis trace (absorbance normalized) of 3………..28
Figure 2.6. Differential pulse voltammograms from pH 7 to pH 10 (A) and resulting Pourbaix diagram (B) of 3.………...………29
Figure 2.7. UV-vis spectra of [Ru(κ -3-Py3PO)(bpy)OH2]2+(3) at different pH values…….31
Figure 2.8. CV traces of 3 at a range of pH values.………32
Figure 2.9. CV of [Ru(Py3PO)(bpy)(OH2)]2+(3) swept anodically to 1.95 V (red) and 1.2 V (blue) vs. NHE………...……….33
Figure 2.10. A: Controlled potential electrolysis (CPE) of solutions containing 3 (red) and without catalyst (black) at 1.8 V vs. NHE. B: Headspace O2 fluorescence detection during CPE of solutions containing 3 (red) and without catalyst (black).………...………35
Figure 2.11. UV-vis spectra before and after controlled potential oxidative electrolysis, followed by reductive electrolysis………...37
Figure 2.12. Controlled potential electrolysis of 0.45 mM 3 at 1.8 V (red), followed by replacement of the ITO electrode with a fresh electrode and repeated electrolysis (blue)……….…………...38
Figure 2.13. Oxygen percentages measured during controlled potential electrolysis of 0.45 mM 3 at 1.8 V (red), followed by replacement of the ITO electrode with a fresh electrode and repeated electrolysis (blue)……….……...38
Figure 2.17. CV of [Ru(Py3PO)(bpy)(OH2)]2+(blue) and
[Ru(tpy)(bpy)(OH2)]2+(red) at 500 mVs−1……….……….42
Figure 2.18. CV without background correction (A) of 0.48 mM 3 (red), 0.26 mM (green), 0.18 mM 3 (blue), and 0.13 mM 3 (pink), and in the absence of catalyst (black); and plot of ic vs. concentration of catalyst (B) at 1.71 V vs. NHE (background corrected).………...………...44
Figure 2.19. CV of 3 in 0.5 M NaOTf with added phosphate buffer (pH 6.8).…….……….45
Figure 2.20. Current at 1.71 V vs. NHE plotted against phosphate concentration………...45
Figure 2.21 (A) CV of 0.26 mM 3 as a function of scan rate, as indicated in the plot; (B) ic (at 1.71 V vs. NHE) vs. scan rate with 0.13 mM 3 (filled red circles), 0.18 mM 3 (empty green squares), 0.26 mM 3 (filled blue triangles), and 0.48 mM 3 (empty purple diamonds); (C) ic (at 1.56 V vs. NHE) vs. scan rate with 0.13 mM 3 (filled red circles), 0.18 mM 3 (empty green squares), 0.26 mM 3 (filled blue triangles), and 0.48 mM 3 (empty purple diamonds).…………...….49
Figure 2.22. (A) CV of 0.5 mM [Ru(tpy)(bpy)(OH2)]2+ (4) at 250 mV/s; (B) plot of ic (at 1.71 V vs. NHE) vs. scan rate……….50
Figure 2.23. Example CV showing baseline method used to determine ic……….53
Figure 2.24. Simulated catalytic response for an electrocatalytic oxidation with kcat = 1000 s–1.……….……….55
Figure 2.25. Bulk electrolysis solution before and after catalysts followed by reduction to regenerate aquo complex (3).………...………...57
Figure 2.26. Kinetics of Reduction in Air……….………..58
Figure 2.27. Addition of Hydrogen Peroxide to Oxidized Solution………….………..58
Figure 2.28. 2.28 Hydrogen Peroxide Test Calibration………..59
Figure 2.29. Chemical Test for Hydrogen Peroxide Following Electrolysi.………..60
Figure 2.30. Control of Chemical Test with Ru(II) Species……….………..60
Figure 2.31. 1H NMR spectrum of [Ru(κ2-Py3PO)(η6-C6H6)(Cl)][PF6] (1) in CD3CN…...64
Figure 2.34. 1H NMR spectrum of [Ru(κ3-Py3PO)(bpy)(Cl)][PF6] (2) in
CD2Cl2/CD3OD. ………...…66
Figure 2.35. 13C{1H} NMR spectrum of [Ru(κ3-Py 3PO)(bpy)(Cl)][PF6] (2) in CD2Cl2/CD3OD. ………..67
Figure 2.36. 31P{1H} NMR spectrum of [Ru(κ3-Py3PO)(bpy)(Cl)][PF6] (2) in CD2Cl2/CD3OD. ………..67
Figure 2.37. UV-vis spectrum of [Ru(κ3-Py3PO)(bpy)(Cl)][PF6]..………...68
Figure 2.38. 1H NMR spectrum of [Ru(κ3-Py3PO)(bpy)(H2O)]2+ (3) in D2O……….….…..69
Figure 2.39. 13C{1H} NMR spectrum of [Ru(κ3-Py 3PO)(bpy)(H2O)]2+ (3) in D2O...……...70
Figure 2.40 31P{1H} NMR spectrum of [Ru(κ3-Py3PO)(bpy)(H2O)]2+ (3) in D2O………...70
Figure 2.41. UV-vis spectrum of [Ru(κ3-Py3PO)(bpy)(H2O)]2+..……….………….71
Figure 2.42. Structure of 2 with atom labels………..……….73
Figure 3.1. Cyclic voltammetry of 2.………….……….……...85
Figure 3.2. Photograph of the Experimental Setup for Bulk Electrolysis………...94
Figure 3.3. 31P{1H} NMR spectra of an equilibrium mixture of 2 and 3 before electrolysis (top blue trace) containing <5% of a small impurity, the reaction mixture following electrolysis (middle red trace), and the product distribution after removal of [Bu4N][PF6] electrolyte showing high yield of complex 1 (bottom red trace)…. 95 Figure 3.4. Voltammogram of (tBu4PCP)Ir(H)2 (2) under argon according to the general procedure……….…..97
Figure 3.5. Voltammogram of 2 after exposure to N2, according to the general procedure………...97
Figure 3.6. Controlled potential electrolysis of 2 at 0.2 V vs Cp2Fe+/0 (no added chloride).………..…...98
Figure 4.3. Structural representation of 4 from XRD……..……….111
Figure 4.4. Structural representation of 6 from XRD………...112
Figure 4.5. 1H NMR Spectrum of addition of excess pyridine to (tBu4PCP)Ir(H)2 (1).…….121
Figure 4.6 31P{1H} NMR Spectrum of addition of excess pyridine to (tBu4PCP)Ir(H)2 (1)……….121
Figure 4.7. 1H NMR Spectrum of addition of excess 2,6-lutidine to (tBu4PCP)Ir(H)2 (1).………...….122
Figure 4.8 31P{1H} NMR Spectrum of addition of excess 2,6-lutidine to (tBu4PCP)Ir(H) 2 (1)……….122
Figure 4.9. 1H NMR Spectrum of addition of pyridine to (tBu4PCP)Ir(H)2 (1).…………....123
Figure 4.10. 1H NMR Spectrum of addition of 2,6-lutidine to (tBu4PCP)Ir(H)2 (1).…...123
Figure 4.11. 1H NMR spectrum of 3..………...…125
Figure 4.12. 31P{1H} NMR spectrum of 3..……….………….………125
Figure 4.13. 1H NMR spectrum of 4..………...…127
Figure 4.14. 31P{1H} NMR spectrum of 4..……….………….………127
Figure 4.15. 1H NMR spectrum of 5.………128
Figure 4.16. 1H NMR spectrum of 6..………...…130
Figure 4.17. 31P{1H} NMR spectrum of 6..……….………….………130
Figure 4.18. Structure of 3 with atom labels...………132
Figure 4.19. Structure of 4 with atom labels…….………137
LIST OF SCHEMES
Scheme 1.1. Scheme 1.1 Solar Fuels Scheme………..………...5
Scheme 1.2. Scheme 1.2 Schematic Diagram of DSPEC Design (From UNC EFRC)…...6
Scheme 1.3. Water Oxidation Thermodynamics……….………..7
Scheme 1.4. Water Oxidation Catalysts………8
Scheme 1.5. Water Oxidation Mechanism...10
Scheme 1.6. Alkane Dehydrogenation and Uses of Alkenes………..12
Scheme 1.7. Sacrificial Hydrogen Acceptors and Alternatives……….……...13
Scheme 1.8. Hydrogen Acceptor Regeneration Scheme………..…………...15
Scheme 1.9. Accepting H2 from the Iridium at an Electrode………...……..………….16
Scheme 2.1. Synthesis of Ruthenium Complexes………...22
Scheme 2.2. Comparison of Complex 2 with Chloride Complexes from ref 37……….26
Scheme 2.3. Equation used to Calculate Electrochemical Rates……….34
Scheme 2.4. Depictions of Two Distinct Mechanistic Steps………...43
Scheme 2.5. Equation Describing Catalytic Current………...47
Scheme 2.6. Equation for Catalytic Current Divided by Randles-Sechik Equation…….…..51
Scheme 2.7. Equations 4 and 5………51
Scheme 3.1 Alkane Dehydrogenation Catalytic Cycle………...……83
Scheme 3.2. Electrolysis of Iridium Dihydride………...…………88
Scheme 4.2. Coordination of Pyridine Bases to Dihydride species.….………....103
Scheme 4.3. Trapping of the Cationic Hydride Intermediate ………...104
Scheme 4.4. Hydride Abstraction from 1 in the Presence of Pyridine……….……….105
Scheme 4.5. Generation of Cationic Hydride 3 by Halide Abstraction……….………..….106
Scheme 4.6. Equilibrium between 3 and excess pyridine……….………..……….….108
Scheme 4.7. Synthesis of Cationic Hydrides 4-6……….……….………..……….….109
Scheme 4.8. Solvent Activation Following Deprotonation of Cationic Hydrides..…….….114
Scheme 4.9. Formation of κ2 2-Phenylpyridine Products………...…….….116
Scheme 4.10. Aryl CH Activation with Biphenyl ………...………...…….….116
Scheme 4.11. Deprotonation of Complex 6 in neat 2-phenylpyridine …………...…….….117
LIST OF ABBREVIATIONS AND SYMBOLS
° degree(s)
⊥ perpendicular
|| parallel
α Greek alpha: crystallographic angle
β Greek beta: crystallographic angle
γ Greek gamma: crystallographic angle
δ Greek delta: denotes chemical shift reference scale
η Greek eta: ligand hapticity
κ Greek kappa: denotes coordination to metal by x atoms
ν Greek mu: IR absorption band frequency
π Greek pi: denotes bond
θ Greek theta: general angle
σ Greek sigma: denotes coordination to a metal via a single atom
νXY Greek nu: denotes infrared absorbance band corresponding to the
Å angstrom(s)
Ar general aromatic
BArF4 tetrakis(3,5-trifluoromethylphenyl)borate
B(C6F5)4 tetrakis(pentafluorophenyl)borate
BE Bulk Electrolysis
br broad
C Celsius
CV Cyclic Voltammetry
cm-1 wavenumber
d doublet
DPV Differential Pulse Voltammetry
DSPEC Dye Sensitized Photoelectrosynthesis Cell
ΔG° standard Gibbs energy
ΔG‡ Gibbs energy of activation
eq equation
equiv equivalents
Et ethyl, -CH2CH3
Hz Hertz
IR infrared
xJYZ magnetic coupling between atoms X and Y through a distance of x bonds
K Kelvin
kcal kilocalorie
L general ligand, usually 2 e- donor
M general metal atom
m multiplet
m meta
Me methyl, -CH3
min minute(s)
MLCT metal-to-ligand charge transfer
mol mole
MS mass spectroscopy
nBu n-butyl, -C4H9
OTf triflate, trifluoromethane sulfonate: CF3SO3-
p para
Ph phenyl, -C6H5
ppm parts per million
q quartet
R general alkyl group
R, RW crystallographic refinement quality indicators
s singlet (NMR data)
s second
t triplet
TBE Tert-butylethylene (3,3-dimethyl-1-butene)
tBu tertiary butyl, -C(CH 3)3
THF tetrahydrofuran
TMS trimethylsilyl, -Si(CH3)3
Chapter 1 Introduction
Section 1.1 Catalysis and Electrochemical Methods
Reactions that involve adding or removing electrons are some of the most common and important processes to life. The complex structures of photosystem II, for example, allow green plants to store the sun’s energy in chemical bonds through reactions involving the movement of both protons and electrons.1 Inspired by the methods nature has developed to move protons and electrons, chemists are striving to develop more efficient catalysts that exploit the movement of protons and electrons to do new chemistry.
The high energies associated with free electrons result in extremely high reaction barriers for many oxidation reactions.2 A transition metal center can help lower this barrier by storing multiple electron equivalents while a chemical step takes place. Oxidations that involve the transfer of electrons away from a substrate are an important class of reactions that are catalyzed by transition metals.3 Water oxidation, the
alcohol oxidation.7,8 This class of reactions allows for the transformation of more abundant feedstocks like alkanes and alcohols into useful industrial chemicals and
pharmaceutical starting materials. They will also be critical in transformations of alkanes generated by renewable means, for example as a critical piece of alkane metathesis processes to generate diesel fuels.9
Electrochemistry is a great tool for exploring these oxidation reactions.
Performing an oxidation reaction with energy from an electrode replicates the conditions in solar fuels applications or any application where photovoltaics or another renewable source of electricity is the desired energy source. Understanding how catalysts operate under these electrochemical conditions allows for insight into the reactions and can help direct the synthesis of new generations of catalysts.
Electrochemical experiments are valuable for characterizing catalysts. Knowing the redox potentials associated with a molecular catalyst is an important part of its characterization. It rapidly gives insight into the effects of ligand substitution and other synthetic changes on the electronics of the molecule. Cyclic voltammetry (CV) and differential pulse voltammetry experiments (DPV) experiments provide this sort of information about the electronic structure of molecules.10
a information about the electronic structure of a catalyst as well as the expected process
at different potentials and pHs.
There are a number of well-established methods for determining rate constants
from electrochemical data.10 Many of these methods, like measuring plateau currents and
foot of the wave analysis, can be used to determine idealized rate constants or theoretical
maximum turnover frequencies.11 These methods can be useful for comparing catalysts
under idealized conditions, but with an eye toward device incorporation or practical use it
is more valuable to have information about a catalysts at a specific applied potential or
under a specific set of concentration conditions. For this purpose, methods that report a
catalyst’s rate at specific applied potential are the most useful, and can often be relatively
simple. For example, some methods calculate rate constants by comparing catalytic
currents with the current at a well-defined redox couple of the catalytic molecule.12 These
practical methods for determining rates are also ideally suited for exploring catalytic
activity under realistic conditions, concerning catalyst concentration and substrate
diffusion rates.10
The selectivity of a catalytic system can also be explored using electrochemistry.
Electrochemical methods allow for the correlation between potential and product
distribution to be explored in great detail. Electrochemical methods can also allow for
the selectivity of the desired reactions relative to background reactions not catalyzed by
the molecular catalyst to be analyzed. Changing conditions as well as potential can vary
Electrochemical methods also allow for the relationship between rate or selectivity and pH to be explored. With chemical oxidants, like cerium(IV), which is often used in water oxidation studies, the stability of the chemical oxidation limits studies to acidic conditions.13 Electrochemical methods widen the pH range that can be studied, only limited by catalyst stability and the background reaction of the chosen electrodes with the solvent. With non-aqueous systems solvent effects can be explored, as well as substrate concentration effects when reactions are not run neat.14 Substrate dependence data can even be gathered for water oxidation systems when the concentration of water in a solvent like propylene carbonate is adjusted.14
Section 1.2 Water Oxidation
As the focus of our energy economy shifts to rely more heavily on renewable
sources better ways to utilize solar energy are necessary.5 Solar fuels strategies that store the sun’s energy in the form of chemical bonds are likely to be an important part of any
renewable energy schemes. 4-6,15 These methods attempt to mimic, at least from a broad view, the ways in which green plants store the sun’s energy.1
Scheme 1.1 Solar Fuels Scheme
Energy storage is certainly one of the most significant challenges to exploiting the
suns energy. This is a particular disadvantage of photovoltaic systems that convert
sunlight directly into electricity, as this energy must either be used immediately or stored
by some method, generally chemical batteries.16 Increasing the percentage of our energy that comes from renewable sources is limited by our ability to integrate these sources
with existing energy infrastructure.4 The ability to generate transportation fuels from sunlight would be a significant advancement.
H2O catox 1/2 O2+2 H++ 2 e
-2 e-+2 H+ +CO
2 catred CO + H2O Sunlight
generate the protons and electrons. On the other side of the cell (separated by a proton permeable membrane) the photocathode again decorated with chromophores and catalysts, uses the generated protons and electrons to reduce carbon dioxide and form fuels.5
Scheme 1.2 Schematic Diagram of DSPEC Design (From UNC EFRC)17 The design and construction of a DSPEC is a challenging, multifaceted problem. There are many pieces that all must function in concert; understanding and optimizing the performance of each component and how they function together is what makes the
Along with all of these challenges, the design of good catalysts for water oxidation is critical. Regardless of the product of CO2 reduction that is generated at the photocathode, the oxidation of water to generate protons and electrons must take place at the
photoanode. The energy stored in whatever fuel is generated at the photocathode is linked closely with the equivalents of water that are oxidized in its production.18 The generation of protons and electrons from water is the linchpin of a solar fuels cycle. It is the essential element that differentiates the process from fossil fuel exploitation.
The water oxidation catalyst employed needs to operate quickly to allow it to keep with solar flux and prevent decomposition pathways that come from storing oxidizing equivalents on chromophores or catalysts.19 Additionally a catalyst should be able to operate at the potentials that can be applied by the device. The use of carbon dioxide as a carbon source means that DSPEC devices will likely operate with aqueous carbonate buffer solutions so a catalyst that operates well at basic pHs is also required.5 A catalyst that is amenable to surface attachment, individually or as part of chromophore catalysts assemblies, is also required for incorporation into a DSPEC.5,19
Scheme 1.3 Water Oxidation Thermodynamics
The water splitting reaction is challenging on multiple levels. The generation of
2 H
2O O
2+ 4 H
++ 4 e
-4 H
++ 4 e
-2 H
2energy intermediates like !OH radicals. Transition metals are promising candidates to facilitate these coupled transfers. The areas with the most pressing need for improvement are the kinetic behavior of the catalysts, the overpotential at which they operate, and the stability of the catalyst. Homogenous catalysts have the potential to allow for
improvements to be made in many of these areas. They often operate at very high rates, are easier to characterize than heterogeneous systems, and provide a means to study and elucidate mechanism.
The first molecular water oxidation catalyst reported was ruthenium based.20 Ruthenium has continued to be widely used in molecular water oxidation catalysts. These catalysts come in both monomer and dimer forms.21,22 They generally incorporate chelating ligands, which stabilize the coordination sphere while leaving the sixth
coordination site available for catalysis.
A large fraction of the current generation of molecular water oxidation catalysts contain meridionally coordinated tridentate polypyridyl ligands.22 These neutral six electron donors are well suited for water oxidation catalysis: the nitrogen atoms are strong donors and the aromatic rings make them oxidatively robust, an important property for catalysts that must be stable under water oxidation conditions.
Scheme 1.4 Water Oxidation Catalysts N
N N N NRu
N H2O
2+
N
Ru N
N
N N N
2+
H2O Ru
N
N
N N
O O O
Many molecular ruthenium systems, like those shown in scheme 1.4, show good activity, decent stability and in some cases very impressive rates. 23-25 These impressive rates are in many cases reported with the use of ceric ammonium nitrate in massive excess as a chemical oxidant.25 These experiments must be conducted at acid pHs with Ce(IV) providing driving force above thermodynamic requirements. These conditions while useful for quickly screening catalysts activities are less useful if device
incorporation is the goal for a catalyst. In a device driving force will be provided by the photoanode and likely at basic pHs.
Bulk electrolysis methods are the best electrochemical methods to monitor catalyst performance over time. They also allow for calculation of Faradaic efficiencies, the percentage of current passed that is going to product. There are various methods for monitoring oxygen production from a catalyst.12,26,27 Methods involving pressure sensors or Clark electrodes can be used to calculate Faradic efficiencies but they often require assumptions to be made about what gaseous products are produced.28 Rotating ring disk experiments are great for identifying products and calculating Faradaic efficiencies, but are less useful for homogeneous systems and are not suitable for bulk experiments.26 Some recent developments have led to collector generator setups being applied to characterization, combining some of the best features of bulk experiments with product identification at an electrode.27
In some cases it is possible that the electronic character of these new ligands contributes
significantly to their high rates. It is also likely that the more electron donating ligands
stabilize the high oxidation state intermediates that are proposed in many catalytic cycles.
Anionic ligands also reduce the overall charge of the molecular catalysts, which reduces
the repulsive forces in bimolecular oxygen-oxygen bond forming steps.21,31
Scheme 1.5 Water Oxidation Mechanism (adapted from 19)
Molecular systems that can catalyze this reaction have been the focus of many
studies in the past 15 years.32,33 Understanding more about the structure function relationships in these systems and how to design molecules that will operate well under
the desired conditions remains an important goal. Electrochemical methods are a great
way to study the behavior of molecular water oxidation catalysts. They also allow for a
variety of conditions that closely replicate those expected in a device to be explored.
Understanding the operation of molecular water oxidation catalysts will allow for [RuII-OH
2]2+
[RuIII-OH]2+
[RuIV=O]2+
[RuV=O]3+ [RuIII-OOH]2+
[RuIV-OO]2+
[RuV-OO]3+
slow slow
H2O
O2
O2, H+
– e–, H+
– e–, H+
– e–
H+
– e–, H+
– e–
H2O
H2O
iterative improvements to be made and the development of the catalysts that will be
Section 1.3 Electrochemical Alkane Dehydrogenation
Alkane dehydrogenation is the generation of an alkene following the removal of
an equivalent of dihydrogen from an alkane. Alkanes are an abundant carbon source and,
alkenes are useful as monomers,7 important starting materials for pharmaceutical fine chemical synthesis and commodity chemicals.34 Understanding more about the
fundamental reactivity and basic chemical steps involved are critical to responding to
changes in petroleum sources, and allowing for shifts to renewable sources of carbon.
Scheme 1.6 Alkane Dehydrogenation and Uses of Alkenes
The ability of iridium pincer complexes to catalyze transfer dehydrogenation has
led to many applications.7 These complexes act as rapid transfer dehydrogenation catalysts giving them utility as olefin isomerization catalysts and allowing them to play a
key role in alkane metathesis schemes. 9,35 They are also competent for the dehydrogenation of a variety of alkanes using sacrificial acceptors, the
dehydroaromatization of n-alkanes, and the dehydrogenation of alkyl groups on a wide
variety of substrates. Reactions involving more complex substrates and heteroatom
substrates have also been demonstrated.7
R R
H N O
Alkane dehydrogenation reactions using iridium pincer catalysts generally employ a sacrificial acceptor. In many of these systems an equivalent of TBE
(tert-butylethylene) is required to accept hydrogen. These reactions could be similary described as a transfer dehydrogenation between an alkane substrate and TBE. The equivalent of TBE provides much of the driving force for the reaction. When a sacrificial acceptor is employed, the alkene produced must be of sufficient value to justify the use of TBE. When a reaction employs a sacrificial acceptor some control over the driving force of the reaction can be exercised but it requires changing the identity of the acceptor.
Ir PtBu2
PtBu2 H H
Ir PtBu2
PtBu2
Ir PtBu2
PtBu2 H Ir PtBu2
PtBu2 H
Net Reaction
– H2
– 2H+/2e–
R R
R + R +
R R + H2
R R + 2H+ + 2e–
An alternative to the use of sacrificial acceptors are thermal, acceptor-less
dehydrogenation methods.36,37 These systems rely on the removal of hydrogen as
gaseous dihydrogen. In order to remove the equivalent of hydrogen in this way, very
high temperatures often need to be employed. This necessitates the design of specialty
pincer catalysts, which are particularly stable to high temperatures.38 In addition to more
specialized catalysts and harsher conditions, a considerable amount of excess energy is
required for acceptor-less dehydrogenation reactions in the form of heat. 36,38
Another alternative would be the use of an acceptor that could be regenerated
easily. The physical separation of the acceptor from the reaction mixture could allow for
its regeneration under conditions that would be incompatible with the catalyst, substrate,
or product. Acceptors could be regenerated by thermal or electrochemical methods
electrochemical. Electrochemical methods would allow for careful control of the driving
force required to regenerate that acceptor. Renewable sources of energy could be used for
reactions conducted on large scales if the principle source of energy input is the potential
applied. At an electrode surface, the acceptor would be regenerated by removing
Scheme 1.8 Hydrogen Acceptor Regeneration Scheme
The idea of removing the equivalent of hydrogen as protons and electrons leads to
another alternative to sacrificial acceptors, the generation of the active iridium fragment
for dehydrogenation directly at an electrode surface as two electrons and two protons in
solution. This would lead to the generation of the active 14e- intermediate from the
dihydride species at the electrode and then dehydrogenation of an alkane to regenerate
the dihydride. There are many advantages to a scheme involving the generation of the
reactive species at an electrode surface. Sacrificial reagents are no longer needed, mild
conditions can be employed, and it is possible reactions could even be run at room
temperature. One of the most powerful advantages of electrochemistry is the ability to
modulate with fine control the driving force for the reaction by altering the applied
potential. This allows for reactions to be run as efficiently as possible and allows for the Ir
PtBu2
PtBu2
H H
Ir
PtBu2
PtBu2
Ir
PtBu2
PtBu2
H
Ir
PtBu2
PtBu2 H H
R R
R
R
Acceptor
Acceptor +H2
2 H+
2e
-2e
-H2O
Scheme 1.9 Accepting H2 From Iridium at an Electrode
Electrochemical methods can provide a way to transform alkane dehydrogenation
chemistry. The ability to remove the hydrogen equivalent in the form of protons and
electrons could erase the need for costly sacrificial hydrogen acceptors. An electrode
also provides an opportunity to tune the driving force of a reaction. Allowing for
reactions to be run efficiently using renewable sources of energy. Tuning oxidation
potentials can also lead to studies relating overpotential to selectivity. In order to realize
any of these goals, the oxidative reactivity of iridium pincer complexes at electrodes must
be explored. Developing conditions which will allow for the removal of two protons and
two electrons from an iridium catalyst to generate the reactive species for alkane
dehydrogenation is the first step in an electrochemical alkane dehydrogenation scheme. Ir
PtBu2
PtBu2
H H
Ir
PtBu2
PtBu2
Ir PtBu2
PtBu2
H
Ir
PtBu2
PtBu2 H
H
R R
R R
2 H+
2e
-2e
-H2O
REFERENCES
(1) McEvoy, J. P.; Brudvig, G. W. Chem. Rev.2006, 106 (11), 4455.
(2) Warren, J. J.; Tronic, T. A.; Mayer, J. M. Chem. Rev.2010, 110 (12), 6961.
(3) Berardi, S.; Drouet, S.; Francàs, L.; Gimbert-Suriñach, C.; Guttentag, M.; Richmond, C.; Stoll, T.; Llobet, A. Chem. Soc. Rev.2014, 43 (22), 7501.
(4) McDaniel, N. D.; Bernhard, S. Dalton Trans.2010, 39 (42), 10021.
(5) Song, W.; Chen, Z.; Brennaman, M. K.; Concepcion, J. J.; Patrocinio, A. O. T.; Murakami Iha, N. Y.; Meyer, T. J. Pure and Applied Chemistry2011, 83 (4), 749.
(6) Joya, K. S.; Joya, Y. F.; Ocakoglu, K.; van de Krol, R. Angew. Chem. Int. Ed.
Engl.2013, 52 (40), 10426.
(7) Choi, J.; MacArthur, A. H. R.; Brookhart, M.; Goldman, A. S. Chem. Rev.2011,
111 (3), 1761.
(8) Bonitatibus, P. J., Jr.; Chakraborty, S.; Doherty, M. D.; Siclovan, O.; Jones, W. D.; Soloveichik, G. L. Proc Natl Acad Sci U S A2015, 112 (6), 1687.
(9) Haibach, M. C.; Kundu, S.; Brookhart, M.; Goldman, A. S. Acc. Chem. Res. 2012, 45 (6), 947.
(10) Rountree, E. S.; McCarthy, B. D.; Eisenhart, T. T.; Dempsey, J. L. Inorg. Chem. 2014, (53), 9983.
(11) Costentin, C.; Drouet, S.; Robert, M.; Savéant, J.-M. J. Am. Chem. Soc.2012,
134 (27), 11235.
(12) Barnett, S. M.; Goldberg, K. I.; Mayer, J. M. 2012, (4), 498.
(13) Wasylenko, D. J.; Ganesamoorthy, C.; Henderson, M. A.; Berlinguette, C. P.
Inorg. Chem.2011, 50 (8), 3662.
(14) Chen, Z.; Concepcion, J. J.; Luo, H.; Hull, J. F.; Paul, A.; Meyer, T. J. J. Am.
Mater. Chem. A 2013, 1 (13), 4133.
(18) Schmidt-Rohr, K. J. Chem. Educ. 2015, 92 (12), 2094.
(19) Concepcion, J. J.; Jurss, J. W.; Brennaman, M. K.; Hoertz, P. G.; Patrocinio, A.
O. T.; Murakami Iha, N. Y.; Templeton, J. L.; Meyer, T. J. Acc. Chem. Res.
2009, 42 (12), 1954.
(20) Gersten, S. W.; Samuels, G. J.; Meyer, T. J. J. Am. Chem. Soc. 1982, 104 (14),
4029.
(21) Chen, Z.; Concepcion, J. J.; Hu, X.; Yang, W.; Hoertz, P. G.; Meyer, T. J. Proc
Natl Acad Sci U S A 2010, 107 (16), 7225.
(22) Limburg, B.; Bouwman, E.; Bonnet, S. Coordination Chemistry Reviews 2012,
256 (15-16), 1451.
(23) Zong, R.; Thummel, R. P. J. Am. Chem. Soc. 2005, 127 (37), 12802.
(24) Calvert, J. M.; Schmehl, R. H.; Sullivan, B. P.; Facci, J. S.; Meyer, T. J.; Murray,
R. W. Inorg. Chem. 1983, 22 (15), 2151.
(25) Duan, L.; Bozoglian, F.; Mandal, S.; Stewart, B.; Privalov, T.; Llobet, A.; Sun,
L. Nat. Chem. 2012, 4 (5), 418.
(26) Concepcion, J. J.; Binstead, R. A.; Alibabaei, L.; Meyer, T. J. Inorg. Chem.
2013, 130919091214001.
(27) Sherman, B. D.; Sheridan, M. V.; Wee, K.-R.; Song, N.; Dares, C. J.; Fang, Z.;
Tamaki, Y.; Nayak, A.; Meyer, T. J. Inorg. Chem. 2015, (5). 2182.
(28) Thomsen, J. M.; Crabtree, R. H.; Schmuttenmaer, C. A.; Sheehan, S. W.;
Hintermair, U.; Brudvig, G. W. Nat. Comm. 2015, (6), 6494.
(29) Kärkäs, M. D.; Akermark, T.; Johnston, E. V.; Karim, S. R.; Laine, T. M.; Lee,
B.-L.; Akermark, T.; Privalov, T.; Akermark, B. Angew. Chem. Int. Ed. Engl.
2012. (51), 1.
(30) Wang, L.; Duan, L.; Stewart, B.; Pu, M.; Liu, J.; Privalov, T.; Sun, L. J. Am.
Chem. Soc. 2012, 134 (45), 18868.
(31) Maji, S.; Vigara, L.; Cottone, F.; Bozoglian, F.; Benet-Buchholz, J.; Llobet, A.
Angew. Chem. Int. Ed. Engl. 2012, 51 (24), 5967.
(33) Yagi, M.; Kaneko, M. Chem. Rev. 2001, 101 (1), 21.
(34) Ahuja, R.; Punji, B.; Findlater, M.; Supplee, C.; Schinski, W.; Brookhart, M.;
Goldman, A. S. Nat. Chem. 2010, 3 (2), 167.
(35) Goldman, A. S. Science 2006, 312 (5771), 257.
(36) Krogh-Jespersen, K.; Czerw, M.; Summa, N.; Renkema, K. B.; Achord, P. D.;
Goldman, A. S. J. Am. Chem. Soc. 2002, 124 (38), 11404.
(37) Hebden, T. J.; Goldberg, K. I.; Heinekey, D. M.; Zhang, X.; Emge, T. J.;
Goldman, A. S.; Krogh-Jespersen, K. Inorg. Chem. 2010, 49 (4), 1733.
(38) Allen, K. E.; Heinekey, D. M.; Goldman, A. S.; Goldberg, K. I. Organometallics
Chapter 2 Rapid Water Oxidation Electrocatalysis by a Ruthenium Complex of the Tripodal Ligand Tris(2-pyridyl)phosphine Oxide
Reproduced in part from, Walden, A. G.; Miller, A. J. M. “Rapid Water Oxidation
Electrocatalysis by a Ruthenium Complex of the Tripodal Ligand
Tris(2-pyridyl)phosphine Oxide.” Chem. Sci. 2015, 6, 2405. with permission from the Royal
Society of Chemistry.
Section 2.1 Introduction
Electrocatalysts for the oxidation of water to dioxygen have shown extraordinary
improvement over the last 10 years, motivated by applications in solar-driven
water-splitting devices.1-4 Water oxidation is thermodynamically unfavorable (∆Gº = +114
kcal/mol = +1.23 V) and kinetically challenging (a 4H+/4e– process),5,6 leading to a
long-prevailing notion that multiple metal centers would be required to efficiently carry out
water oxidation — in accord with the multimetallic nature of the Oxygen Evolving
Complex in Photosystem II and early synthetic catalysts.7-13
The introduction of well-defined “single-site” monoruthenium catalysts in 200514
challenged conventional wisdom and launched a dramatic increase in monometallic
catalysts showing good activity.2,15-18 The fastest catalysts for both electrochemical and
chemical oxidation of water are all single site species. A handful of catalysts have rates
examples. The turnover frequencies of these catalysts as reported in parenthesis above
attest to their rapid rates.
Most Ru catalysts are supported in a meridional fashion by polypyridyl ligands,
following the example of early single-site ruthenium catalysts that paired terpyridine with
a bidentate chelate.2,14,15,20,22-26 We set out to develop water oxidation catalysts supported
by a facially coordinating ligand, a geometry that has been only sporadically examined
for water oxidation.1,27 The tripodal ligand tris(2-pyridyl)phosphine oxide (Py3PO)28 was
appealing because it retains the tris(pyridine) donor set found in many catalysts, but
presents a facial binding arrangement through the oxidatively robust phosphine oxide
linker. In this chapter we descibe new Ru complexes supported by the Py3PO ligand
display good water oxidation activity at modest overpotentials and operate faster than any
Section 2.2 Synthesis of Py3PO Ligand and Ruthenium Complexes
The coordination chemistry of Py3PO is relatively unexplored and complexes are often accessed by post-functionalization of the corresponding tris(2-pyridyl)phosphine
complex.28-32 A new route to the free phosphine oxide ligand was recently reported by Trofimov and co-workers.28 Instead of a low temperature lithiation strategy, red
phosphorus and 2-bromopyridine were heated under strongly basic conditions.
Synthetic routes starting from RuCl3 led to intractable mixtures of products, but metallation was readily accomplished by addition of Py3PO to the benzene complex
[Ru(η6-C6H6)(Cl)2]2 (Scheme 2.1).33 The product precipitated from H2O/CH3OH mixtures as a microcrystalline yellow powder. Surprisingly, the 1H NMR spectrum of the product
featured a singlet (δ 6.11) suggestive of benzene coordinated to Ru; the spectroscopic
data indicated bidentate Py3PO coordination with the formula [Ru(κ2-Py3PO)(η6
-C6H6)(Cl)][PF6] (1).
Scheme 2.1 Synthesis of Ruthenium Complexes
Ru Cl N N N P O N N N N N P O
CH3OH/H2O
40 ºC, 2 h
71% yield
[Ru(C6H6)(Cl)2]2
NH4PF6 Ru
Cl N N N P O 1 DMF 80 ºC, 6 h
43% yield
2,2'-bipyridine
+ PF6–
2
H2O
40 ºC, 2 h 2AgOTf Ru OH2 N N N P O N N 2+ OTf– 3
Py3PO
The bidentate binding mode of Py3PO in complex 1 permitted the selective
installation of a single Py3PO ligand, avoiding previously observed bis(Py3PO)
complexes.29,31,34 Subsequent reaction of bpy with complex 1 in DMF prompted a change
in coordination number, affording the desired tripodal complex [Ru(κ3
-Py3PO)(bpy)(Cl)][PF6] (2). The presence of a phosphorus atom in the ligand backbone
offers a convenient NMR handle to identify new complexes, as illustrated in the ~18 ppm
shift in moving from 1 to 2 (31P{1H} NMR 19.4 for 1 and 2.0 for 2). Red-orange
complex 2 features a crowded aromatic region in the 1H NMR spectrum that is consistent
with Cs symmetry in solution. The ion peaks observed by electrospray ionization mass–
spectrometry (ESI–MS) indicated one inner-sphere chloride, while another chloride had
been replaced with an outer-sphere anion. Complex 2 has an absorbance maximum at 464
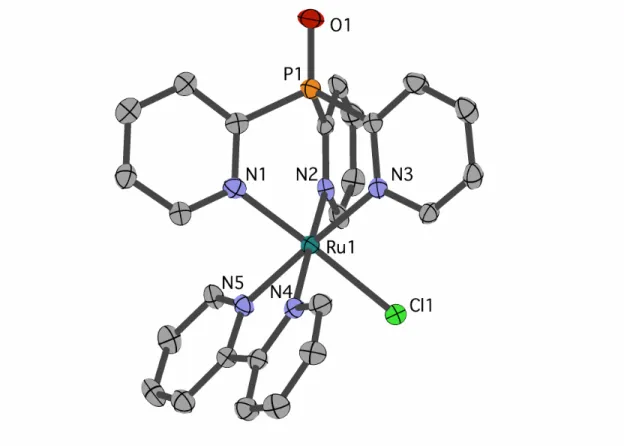
Figure 2.1 Structural representation of 2 from XRD with ellipsoids rendered at 50% probability. Hydrogen atoms, PF6 counter ion and one
dichloromethane molecule are omitted for clarity. Selected bond distances (Å): Ru1-Cl1 2.416(2), Ru1-N1 2.073(5), Ru1-N2 2.106(5), Ru1-N3 2.088(6), Ru1-N4 2.073(8), Ru1-N5 2.057(7).
Single crystals of chloride cation 2 suitable for an X-ray diffraction (XRD) study
were grown from CH2Cl2 layered with Et2O. As seen in Figure 2.1, 2 features a facially
coordinated Py3PO ligand. The pseudo-Cs symmetry observed in solution is maintained
in the solid state
The aquo complex [Ru(Py3PO)(bpy)(OH2)]2+ (3) was synthesized from aqueous
solutions of chloride 2 by addition of two equivalents of silver triflate, followed by
heating at 40 °C for 2 h. 1H, 13C, and 31P NMR spectroscopy and ESI-MS in D2O
confirmed replacement of the inner-sphere chloride ligand with water. Optical transitions
Section 2.3 Electrochemical Characterization
The electrochemical behavior of complex 2 was first investigated in acetonitrile to
facilitate comparisons to other complexes. A single electrochemical feature at 0.60 V vs.
Cp2Fe+/0 was observed by cyclic voltammetry (CV) and assigned to the RuIII/II couple
(Figure 2.2). This potential is within the range reported by Thummell, 0.32 V to 0.90 V
vs. Cp2Fe+/0 for the chloride complexes of a number of known water oxidation catalysts
under the same conditions (Scheme 2.2).37 The oxidation potential of 2 is 180 mV
positive of the analogous [Ru(tpy)(bpy)(Cl)]+ (tpy is 2,2':6',2''-terpyridine) complex,
indicating that the Py3PO ligand is less electron-releasing than tpy.
Scheme 2.2 Comparison of Complex 2 with Chloride Complexes From ref 37
Complexes 2 and 3 were further characterized electrochemically in aqueous
phosphate buffer solutions at neutral pH. CV of chloride complex 2 revealed a
quasi-reversible oxidation at 1.14 V vs. NHE. The oxidation potential was pH independent,
Figure 2.3 CV of 3 at various pH in H2O (0.1 M phosphate buffer). Conditions: glassy carbon disk working electrode, Pt wire counter electrode, Ag/AgCl reference electrode.
CV of aquo dication 3 exhibits a reversible oxidation at 0.78 V vs. NHE in pH 7
0.1 M phosphate buffer (Figure 2.3), assigned to the RuIIIOH/Ru IIOH2 couple. Controlled
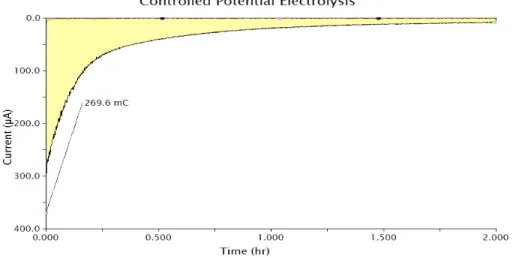
potential electrolysis (CPE) of 1.0 mM 3 at 1.01 V vs. NHE accumulated 270 mC of total
charge, corresponding to 1.1 e–/Ru, as expected for a 1e– process (Figure 2.4). The
absorption spectrum after electrolysis showed a loss of the prominent charge transfer
band of 3 (λmax = 437 nm), consistent with consumption of the Ru(II) and formation of
Ru(III) (Figure 2.5).
!
Figure'2.4'CPE'of'3'at'1.09'V'vs.'NHE.'After'2'hours,'a'total'of'270'mC'of' charge'had'been'passed,'corresponding'to'1.1'e–/Ru.'Conditions:'pH'7' 100'mM'phosphate'buffer,'1.0'mM'3,'twoLcompartment'HLcell,'
reticulated'vitreous'carbon'(RVC)'working'electrode,'Pt'wire'counter' electrode'and'Ag/AgCl'reference'electrode.''
'
Figure 2.5. UV-vis trace (absorbance normalized) of 3 before (red) and after CPE at 1.1V vs. NHE for 2 hours. Conditions: 1.0 mM 3, CPE conducted in a two-compartment H-cell, reticulated vitreous carbon (RVC) working
A second oxidation, attributed to the RuIV=O/RuIIIOH couple, was initially
noticed as a broad, poorly resolved feature in background-subtracted CV experiments.
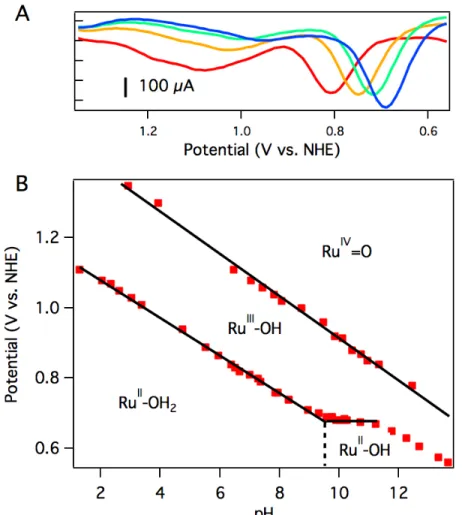
Using differential pulse voltammetry (DPV), however, a better anodic response was
observed at 1.08 V vs. NHE at pH 7 (Figure 2.6A). The broad, poorly resolved oxidation
feature is consistent with slow electron transfer kinetics at the electrode, as observed in
related systems.38
The oxidation potentials of aquo 3 are pH dependent. A Pourbaix diagram was
constructed by performing differential pulse voltammetry (DPV) at various pH values
(0.1 M phosphate buffer, pH adjusted with NaOH). As shown in Figure 2.6B, the first
oxidation potential shows a linear correlation with pH from pH 1.5 to pH 9.5 before
reaching a pH-independent region. The slope of 54 mV per pH unit is close to the
Nernstian ideal for a 1H+/1e– process (59 mV per pH unit). Figure 2.6B indicates that 3
has a pKa of 9.5, and the solution contains [Ru(Py3PO)(bpy)(OH)]+ at more basic pH
values. Consistent with this notion, a color change was observed upon addition of NaOH
to a pH 7 solution of 3 (Figure 2.7). At pH 7, the major peak in the mass spectrum is
[Ru(k3-Py3PO)(bpy)(OH2)]2+ (observed m/z: 278.4, calculated m/z: 278.53); at pH 10.7,
the peak at 278.4 is not observed, having been replaced by a prominent peak for [Ru(k-3 -Py3PO)(bpy)(OH)]+ (observed m/z: 555.99 calculated m/z: 556.05). The second
oxidation potential shows a liner correlation with pH over the entire observed region. A
Figure 2.7 UV-vis spectra of [Ru(κ-3-Py3PO)(bpy)OH2]2+ (3) at different pH
values. Deprotonation occurs between pH 7 and pH 10.7 (with a mix of species observed at pH 8.7), consistent with the electrochemically estimated pKa value of 9.5.
Another pH-dependent process is observed under strongly basic conditions (pH
11 to 14). In this region, CV reveals a loss of reversibility in the oxidation wave, with no
accompanying reduction feature visible on the return sweep (Figure 2.8). The loss of
reversibility may indicate the presence of a rapid chemical process, perhaps through
base-catalyzed disproportionation of RuIII–OH2+ to afford RuIV=O+ and RuII-OH22+. This
irreversible electrochemical behavior may be responsible for the non-Nernstian response
Figure 2.8. CV traces of 3 at a range of pH values. The return reduction disappears above pH 12. in H2O (0.1 M phosphate buffer). Conditions: 100
Section 2.4 Electrocatlysis at pH 7
Initial screening for electrocatalytic activity was carried out with a CV sweep to
positive potentials. Chloride complex 2 exhibited only the previously observed oxidation
at 1.14 V vs. NHE at pH 7, and no significant current increase above background was
observed out to 1.7 V. The lack of current response suggests that chloride 2 is a slow or
inactive water oxidation catalyst.
Aquo complex 3, on the other hand, exhibited dramatic current enhancement upon
scanning positive (Figure 2.9), with onset of catalysis around 1.5 V vs. NHE at pH 7.
Qualitative detection of the resulting O2 was possible by performing a CV sweep to
negative potentials after reaching the catalytic regime. A broad, irreversible reduction
near –0.5 V is only observed after a catalytic current response and is assigned to O2
reduction catalyzed by the glassy carbon electrode surface (Figure 2.9). 19,39
The rate of catalysis was assessed using methods developed by Delahay &
Stiehl,40 Nicholson & Shain,41 and Savéant & Vianello,42 adapted for a multi-electron
process.43,44 Equation 1, in scheme 2.3, relates the observed catalytic current (ic) to kobs,
the observed rate constant at a given potential. The observed rate constant, kobs, is
potential-dependent and is dependent on the amount of oxidized catalyst available (see
section 2.6 for derivation and full details), analogous to Savéant's potential-dependent
turnover frequency value.44,45 This equation provides the rate of catalysis under practical
conditions—at any applied potential. The value kobs is also a lower limit of the rate
constant describing “ideal”catalysis in which the rate is limited only by a chemical step
(denoted kcat). Equation 1 requires that the catalytic current (ic) is independent of the scan
rate; accordingly, catalyst 3 exhibits scan-rate independent current response above 250
mV·s-1.
!!
!!= 2.24
!!
!! !" !!!
!
! !!"# (1)
Scheme 2.3 Equation used to Calculate Electrochemical Rates
The rate of water oxidation at pH 7 increased with increasing overpotential, with a
rate constant of 72 ± 10 s-1 at 1.7 V (0.9 V overpotential). The background contribution
of water oxidation directly at the glassy carbon electrode was negligible under these
conditions.
For comparison, a previously reported Ru catalyst featuring a meridionally-bound
tridentate ligand, [Ru(tpy)(bpy)(OH2)]2+ (4)15,16,18,25,37 was examined under identical
conditions. The electrochemical current enhancement for catalyst 4 was less pronounced.
Sustained catalysis was achieved through controlled potential electrolysis with
planar tin-doped indium oxide (ITO) working electrodes. When solutions of 3 in aqueous
0.1 M phosphate buffer at pH 7 were held at 1.8 V vs. NHE, a current density of 4.1
mA·cm–2 was sustained for 2 hours, as shown in Figure 2.10A. During electrolysis,
bubbles formed on the surface of the planar ITO electrode. The electrolysis could be
carried out under N2 or air without significant changes.
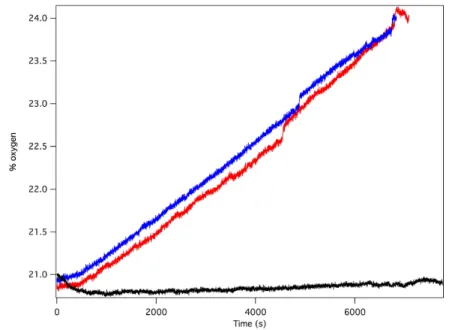
Oxygen in the headspace was quantified by a fluorescence sensor during
controlled potential electrolysis (Figure 2.10B). To avoid false positives due to small
leaks into an N2 atmosphere, controlled potential electrolysis was carried out under air,
and the percentage of O2 present in the headspace monitored over time. After a short
induction period attributed to mass transport of O2 from the solution near the electrode to
the headspace, the oxygen content steadily increased during the course of the experiment,
providing a 70% Faradaic efficiency. This value is likely a conservative estimate, as the
cell invariably contained a small leak, as evidenced by a slow, steady decrease in O2
content after release of the applied potential. The charge passed in a typical two-hour
experiment corresponds to roughly 10 total turnovers. This value indicates that the
system is indeed catalytic but does not reflect the true catalytic activity because most of
the catalyst is inactive during controlled potential electrolysis in typical electrochemical
cells with solution phase catalysts.
The catalyst remained intact after electrolysis, despite observations that the bright
yellow color of the starting solutions had faded considerably. Absorption spectra of the
solution following catalysis corresponded nicely to the absorption spectrum of
[RuIII(Py3PO)(bpy)(OH)]2+, suggesting a Ru(III) resting state during catalysis, rather than decomposition. Consistent with this hypothesis, CPE reduction of the solution after
Figure 2.11 UV-vis spectra before and after controlled potential oxidative electrolysis, followed by reductive electrolysis. Conditions: 0.45 mM 3, pH 7 0.1 M phosphate buffer, planar ITO working electrode, Pt wire counter electrode, Ag/AgCl reference electrode.
The post-electrolysis solution could also be recycled When a fresh ITO electrode
was used to carry out another catalytic run, by replacing the electrode in a solution that
had just been electrolyzed,the current density and oxygen production were essentially the
same as the first run (Figure 2.12 and 2.13). The similar catalytic behavior between the
two catalytic runs suggests that significant catalysts decomposition is not occurring in
Figure 2.12 Controlled potential electrolysis of 0.45 mM 3 at 1.8 V (red), followed by replacement of the ITO electrode with a fresh electrode and repeated electrolysis (blue) to test the recyclability of the catalyst.
Background electrolyses containing no catalyst are shown in black.
Conditions: pH 7 0.1 M phosphate buffer, planar ITO working electrode, Pt wire counter electrode, Ag/AgCl reference electrode.
A rinse test was performed on the original ITO electrode, but the electrode itself
showed no detectable current above background levels after being gently rinsed with
water and moved to a fresh aqueous buffer containing no catalyst (Figure 2.14). These
observations suggest that the catalytic activity of the system is not the result of the
formation of a catalytically active film on the surface of the electrode. The rinse test and
the recyclability of the catalysts solutions are consistent with a well-behaved
homogeneous catalyst.
Section 2.5 pH Dependent Electrocatalysis
The electrocatalytic response increased dramatically as the pH increased towards
pH 10, as shown in Figure 2.15. The two most striking features of the pH dependence are
(a) a steady shift in the catalytic onset potential to less positive potentials with increasing
pH; and (b) a steady increase in maximum current passed, eventually reaching a 5-fold
enhancement at pH 9.77. A linear decrease in the overpotential required to achieve 40 µA
of catalytic current was observed as the pH was raised (Figure 2.16).
Figure 2.16 Plot of potential required to achieve 45 µA current vs. pH. A linear correlation with a 77 mV per pH unit slope is roughly as expected for a 1H+/1e− PCET event.
The observed catalytic rate constant at pH 10 was kobs = 73 ± 10 s−1 at 0.9 V
overpotential — the same rate as observed for 0.9 V overpotential at pH 7. At higher
overpotentials, the rate increased sharply, culminating in kobs = 780 ± 100 s−1 at 1.05 V
overpotential. While the background response at pH 7 is negligible, catalysis by glassy
carbon can comprise up to ~25% of the current response at pH 10. The rate data at pH 10
is conservatively estimated based on background-corrected data. Catalyst 3 was the
fastest Ru water oxidation catalyst at the time of publication.1
The catalytic rates were again compared directly with [Ru(tpy)(bpy)(OH2)]2+ (4).
A rate constant of only 12 ± 5 s-1 was observed at 1.7 V (1.05 V overpotential) at pH 10.
Figure 2.17 CV of [Ru(Py3PO)(bpy)(OH2)]2+ (blue) and
[Ru(tpy)(bpy)(OH2)]2+ (red) at 500 mV·s−1 (catalyst-free background in
black). Conditions: pH 10, 0.1 M phosphate buffer, 3 mm glassy carbon disk working electrode, Pt wire counter electrode, Ag/AgCl reference electrode.
The potential of catalytic onset for [Ru(tpy)(bpy)(OH2)]2+ is essentially pH
independent, such that higher overpotentials are required to achieve the same catalytic
rate constant as the pH is increased. This pH-independent behavior is common to a
number of water oxidation electrocatalysts,25 and is attributed to the mechanistic
involvement of a pH-independent RuV=O/RuIV=O couple that precedes O–O bond
formation.25 The thermodynamic potential of water oxidation shifts to less positive
potentials by 59 mV per pH unit while moving to more basic pH, so a catalyst with a
fixed onset potential will exhibit increasingly large overpotentials at higher pH values.
Complex 3, on the other hand, retains good catalytic rates while maintaining a constant
Scheme 2.4 Depictions of Two Distinct Mechanistic Steps
The mechanisms shown in Scheme 2.4 were considered as possible explanations
for the unusual pH dependence in catalysis supported by 3. A plot of catalytic current (ic)
vs. catalyst concentration was linear (Figure 2.18), as expected for a single-site
mechanism. A general mechanistic picture involving nucleophilic attack of H2O on a
high valent metal oxo has emerged.2,18,25,46 The atom–proton transfer (APT) mechanism
(Scheme 2.4A), discovered by Meyer and coworkers, leads to significant rate
enhancement by proton-accepting buffer bases.24,38,47 Phosphate could analogously act as
a proton acceptor under our conditions, but in experiments where the concentration of
phosphate was increased from 10 mM to 100 mM while maintaining pH 7 (0.5 M NaOTf
electrolyte), no current enhancement was observed (Figure 2.19 and 2.20).
M=O
OH
2M=O
OH
–V
IV
Base
anode
e–A:
Figure 2.18 CV without background correction (A) of 0.48 mM 3 (red), 0.26 mM (green), 0.18 mM 3 (blue), and 0.13 mM 3 (pink), and in the absence of catalyst (black); and plot of ic vs. concentration of catalyst (B) at 1.71 V vs.
An alternative mechanism recently postulated by Fujita, Muckerman, and
co-workers involves concerted oxidation coupled with O–O bond formation (Scheme 2B).48
A 59 mV per pH unit dependence on the catalytic onset potential was observed, assigned
to hydroxide-promoted O–O bond formation coupled to oxidation of RuIV=O to RuV=O.
Current data is inconsistent with an APT pathway (Scheme 2.4A), and may be consistent
with the pathway of Scheme 2.4B, but further studies are needed to fully elucidate the
mechanism.
A new ruthenium complex supported by the tripodal ligand
tris(2-pyridyl)phosphine oxide exhibits excellent electrocatalytic activity for water oxidation at
neutral and basic pH. The catalyst [Ru(Py3PO)(bpy)(OH2)]2+ (3) exhibits typical PCET
oxidation events to reach the Ru(IV) state, followed by a dramatic current enhancement
reflective of water oxidation with rates approaching 1000 s−1. The uncommon
pH-dependent catalytic onset allows for improved catalytic rates while maintaining a
Section 2.6 Electrokinetic Analysis
Catalytic rates were estimated by analysis of CV data. A glassy carbon working
electrode, Pt wire counter electrode, and Ag/AgCl reference electrode were utilized. The
electrolyte was 0.1 M phosphate buffer, pH adjusted using concentrated NaOH or H3PO4.
Electrocatalytic rate constants were estimated using methods developed by
Delahay & Stiehl,40 Nicholson & Shain,41 and Savéant & Vianello,42 adapted for a
multi-electron process.43,44 The catalytic response (ic) can be described by equation 2,where nc
is number of electrons (4) transferred to the electrode in the catalytic event, np is number
of electrons (1) transferred to the electrode in the oxidation in the absence of catalysis, F
is Faraday’s constant, A is the electrode area, CPº is the bulk concentration of catalyst, D
is the diffusion coefficient, kcat is the (first order or pseudo-first order) rate constant for
the chemical step after electron transfer, Eº is the potential of the oxidation that triggers
catalysis, and E is the applied potential. Note that the (Eº−E) term refers to an oxidative
process; the same term is switched for a reductive process, (E−Eº). Plotting equation 2
as a function of potential yields the familiar “S-shaped” catalytic response, with a
potential-independent plateau at applied potentials significantly positive of the oxidation
potential of the EC' process.
!! =!!!"!!
! !! !"#
!!!
!!! !"(!!!!)
(2)
Scheme 2.5 Equation Describing Catalytic Current
and rate-limiting (slow relative to electron transfer processes); and (d) electron transfer
occurs only between a molecular species and the electrode (no homogeneous electron
transfer processes, e.g. disproportionation).
The experimental data are consistent with the foregoing conditions being met
when sufficiently high scan rates are employed. Note that equation 2 does not contain a
term for scan rate: the current response should be independent of scan rate in order to
apply this equation. In accord with this requirement, the current (i) was independent of
scan rate for [Ru(Py3PO)(bpy)(OH2)]2+ (3) (Figure 2.21) and [Ru(tpy)(bpy)(OH2)]2+ (4)
(Figure 2.22) above about 250 mV·s-1. To avoid complications from increasing
background current at higher scan rates, background-subtracted data was used (the
Figure 2.21. (A) CV of 0.26 mM 3 as a function of scan rate, as indicated in the plot; (B) ic (at 1.71 V vs. NHE) vs. scan rate with 0.13 mM 3 (filled red circles), 0.18 mM 3 (empty green squares), 0.26 mM 3 (filled blue triangles), and 0.48 mM 3 (empty purple diamonds); (C) ic (at 1.56 V vs. NHE) vs. scan
400 300 200 100 0 Curre nt ( µA)
1.8 1.6 1.4 1.2 1.0 0.8 0.6
Potential (V) 25 mV/s 50 100 250 500 1000 700 600 500 400 300 200 100 0 ic ( µA) 1000 800 600 400 200 0
Scan Rate (mV/s) A B 200 150 100 50 0 ic ( µA) 1000 800 600 400 200 0

![Figure 2.7 UV-vis spectra of [Ru(κ- 3 -Py 3 PO)(bpy)OH 2 ] 2+ (3) at different pH values](https://thumb-us.123doks.com/thumbv2/123dok_us/8265886.2189737/50.918.178.729.108.519/figure-uv-vis-spectra-ru-py-different-values.webp)
![Figure 2.9 CV of [Ru(Py 3 PO)(bpy)(OH 2 )] 2+ (3) swept anodically to 1.95 V](https://thumb-us.123doks.com/thumbv2/123dok_us/8265886.2189737/52.918.242.646.612.910/figure-cv-ru-py-po-bpy-swept-anodically.webp)

![Figure 2.15 CV of 0.25 mM [Ru(Py 3 PO)(bpy)(OH 2 )] 2+ at pH 7.00 (red), 7.35 (yellow), 7.95 (green), 8.30 (teal), 9.32 (blue), and 9.77 (purple) at 100 mV·s −1](https://thumb-us.123doks.com/thumbv2/123dok_us/8265886.2189737/59.918.179.710.453.837/figure-cv-red-yellow-green-teal-blue-purple.webp)
![Figure 2.17 CV of [Ru(Py 3 PO)(bpy)(OH 2 )] 2+ (blue) and](https://thumb-us.123doks.com/thumbv2/123dok_us/8265886.2189737/61.918.205.679.118.472/figure-cv-ru-py-po-bpy-oh-blue.webp)
