An analysis of mutual fund design: the case of investing in
small-cap stocks
Donald B. Keim*
Wharton School of Business, University of Pennsylvania, Philadelphia, PA 19104, USA Received 10 October 1997; received in revised form 20 February 1998
Abstract
In 1982, Dimensional Fund Advisors launched a mutual fund intended to capture the returns of small-cap stocks. The ‘9—10 Fund’ is based on the CRSP 9—10 Index, an index of small-cap stocks constituting the ninth and tenth deciles of NYSE market capitaliza-tion, although the 9—10 Fund incorporates investment rules and a trading strategy that are aimed at minimizing the potentially excessive trade costs associated with such illiquid stocks. As a result, the 9—10 Fund provided a 2.2% annual premium over the 9—10 Index for the 1982—1995 period. We show that both the investment rules and the trade strategy components of the Fund’s design contribute significantly to this return difference.
1999 Elsevier Science S.A. All rights reserved.
JEL classification: G11; G23; D23; L14
Keywords: Transactions costs; Mutual fund design; Index fund; Small-cap stocks
1. Introduction
Indexed and passive equity mutual funds that are designed to deliver the returns and risk of a benchmark index, like the S&P 500 or the Russell 2000 Index, are increasingly popular with investors who desire low-cost exposure to particular segments of the equity (or bond) market. The traditional method of
*Corresponding author. Tel.: 215 898 7622; fax: 215 898 6200; e-mail: keim@wharton.upenn.edu. I have benefited from generous access to the portfolio managers and trade room personnel at Dimensional Fund Advisors. Thanks also to Marshall Blume, David Booth, Truman Clark, Gene Fama, Gene Fama, Jr., Ken French, Ananth Madhavan, David Musto, Jay Ritter, Rex Sinquefield, and Mitchell Petersen (the referee) for helpful comments and discussions.
0304-405X/99/$—see front matter 1999 Elsevier Science S.A. All rights reserved PII: S 0 3 0 4 - 4 0 5 X ( 9 8 ) 0 0 0 4 9 - X
designing an index fund is through duplication. Under this technique, the mutual fund holds all the stocks in the underlying index, seeking exact replication. Such a design is motivated by investors’ desire to obtain as closely as possible the returns of the underlying index, thereby minimizing tracking error, the deviation of the fund’s return from the index return. As fund inflows and outflows necessitate trade, the fund manager quickly adjusts the fund’s composition to mimic the benchmark. This desire for execu-tion immediacy is a characteristic of the duplicaexecu-tion approach to a ‘pure indexing’ strategy. Consequently, the benefits of low tracking error are not gained without the costs associated with the extra trading necessary to achieve duplication.
Transactions costs associated with the relatively liquid securities in an S&P 500 Index fund are sufficiently low and, therefore, unlikely to significantly erode the tracking ability of the fund. However, passive portfolios containing illiquid securities (e.g., small-cap funds, some value funds) face potentially large trading costs that can more than offset the gains of low tracking error, thereby resulting in significant performance shortfalls. There is increasing evidence that trade costs for illiquid stocks are large for institutional investors. For example, Keim and Madhavan (1997) report average one-way trade costs of 1.92% for a sample of institutional trades in stocks constituting the smallest 20% of size (market capitalization) on the NYSE and AMEX. It is the responsibility of passive fund managers to adopt investment rules and trading procedures that reduce these trade costs. Further, even if the rules and procedures cause the fund’s security weights to deviate from the underlying index, the procedures are, nonetheless, justified so long as the costs of reduced tracking error do not exceed the benefits of reduced trading costs. For example, Sinquefield (1991) examines the perfor-mance of four passive small-cap funds to illustrate the impact of indexing design on the investment performance of a passive fund with illiquid securities. He finds that the ‘pure index’ funds he examines have the lowest returns while the funds designed to accommodate the illiquid nature of the securities held in the portfolio have the highest returns. In an important sense, then, the design of an index fund should be endogenously linked to the market environment asso-ciated with the securities held in the fund. This idea is similar to the notion of optimal security design discussed in Allen and Gale (1988) in which the transac-tions costs of issuing securities are explicitly considered in order to determine their optimal design.
This paper examines a passive mutual fund launched by Dimensional Fund Advisors (DFA) in 1982 and designed to capture the returns and risks of small-cap stocks. The ‘9—10 Fund’ is based on the 9—10 Index published by the Center for Research in Security Prices (CRSP), an index of small-cap stocks constituting the ninth and tenth deciles of NYSE market capitalization (i.e., the smallest 20% of stocks). The 9—10 Fund is a passive portfolio, but it does not follow a pure indexing strategy. The fund pursues a strategy that sacrifices
tracking accuracy by allowing portfolio weights to deviate from the underlying index according to a trading strategy and investment rules that are designed to minimize trading costs. The investment rules exclude very illiquid, low-price stocks and maintain a sell range that extends to a region of more liquid, larger-cap stocks than are included in the target universe. The investment rules are effective in reducing trade costs but also combine to impart a large-cap ‘tilt’ to the 9—10 Fund relative to the 9—10 Index, causing a return difference that varies over time with the changing relative performance of large- and small-cap stocks. DFA’s trading strategy is a patient one in which large trades are broken into smaller pieces that are often executed over several days. DFA’s traders also participate in the upstairs market for large-block transactions, effectively play-ing the role of market maker and, thereby, supplyplay-ing liquidity to the market. In contrast to liquidity demanders who incur positive transactions costs, liquidity suppliers (market makers) enjoy ‘negative trade costs’ as compensation for the service they provide.
The investment rules and trade strategy of the 9—10 Fund combine to significantly reduce the costs of trading. The result is that over the 1982—1995 period the 9—10 Fund delivered the price behavior of small-cap stocks (the correlation between the monthly returns of the 9—10 Fund and the 9—10 Index is 0.98) while providing an annual premium of 2.2% over the 9—10 Index. How-ever, the increased tracking error associated with the strategy causes frequent discrepancies between the returns for the 9—10 Fund and the CRSP 9—10 Index: the difference in annual returns ranges from!6.98% in 1991 to 6.47% in 1990.
The average of theabsolute annual difference between the 9—10 Fund and the CRSP 9—10 Index over the 1982—1995 period is 3.78%. That the return differ-ences between the 9—10 Fund and the 9—10 Index are large is of some conse-quence from both a practical and a research standpoint. The returns for Ibbotson’s small-cap index — a small-cap benchmark used by much of the investment community and often used in academic studies—are the returns for the 9—10 Fund in the post-1981 period. The 2.2% annual difference in mean returns between the 9—10 Fund and the 9—10 Index, reflected in the Ibbotson benchmark, is particularly troublesome for studies in which conclusions are based on mean returns.
The 9—10 Fund represents an interesting example of mutual fund construc-tion, yielding insights into mutual fund design. This paper examines the aspects of the design decisions that shaped the 9—10 Fund, and analyzes the impact of these decisions on the performance of the fund over its first 14 yr. The next section describes the DFA small-cap investment rules and trade strategy that are designed to accommodate the illiquidity of the small-cap stock market. The third section describes the methods used to decompose the returns of the 9—10 Fund into the separate influences of investment rules and trading strategies. Section 4 analyzes the 9—10 Fund performance differential, and the components of the differential, over the 1982—1995 period. Section 5 investigates how the
investment rules and trade strategy affect the small-cap investment objective of the fund. Section 6 concludes the paper.
2. Fund design: investment rules and trading strategy
A number of 9—10 Fund design features contribute to the differences between the 9—10 Fund and the CRSP 9—10 Index. This section identifies these features and explains the reasons for their use. They fall into two categories. The first category concerns explicit rules and policies regarding the securities in which the fund will either invest or not invest. These rules result in an investable universe that differs substantially from the CRSP 9—10 Index. The second category concerns the trading strategy or style used by the fund managers, a style that is designed to mitigate the excessive costs of trading illiquid stocks.
2.1. Rules and policies governing the investment strategy
A number of stocks in the CRSP 9—10 universe are systematically excluded from the DFA investable universe. The CRSP 9—10 Index includes NYSE, AMEX, and Nasdaq common stocks that reside in the NYSE ninth and tenth deciles (i.e., the two smallest-cap deciles), but excludes REITs, closed-end funds, ADRs, and foreign stocks that trade on U.S. exchanges. Accordingly, DFA buys NYSE, AMEX, and Nasdaq common stocks that reside in the ninth and tenth market-cap deciles of the NYSE, but excludes REITs, closed-end funds, ADRs, and foreign stocks. DFA also excludes from the 9—10 Fund other stocks included in the 9—10 Index. The list that follows covers the major exclusions, but is not exhaustive:
(a) limited partnerships, (b) bankrupt firms,
(c) Nasdaq National Market System (NMS) stocks with fewer than four market makers,
(d) non-NMS stocks,
There are factors other than those discussed here that will cause differences between the fund and the underlying index. For example, the CRSP 9—10 Index, like most indexes, implicitly reinvests cash dividends on the ex-dividend day for the daily index and on the last day of the month in which the ex-date occurs for the monthly index. DFA, like other mutual funds, has to wait until the payment date to invest, which can be weeks after the ex date.
Although REITs, closed-end funds, ADRs, and foreign stocks are excluded from the universe, those stocks are included in the rankings used to define decile breakpoints. However, for a brief period (September 1993 to September 1994) the stocks used to compute the decile breakpoints differed for the 9—10 Fund and the CRSP 9—10 Index. During this period, CRSP excluded REITs, closed-end funds, ADRs, and foreign stocks from the rankings used to define decile breakpoints; DFA included them. This may also be a source for compositional, and return, differences.
(e) stocks with price less than $2 or market capitalization less than $10 million,
The low-price criterion (e), which excludes a large number of very small and volatile stocks, will likely affect the risk and return of the 9—10 Fund relative to the 9—10 Index. Restrictions (a)—(d) involve a relatively small number of stocks and will likely have a negligible effect on the risk and return of the fund relative to the index.
Regarding initial public offerings (IPOs), DFA’s policy is to wait six months to one year before investing in an IPO. In contrast, the CRSP 9—10 Index includes returns on IPOs starting on the first full day of trading (thereby allowing the computation of a close-to-close return). DFA’s policy is motivated in part by their desire to accumulate additional information and trading history on these issues and in part by the evidence on the long-run underperformance of IPOs (Ritter, 1991). Loughran and Ritter (1995), however, find that IPO under-performance does not begin until the seventh month after issue. While they find that IPOs underperform during the seventh through 48th month after issue, IPO performance is indistinguishable from the matching sample during the first six months after issue. Thus, by waiting one year to invest in IPOs, DFA is not avoiding the main period of underperformance.
Finally, the illiquid nature of the small-cap market makes it difficult to buy or sell large quantities of shares in short periods without paying significant price concessions. To mitigate the potential costs of selling portfolio holdings as they migrate out of the investable universe from the ninth decile to the eighth decile, DFA holds such stocks in the portfolio until they grow into the upper half of the eighth decile. This affects the portfolio in several ways. First, it permits patience when selling a stock that has grown out of the universe, and provides an added measure of liquidity since the stocks to be traded are in a larger (and more liquid) market-cap range. Second, holding stocks as they grow through the eighth decile results in a greater large-cap exposure for the DFA portfolio relative to the CRSP Index. Third, stocks that climb into the eighth decile might exhibit different performance than stocks in the ninth and tenth deciles (possibly due to momentum), and might thus contribute to the portfolio’s performance differential. Finally, use of the hold range eliminates the unnecessary buying and selling of stocks that migrate back and forth between the eighth and ninth deciles over short time intervals.
2.2. The trade strategy and its impact on trade costs
Although the investment style of the 9—10 Fund is passive in the sense that information does not motivate trade, the fund is not an index portfolio in the traditional sense. Indeed, the portfolio managers have discretion in their trading strategy that creates discrepancies between the fund and the index beyond the influence of the rules outlined in Section 2.1.
DFA follows a two-tiered approach when buying small-cap stocks. At one level, DFA is the initiator of trade programs in these stocks. Rather than issuing the programs with market orders, however, DFA employs working orders, instructing brokers to work the order and trade patiently. The brokers are given limited discretion in executing these orders, often breaking them into smaller pieces spread over several days in an attempt to trade inside the spread, buying close to the bid price. These efforts are aided by the fact that DFA’s investment strategy employs no special information, a feature that can be advertised during the trading process. At the second level, DFA participates in the ‘upstairs market’ for large-block transactions, effectively playing the role of market maker by standing ready to take the opposite side of seller-initiated block trades for stocks that are on DFA’s buy list. By participating in the price negotiation process for these block buys, DFA is able to buy large positions in small-cap stocks at a discount to the then-prevailing bid price (see Keim and Madhavan, 1996).
DFA’s trading strategy is quite valuable in the illiquid markets in which it operates. Indeed, DFA is acting as a supplier of liquidity and, as such, should enjoy reduced trading costs. Table 1 illustrates the impact that the trade strat-egy has on realized trade costs. The table reports annual values of assets, net cash flows, trade activity, and trade costs for the 9—10 Fund and 9—10 Trust for the 1982—1995 time period (the 9—10 Trust is a commingled trust initiated in 1986 by DFA using the same set of rules and trade procedures as the 9—10 Fund). The price impact component of the trade cost is measured as
c"(P
R>/P !1)!R
KR>, wherePR>is the closing price of the stock on
the day after the last trade date of the transaction (which can span several days and trades),P is the volume-weighted average trade price, andR
KR>is the
return on the Russell 2000 Index on the day after the trade. The total cost associated with an individual trade istc"!c#commission(cis multiplied by
negative one so that the price movement associated with the trade reflects a cost). The average annual values fortcreported in Table 1 are weighted by the dollar volumes of the individual transactions. There is a clear difference in the magnitude of trade costs when comparing the early ‘growing/learning’ years of the fund and the later ‘mature’ period. Specifically, before 1987 most trades were completed in more traditional (brokerage) fashion because it was not possible to integrate large block positions into the (then) small asset base without substan-tially distorting the portfolio weights. As a result, average trade costs in the early period were positive (0.75%). After 1986, typically more than half of the total trade volume in each year was completed using block trades, resulting in negative average trade costs (!2.13%). As a result, in the later years DFA’s
trading costs are significantly lower than the average small-cap trade costs reported for samples of other institutional money managers (see Keim and Madhavan (1997)). Thus, when we analyze the performance differential between the 9—10 Fund and the CRSP 9—10 Index in the following sections, we report
Tab le 1 As set s, n et ca sh fl o w s, tr a d ing ac ti vi ty an d tr a d e co st s fo r b o th th e D FA 9 — 10 F u n d a n d D FA 9 — 10 T ru st (19 8 2 — 19 95). B eg in n in g-o f-y ea r N et ca sh fl o ws B u y transac ti on s o nl y A nn u a l ret u rn s a sse ts u n der d uri n g th e yea r ma n a g eme n t ( $ Mi ll ) T o tal tr a d es Bl oc k tr a d es / To ta l tr a d e DF A 9 — 10 C R S P 9 — 10 ( $ Mi ll ) ( $ Mi ll ) to ta l tr a d es (%) co st (% ) fu n d ind ex 19 82 5 .9 1 9 3 .0 — 0 1 .00 28. 01 24 .26 19 83 234 .5 40 8.5 501 0 0 .61 39. 67 33 .78 19 84 758 .2 51 4.6 549 0 0 .67 ! 6. 67 ! 11 .58 19 85 1 218 .8 34 2.2 356 10 — 15 0 .81 24. 66 26 .16 19 86 1 768 .8 8 6 .1 406 21 0 .68 6. 85 3 .45 19 87 1 927 .3 ! 11 6.7 476 42 ! 0. 2 1 ! 9. 30 ! 14 .16 19 88 1 641 .6 ! 2 6 .7 425 65 ! 1 .14 22. 87 19 .92 19 89 1 994 .9 ! 21 1.4 230 84 ! 1 .26 10. 19 8 .22 19 90 1 997 .5 ! 29 2.1 124 70 ! 2. 0 1 ! 21. 56 ! 28 .03 19 91 1 302 .9 ! 23 3.9 138 62 ! 1 .85 44. 63 51 .61 19 92 1 605 .2 ! 5 9 .5 266 81 ! 2 .92 23. 35 26 .03 19 93 1 762 .1 ! 9 1 .7 230 98 ! 3 .32 20. 98 19 .86 19 94 1 943 .0 ! 4 9 .4 310 92 ! 3 .67 3. 11 ! 3. 9 3 19 95 1 949 .6 6 1 .2 547 75 ! 2 .76 34. 46 33 .32
results separately for the 1982—1986 and 1987—1995 subperiods to highlight the important differences in these two distinct phases in the life of the fund.
An important outcome of DFA’s trading stategy is that the security weights in the 9—10 Fund are substantially different from those in the 9—10 Index. In particular, the heavy reliance on block trades tends to distort the weightings in the 9—10 Fund. For example, the 9—10 Fund had a 24.9% weighting in techno-logy stocks in 1994, compared to 15.1% for the 9—10 Index. Such weighting differences can result in substantial return differences that can vary through time. We show below that such ‘active’ management of the portfolio is an important contributor to the observed return difference.
3. Research methods: decomposing the return difference
Although the 9—10 Fund design ensures tracking error relative to the CRSP 9—10 Index, the objective is to increase the level of efficiency (through lower trade costs) in order to offset the implicit costs associated with the lower tracking accuracy. The return difference is the sum of two components: the investment rules discussed in Section 2.1 and the trading strategies discussed in Section 2.2. That is, the 9—10 Fund return, hereafter¸I»E910, deviates from the
CRSP index, hereafterCRSP910, in part because of the marginal contribution of the investment rules and in part because of the marginal contribution of the trading strategy:
¸I»E910!CRSP910"Rules Contribution
#¹rade Strategy Contribution.
To measure these components, I first construct a simulated 9—10 portfolio,
SIM910, that mechanically reproduces DFA’s investment rules and policies. As such,SIM910is the passive benchmark portfolio that captures DFA’s invest-ment strategy. The difference in return between¸I»E910andSIM910,
there-fore, measures the component of the total return difference that represents the value added by the trade strategy. Correspondingly, the difference in return between SIM910 and CRSP910 measures the magnitude of the effect of the investment rules on the total return difference. This measures the extent to which the 9—10 Fund’s benchmark (i.e.,SIM910) deviates from the index that captures the broader small-cap universe. Finally, to avoid potential idiosyncra-sies in CRSP910, I also construct my own replicated CRSP 9—10 Index,
KEIM910.Use ofKEIM910eliminates from the analysis of DFA’s investment
A natural starting point for the construction of DFA’s benchmark,SIM910, is to simulate the underlying universe of stocks that are reflected in the 9—10 Index. Although I obtained the precise instructions CRSP uses to construct the 9—10 Index, I was unable to exactly reproduce it from the CRSP individual stock data.
rules any idiosyncrasies associated with the construction of CRSP910 and permits quantification of those idiosyncrasies.
In summary, using the simulated and actual series, I decompose the total return difference into the following three parts:
¹rading Contribution"¸I»E910!SIM910,
Rules Contribution"SIM910!KEIM910,
Index Discrepancy"KEIM910!CRSP910.
3.1. Construction of the simulated portfolios
I compute monthly returns for SIM910 and KEIM910for the 1982—1995 period. The simulated portfolios contain NYSE, AMEX, and Nasdaq stocks. Data for NYSE and AMEX stocks are from the CRSP monthly stock files, and the data for Nasdaq stocks are from the CRSP daily stock files. Because the analysis in Section 4 uses monthly returns, the Nasdaq daily stock returns are compounded to monthly returns. All common stocks are included except ADRs, foreign stocks, investment companies, and REITs. Transactions costs are as-sumed to be zero inSIM910,KEIM910, andCRSP910; the DFA 9—10 Fund returns,¸I»E910, are net of fees, which average five basis points per month over
the period. Where relevant, results computed with¸I»E910are reported with
the fees added back in. Following are details regarding the composition of the CRSP 9—10 Index and the construction of the two simulated series.
CRSP910: This is the value-weighted small-cap index published by CRSP. The list of stocks included in the index, which is updated quarterly, contains NYSE, AMEX, and Nasdaq stocks that are in the ninth and tenth deciles of market capitalization. The decile breakpoints are updated quarterly and com-puted by CRSP. Before September 1993, the decile breakpoints that define
CRSP910 are based on rankings of all NYSE stocks. After September 1993, REITs, closed-end funds, ADRs, and foreign stocks are excluded from the NYSE stocks used in the rankings. The portfolio holdings are maintained through the subsequent quarter except for stocks that are delisted and, therefore, exit the index.
KEIM910: This portfolio is intended to replicate CRSP910. It is a value-weighted portfolio containing common stocks in the ninth and tenth deciles of market capitalization. The decile breakpoints that determine the holdings in the portfolio are updated quarterly and determined as described above for
CRSP910. Like CRSP910, the portfolio holdings are maintained through the subsequent quarter except for stocks that are delisted and exit the portfolio.
SIM910: This is a value-weighted portfolio designed to simulate the DFA 9—10 investment strategy (i.e., the rules and policies). As such, it is a benchmark portfolio that can be used for traditional performance evaluation. The same
quarterly decile breakpoints described above are used to construct this port-folio. Unlike the indexes, as the market capitalizations of companies change, stocks migrate into or out ofSIM910on a month-by-month basis as permitted by DFA’s investment rules.SIM910is designed to capture the DFA investment rules that are likely to cause the largest deviations in portfolio holdings when compared to the 9—10 Index, as follows:
1. An eighth-decile hold range, whereby the simulated portfolio contains the stocks in the ninth and tenth deciles as determined by the quarterly sort updates, plus those stocks that had previously been members of the ninth and tenth deciles but migrate to the eighth decile. Stocks that exit the eighth decile into the seventh decile are ‘sold’ and do not reenter the portfolio unless their market capitalization drops below the ninth decile breakpoint. (This differs from DFA’s current policy of holding stocks only in the lower half of the eighth decile as discussed in Section 2.1 above, but it is consistent with DFA’s policy over most of the period for the analysis reported here.) Note that eighth decile stocks that arrived in that decile from the seventh decile are not included in the portfolio.
2. IPOs are included in the portfolio only after they accumulate one year of trading history.
3. At the beginning of each month when the portfolio composition for the upcoming month is determined, stocks with prices less than $2 or market capitalization less than$10 million are excluded. Thus, the simulated port-folio never includes stocks that fall below the price and market-cap filters at the beginning of the month.
4. AMEX stocks are excluded from the simulated portfolio prior to June 1983, and Nasdaq stocks are excluded prior to June 1985, coinciding with DFA’s entry into these markets.
3.2. SIM910vs.KEIM910:how the investment rules affect the910 fund holdings
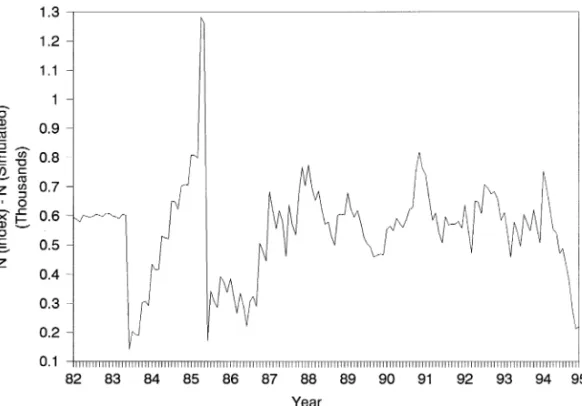
As expected, the rules associated with DFA’s 9—10 investment strategy result in a simulated portfolio with holdings that are very different from the 9—10 Index.SIM910contains fewer stocks thanKEIM910, although the difference varies over time (Fig. 1). The difference ranges from a low of 150 in May 1983 to a high of almost 1300 in May 1985. The sawtooth pattern at the beginning of the period results from the introduction of AMEX stocks in the simulated portfolio in June 1983. Prior to that time, the approximate 600-security discrepancy results from the exclusion of AMEX stocks in the simulated series. The escala-tion in the discrepancy from July 1983 to May 1985 reflects the increasing number of Nasdaq stocks that were being added to the National Market System and, therefore, included inKEIM910but excluded fromSIM910. After 1986,
Fig. 1. Difference in the number of stocks contained in the CRSP 9—10 Index and the simulated 9—10 portfolio.
The figure plots the number of stocks contained in the 9—10 Index (KEIM910) minus the number of stocks in the simulated 9—10 portfolio (SIM910) that captures DFA’s investment rules.KEIM910 includes NYSE, AMEX, and Nasdaq stocks over the entire period.SIM910 includes NYSE stocks over the entire period, plus AMEX stocks after May 1983, and Nasdaq stocks after May 1985 according to DFA’s investment policies.
primarily the low-price/low-market-cap stocks that reside in the ninth and tenth deciles but are excluded fromSIM910.
4. Decomposition of the return difference
Table 2 reports summary statistics for the 1982—1995 period for the 9—10 return difference (¸I»E910!CRSP910) and its components: (1) ¸I»E910!
SIM910, which measures the trade strategy component; (2) SIM910!
KEIM910, which measures the influence of DFA investment rules and policies; and (3)KEIM910!CRSP910, which captures index-related discrepancies that
are not related to DFA’s trading or investment policies. The table reports mean monthly values and corresponding¹-statistics for the entire 1982—1995 period
Table 2
Decomposition of the return differential between the DFA 9—10 Fund and CRSP 9—10 Index. The table presents average values and year-by-year variation in the monthly components of the difference in performance between the DFA 9—10 Fund and the CRSP 9—10 Index (in percent). The components of the total performance differential are defined as¹rading"¸I»E910!SIM910,
Rules"SIM910!KEIM910,Index"KEIM910!CRSP910, where¸I»E910is the 9—10 Fund return, SIM910is the simulated passive benchmark portfolio that captures the investment strategy of the 9—10 Fund,CRSP910 is the CRSP 9—10 Index, andKEIM910 is a replication of the CRSP 9—10 Index. The subcomponents of the rules component measure the separate contributions of investment rules that (1) prohibit investment in IPOs for one year (IPO), (2) provide for an eighth-decile hold range (Hold Range), and (3) prohibit investment in stocks with price less than$2 and market capitalization less than$10 million. The time period is January 1982 to December 1995.
Total Components of total Components of rules
Index Trading Rules IPO Hold range Low price
1982—1995 0.24 0.04 0.05 0.15 0.02 0.11 0.02 (3.02) (1.07) (0.95) (2.40) (0.92) (2.24) (1.20) 1982 0.22 0.46 !0.63 0.39 0.07 0.33 !0.01 (0.59) (1.82) (!2.86) (1.24) (1.49) (1.13) (!0.41) 1983 0.33 0.06 !0.07 0.34 0.14 0.19 0.01 (0.71) (0.28) (!0.46) (1.10) (3.43) (0.66) (0.56) 1984 0.46 0.01 !0.35 0.80 0.05 0.73 0.03 (2.13) (0.04) (!2.27) (4.27) (1.42) (4.77) (1.17) 1985 !0.12 0.14 !0.11 !0.14 !0.00 !0.20 0.06 (!0.37) (0.68) (!1.36) (!0.42) (!0.09) (!0.72) (1.46) 1986 0.26 0.06 0.14 0.07 !0.00 0.06 0.01 (0.79) (0.58) (0.73) (0.70) (!0.04) (1.00) (0.47) 1987 0.48 0.05 0.28 0.15 !0.01 0.16 !0.00 (1.52) (0.48) (1.48) (0.79) (!0.06) (1.00) (!0.07) 1988 0.21 0.11 !0.03 0.13 !0.03 0.09 0.07 (0.79) (1.59) (!0.18) (0.92) (!0.95) (0.87) (1.28) 1989 0.15 0.09 !0.19 0.25 !0.04 0.20 0.08 (0.74) (1.40) (!0.96) (2.97) (!1.78) (3.10) (2.59) 1990 0.72 0.19 0.08 0.45 !0.05 0.31 0.19 (2.93) (2.20) (0.36) (2.47) (!0.99) (2.50) (2.39) 1991 !0.43 !0.22 !0.11 !0.10 !0.04 0.05 !0.02 (!1.05) (!2.13) (!0.67) (!0.31) (!0.47) (0.22) (!0.11) 1992 !0.21 !0.02 0.14 !0.33 0.08 !0.31 !0.11 (!0.79) (!0.09) (0.50) (!1.08) (0.62) (!1.67) (!0.78) 1993 0.07 0.06 0.04 !0.02 0.04 !0.00 !0.06 (0.41) (0.39) (0.25) (!0.27) (0.55) (!0.05) (!1.60) 1994 0.45 !0.19 0.61 0.03 0.06 !0.05 0.01 (1.92) (!1.40) (3.12) (0.27) (1.62) (!0.49) (0.51) 1995 0.07 !0.16 0.20 0.02 !0.06 0.08 0.00 (0.46) (!1.14) (1.14) (0.16) (!1.37) (0.73) (0.07)
total return difference, gross of fees, is 24 basis points per month (¹"3.02). Of
this 24 basis points, 15 basis points (62.5%) are due to the investment rules
(¹"2.40). Thus, DFA’s policy to exclude micro-cap stocks and newly issued
IPOs and maintain an eighth-decile hold range results in a larger average return than that of the CRSP 9—10 Index over the 1982—1995 period, and the difference is significant. In addition, four basis points of the total return difference are due to idiosyncrasies associated with the construction of CRSP’s 9—10 Index, but this is insignificant.
Finally, the portion of the return difference that results from DFA’s trading is, on average, five basis points per month (¹"0.95), again reported gross of fees.
This difference (¸I»E910!SIM910) can be thought of as the 9—10 Fund’s
‘alpha’, although the source of this alpha is not stock selection ability (the 9—10 Fund is passive from an information perspective). The alpha here arises from the ‘active’ approach to trading employed by DFA in the zero-sum game of trading, and is inversely related to trade costs. A regression of the trade stategy compon-ent on trade costs yields a slope coefficicompon-ent of !0.107 (¹"!2.71) and an
adjusted R of 0.38. Although statistically insignificant, this five-basis-point alpha is nonetheless interesting because it indicates that, even though operating in illiquid markets where trading costs are large (for liquidity demanders), the trading strategy is not reducing fund value. In contrast, Keim and Madhavan (1997) report an average reduction in value of 1.92% associated with the one-way trade costs of comparable NYSE and AMEX small-stock trades for a sample of institutional money managers. Interestingly, the trading strategy component is negatively correlated with the investment rules component over the entire 1982—1995 period (r"!0.18).
Table 2 further decomposes the rules contribution (SIM910!KEIM910)
into its subcomponents associated with the three main investment rules used to construct the benchmark that simulates the investment strategy. To measure the incremental contribution of each separate rule, I begin with the replicated 9—10 Index (KEIM910) and successively add constraints associated with each of the three rules to create a set of intermediate portfolios that reflect respective subsets of the rules. Specifically, I first add the low-price, low-market-cap restriction to
Interestingly, during the month of January, the 9—10 Fund significantly underperforms the CRSP 9—10 Index by 1.26% (¹"!3.38). This underperformance is primarily attributable to the significant negative value of!1.03% (¹"3.16) for the rules component during January, caused by the increased exposure of the 9—10 Fund to large-cap stocks because of the eighth-decile hold range and the exclusion of micro-cap stocks. In addition, because large-cap stocks outperformed small-cap stocks over the 1982—1995 period, the large-cap tilt results in a positive rules component for the remainder of the year that is often significant. Correspondingly, outside of January, the 9—10 Fund outperformed the 9—10 Index over the sample period. In contrast, the trading contribution displays no apparent pattern within the year and is generally insignificant on a month-by-month basis, except for the month of July. See Booth and Keim (1998) for a more complete discussion of these issues.
simulate the policy of excluding those stocks, and measure the incremental impact of this rule as the difference between the return on this portfolio, call it
¸O¼PR, and the return onKEIM910. I then revise¸O¼PRto exclude IPOs
for the first year of their existence and measure the marginal impact of the IPO rule as the difference in return between this portfolio, call it¸O¼PR#IPO, and ¸O¼PR. Finally, to measure the marginal impact of the eighth-decile hold
range, I compute the difference in return betweenSIM910and¸O¼PR#IPO.
Means and¹-statistics for these three components are reported in the three
rightmost columns of Table 2. For the overall time period (top row), the eighth-decile hold range contributes the most to the rules component of the
¸I»E910!CRSP910differential with an average monthly value of 11 basis
points (¹"2.24), representing 73.3% of the total rules contribution. The
micro-cap restriction contributes an average of two basis points per month (13.3%) to the overall rules component (¹"1.20). The hold range and micro-cap
restric-tion, which both tend to impart a large-cap tilt to the 9—10 Fund relative to the 9—10 Index, are highly correlated over the period of analysis with a correlation coefficient of 0.53. Finally, the IPO restriction contributes two basis points per month (¹"0.92) to the rules component of the return difference, and it is
uncorrelated with the other two rules components over the 1982—1995 period.
4.1. Subperiod analysis of the decomposition
The year-by-year variation in the investment rules and trade strategy compo-nents of the return difference reported in Table 2, and displayed graphically in Fig. 2, reveal some interesting patterns. First, the investment rules component contributes positively to the return difference in most years in the period 1982 to 1990, but has a negative influence in many of the years after 1990. Due to the large-cap tilt that the investment rules impart to the 9—10 Fund relative to the 9—10 Index, these rules add value in the earlier period (1982—1990) when large-cap stocks outperformed small-cap stocks, and diminish value in 1991—1995 when small-cap stocks outperformed large-cap stocks. The year-by-year breakdown of the eighth-decile hold range and low-price exclusion, the two sources of this large-cap tilt, exhibit these same patterns in the two subperiods.
The trading contribution also varies considerably over time. For example, it significantly affects the 9—10 Fund performance by contributing negatively in the early years of the fund, before the full implementation of the block-trading strategy. In contrast, for the 1987—1995 period, the average (gross of fees) trade contribution is a significant 0.17% per month (¹"2.30). Finally, there is no
obvious pattern in the component of the return difference related to index construction.
To summarize this variation over time, Table 3 reports summary statistics for the decomposition of the return difference separately for 1982—1986 and
Fig. 2. The investment rules and trade strategy components of the return difference between the DFA 9—10 Fund and the CRSP 9—10 Index.
The figure plots the annual values of the investment rules component (SIM910!KEIM910) and the trade strategy component (¸I»E910!SIM910) of the difference in return between DFA’s 9—10 Fund and the CRSP 9—10 Index.¸I»E910is the return on the DFA 9—10 Fund,SIM910is the return on a simulated passive benchmark portfolio that captures DFA’s investment strategy, and
KEIM910is the return on a replicated CRSP 9—10 Index.
1987—1995. These subperiods represent the growing/learning and mature phases of the fund, respectively (see Table 1 and the accompanying discussion in Section 2.2). Although the return difference gross of fees is similar in the two subperiods (0.28% in 1982—1986 and 0.22% in 1987—1995), it is significant only in the 1987—1995 period (¹"2.41). However, the decomposition of the total
return difference varies significantly across the two subperiods. In the first subperiod, the return difference is dominated by the investment rules (29 basis points,¹"2.39), which in turn are influenced most by the eighth-decile sell
range (22 basis points, ¹"2.03) and the IPO exclusion (five basis points,
¹"2.36). Indeed, during this growing/learning period, the trade strategy (gross
of fees) contributed negatively to the return difference (!16 basis points,
¹"!1.95) reflecting the higher average costs associated with the greater
reliance on traditional trades (predominantly working orders). Index idiosyn-crasies, although contributing 15 basis points to the return difference, are insignificant (¹"1.57) in the early subperiod.
Tab le 3 S u mm ar y st a ti st ic s for th e com po n ent s o f th e di ff ere n ce in p er fo rm a n ce b et w ee n th e D F A 9 — 10 Fun d and the C R SP 9 — 1 0 In de x fo r tw o su b pe ri od s d u rin g the 1 982 — 19 95 p er io d . M o n thl y re tu rns (% ) C or re la tio n s w it h Mean ¹ -s ta ti st ic Tr a d in g R ule s 8 th-d ec il e IP O L o w pr ic e/ ho ld ra n g e m arket ca p 19 82 — 198 6 ( n " 60 ) Per fo rm a nce d iff eren tia l 0. 2 8 1. 8 4 In d ex idi o syn crasies 0 .15 1 .57 ! 0. 2 9 0. 0 9 0. 0 3 0. 0 2 0. 2 0 Tr ad in g co n tr ib u ti o n ! 0. 1 6 ! 1. 9 5 ! 0. 1 8 ! 0. 1 4 ! 0. 1 4 ! 0. 0 9 Ru le s co n tr ib u ti o n 0 .29 2 .39 8th -dec il e h o ld ra n g e 0 .22 2 .03 0 .34 0 .38 O n e-ye ar wait on IP O s 0 .05 2 .36 0 .20 L o w p rice /m arket cap re st ri ct io n 0 .02 1 .73 19 87 — 199 5 ( n " 10 8) Per fo rm a nce d iff eren tia l 0. 2 2 2. 4 1 In d ex idio syn cras ies ! 0. 0 1 ! 0. 2 5 ! 0. 1 0 ! 0. 1 3 ! 0. 0 7 ! 0. 3 4 ! 0. 0 5 Tr ad in g co n tr ib u ti o n 0. 1 7 2. 3 0 ! 0. 1 1 ! 0. 1 6 0. 0 4 0. 1 8 Ru le s co n tr ib u ti o n 0 .06 0 .99 8th -dec il e h o ld ra n g e 0 .05 1 .05 ! 0. 3 6 0. 7 6 O n e-ye ar wait on IP O s ! 0. 0 0 ! 0. 1 6 ! 0. 2 0 L o w p rice /m arket cap re st ri ct io n 0 .02 0 .75 V a lu es are rep or te d g ro ss o f fe es.
In the 1987—1995 period the story is entirely different. The 22-basis-point return difference is most heavily influenced by the trade strategy contribution of 17 basis points (¹"2.30), a reflection of the increased use of lower-cost block
trades during this period. The investment rules, which generally benefit the fund when large-cap stocks outperform small-cap stocks, contribute an insignificant six basis points to the return difference (¹"0.99) during the 1987—1995 period
when, on average, the size effect was flat. Also, the IPO exclusion is insignificant over this subperiod. Finally, the index component is !1 basis point and
insignificant during this subperiod (¹"!0.25).
5. Is the 9–10 fund delivering small-cap price behavior?
An important question concerns the extent to which the investment rules and trading strategy impair the ability of the 9—10 Fund to deliver its investment objective, to wit, the price behavior of the small-cap stock universe. The degree to which the investment rules and trading strategy, designed to lower trade costs, tilt the portfolio away from this small-cap objective is critical to the success of the investment strategy. To address these issues, I estimate the following model, which measures the exposure of the components of the return difference to the market and two broad dimensions of investment style, small cap vs. large cap and value vs. growth:
½ R"b #b XMK¹ R#b SmBR#b Hm¸ R#e R (1)
where for montht,½
Ris the return associated with a specific component of the
total return difference,XMK¹
R is the market return in excess of the risk-free
rate, SmBR is the difference in return between portfolios of small-cap and large-cap stocks (holding constant the influence of value vs. growth), andHm¸
R
is the difference in return between portfolios of value and growth stocks (holding constant the influence of market capitalization).A positive (negative) coefficient onSmB indicates that the individual component increases, at the margin, the 9—10 Fund’s exposure to small-cap (large-cap) stocks relative to the 9—10 Index. Similarly, a positive (negative) coefficient onHm¸indicates that the component
increases, at the margin, the 9—10 Fund’s exposure to value (growth) stocks. Finally, a positive (negative) coefficient onXMK¹indicates that the component
increases (decreases), at the margin, the 9—10 Fund’s exposure to the market. Table 4 reports estimates of the coefficients from Eq. (1) for the entire 1982—1995 period. The model is estimated separately for both the trade strategy and the investment rules contributions to the total return difference, and for each of the three components of the rules contribution.¹-values, in parentheses,
The three independent variables in Eq. (1) are those used in Fama and French (1993). I thank them for generously providing the series.
Tab le 4 A n a ly sis o f th e d ec om po si ti o n o f th e D FA 9 — 1 0 F u nd pe rf o rm a n ce d iff er en ti a l. Th e tab le p res en ts , for th e p eri o d Ja n uar y 19 82 to D ecem ber 199 5, the es tima te d coeffi cient s of th e fol lowi ng re gr ess io n m o d el: ½ R " b # b XMK ¹ R # b SmB R # b Hm ¸ R # e R wh ere , fo r m ont h t , ½ R is defin ed b el o w, XMK ¹ R is th e m a rk et ret ur n in ex ce ss o f the risk-free ra te, SmB R is th e d iff er enc e in ret u rn b et w ee n p o rt fol ios o f sm al l-ca p a n d la rg e-ca p st o ck s (ho ldi n g con st an t th e in flu en ce o f va lu e a nd g row th eff ec ts ), an d Hm ¸ R is th e d iff er en ce in re tu rn b etw ee n p o rt fo lio s o f v a lu e and g ro w th st o cks (ho ldi n g co n st ant th e in fl u ence of m a rk et ca p it a li zat io n ). XMK ¹ R , Sm B R ,a n d Hm ¸ R a re fro m F am a a n d F rench (1 993 ). ¹ -va lu es, in pa ren th es es, a re b as ed on he te ro sk ed a st ici ty -c o n sist en t st a nda rd err or s ( n " 168 ). ½ In te rc ep t XM K ¹ SmB H m ¸ Ad j. R Per fo rma n ce d iff er en tia l 0. 001 7 (2.37 ) ! 0 .01 77 ( ! 0.71 ) ! 0 .07 54 ( ! 2.19 ) ! 0 .05 64 ( ! 1.63 ) 0 .0 3 In d ex id io sy n cras ies 0 .000 2 (0.51 ) 0 .02 0 4 (1.62 ) ! 0 .07 60 ( ! 4.39 ) 0 .01 7 1 (0.87 ) 0 .1 1 Tr adi n g co m p o n en t 0. 000 1 (0.15 ) 0 .00 8 1 (0.56 ) 0 .06 3 9 (2.66 ) ! 0 .03 15 ( ! 1.28 ) 0 .0 7 R u les co m p o n en t 0. 001 7 (2.93 ) ! 0 .02 58 ( ! 1.27 ) ! 0 .13 94 ( ! 3.94 ) ! 0 .02 49 ( ! 0.76 ) 0 .1 8 8th -dec il e h o ld ra n g e 0 .001 2 (2.45 ) ! 0 .00 60 ( ! 0.39 ) ! 0 .08 72 ( ! 3.24 ) ! 0 .02 23 ( ! 0.83 ) 0 .0 9 IPO ex clu si on 0. 000 1 (0.70 ) ! 0 .01 02 ( ! 2.68 ) ! 0 .00 60 ( ! 0.90 ) 0 .03 9 0 (5.45 ) 0 .3 2 Lo w p ri ce /s iz e exc l. 0. 000 4 (2.72 ) ! 0 .00 96 ( ! 1.76 ) ! 0 .04 63 ( ! 3.52 ) ! 0 .04 17 ( ! 4.17 ) 0 .3 0
are based on heteroskedasticity-consistent standard errors. Turning first to the total return difference, the estimated coefficients onSmBandHm¸are negative
and significant, indicating that the investment rules and trading strategy, in combination, impart a large-cap, growth tilt to the 9—10 Fund relative to the 9—10 Index. In contrast, the coefficient on XMK¹is insignificantly different
from zero, indicating that the investment rules and trading strategy do not affect the market exposure of the 9—10 Fund relative to the 9—10 Index.
For the trading strategy component, the coefficient estimates forXMK¹and
Hm¸ are statistically indistinguishable from zero. However, the coefficient
estimate onSmB is positive and statistically significant (¹"2.32), indicating
that the trading strategy tends to increase the small-cap exposure of the 9—10 Fund relative to the 9—10 Index. This is possibly due to the extensive block-trading activity of the portfolio managers, which tends to overweight the smaller-cap and lower-price stocks in the portfolio. For example, the average price of the stocks that were traded as blocks during the sample period was$0.83 (9.1%) lower than the average price of the stocks that were traded using working orders.
The investment rules component tends to increase the large-cap exposure of the 9—10 Fund, with the estimated coefficient onSmBnegative and significant
(¹"!4.02). The coefficient onHm¸is also negative, but insignificant. These
negative coefficients for the rules components are due, in turn, to negative coefficients onSmBand Hm¸for both the low-price stock exclusion and the
eighth-decile hold range. Thus, this large-cap and (slight) growth tilt is caused by (1) excluding the lowest-price and lowest-cap stocks, which tend to have the largest positive exposures to size and value, and (2) the addition of larger-cap stocks (via the eighth-decile hold range) that, by virtue of their growing into the eighth decile, are possibly also displaying growth tendencies. Finally, the IPO exclusion policy tends to increase the value exposure of the 9—10 Fund: while the estimated coefficient on SmB is negative and insignificant, the coefficient on
Hm¸is positive and statistically significant (¹"4.93) for the IPO component.
Because IPOs tend to be small-cap and growth-oriented stocks, excluding them when they are initially issued will tend to impart a value tilt to the 9—10 Fund relative to the 9—10 Index. However, in aggregate this is offset by the growth tilt caused by the other investment rules.
Table 5 reports the estimates of Eq. (1) separately for the 1982—1986 and 1987—1995 subperiods. From Table 5 it is apparent that the large-cap tilt evident in the estimates for the overall period is due primarily to the first subperiod in which theSmB coefficient for the investment rules component is negative and significant (¹"!2.63). Although in the 1987—1995 period the
rules and index components have significant negative SmB coefficients, the large-cap tilt induced by these two components is offset by the small-cap tilt provided by the trade strategy (¹"3.61) during that subperiod. On the other
Tab le 5 Su b p er io d a nal y si s o f the dec o m p o si tio n o f th e D F A 9 — 1 0 F u n d pe rf o rm a nce d iff ere n ti al . Th e tab le p res en ts , fo r tw o su b pe ri o d s d u rin g Janu a ry 19 82 to D ecemb er 1 995 , th e es ti m a te d coe ffi cien ts o f th e fo ll o w in g reg re ss io n m o d el : ½ R " b # b XMK ¹ R # b SmB R # b Hm ¸ R # e R wh ere , fo r m ont h t , ½ R is defin ed b el o w, XMK ¹ R is th e m a rk et ret ur n in ex ce ss o f the risk-free ra te, SmB R is th e d iff er enc e in ret u rn b et w ee n p o rt fol ios o f sm al l-ca p a n d la rg e-ca p st o ck s (ho ldi n g con st an t th e in flu en ce o f va lu e a nd g row th eff ec ts ), an d Hm ¸ R is th e d iff er en ce in re tu rn b etw ee n p o rt fo lio s o f v a lu e and g ro w th st o cks (ho ld in g co n st a n t the in flu en ce of m a rk et ca p it a liza ti on ). XM K ¹ R , SmB R ,a n d Hm ¸ R a re fr o m F am a a nd Fren ch (1 993 ). ¹ -va lu es, in pa ren th es es, a re b as ed on he te ro sk ed a st ici ty -c o n sist en t st a nda rd err or . ½ In te rc ep t XM K ¹ SmB H m ¸ Ad j. R 19 82 — 198 6 ( n " 60 ) Per fo rma n ce d iff er en tia l 0 .00 16 (1.2 7) ! 0 .08 12 ( ! 2.72 ) ! 0 .16 07 ( ! 2.44 ) 0 .00 4 0 (0.07 ) 0 .18 In d ex id ios ync ra sie s 0 .0 00 7 (0 .81 ) 0 .0 69 3 (2 .6 3 ) ! 0 .03 31 ( ! 0.71 ) 0 .02 3 9 (0.53 ) 0 .10 T ra d in g com po n en t ! 0 .00 14 ( ! 1.7 8 ) ! 0 .01 25 ( ! 0.43 ) ! 0 .00 23 ( ! 0.05 ) ! 0 .06 31 ( ! 1.77 ) ! 0. 0 0 Ru le s com po n ent 0. 0 0 3 1 (2 .9 6 ) ! 0 .06 87 ( ! 2.65 ) ! 0 .15 84 ( ! 2.63 ) 0 .06 7 0 (1.45 ) 0 .36 8 th-d ec il e ho ld ra n g e 0 .0 0 2 3 (2 .3 9 ) ! 0 .05 29 ( ! 2.07 ) ! 0 .13 99 ( ! 2.47 ) 0 .05 3 7 (1.34 ) 0 .31 IPO ex clu si on 0 .00 04 (2.1 0) ! 0 .00 91 ( ! 1.66 ) 0 .00 8 4 (1.01 ) 0 .02 6 5 (2.54 ) 0 .29 Lo w p ri ce /s iz e exc l. 0 .00 04 (3.1 8) ! 0 .00 67 ( ! 2.28 ) ! 0 .02 69 ( ! 5.39 ) ! 0 .01 31 ( ! 2.38 ) 0 .20 19 87 — 199 5 ( n " 1 08) Per fo rma n ce d iff er en tia l 0 .00 18 (2.4 3) 0 .00 93 (0.34 ) ! 0 .04 62 ( ! 1.38 ) ! 0 .13 39 ( ! 3.74 ) 0 .12 In de x idi o sy n cr a si es ! 0 .00 02 ( ! 0.5 6 ) ! 0 .00 31 ( ! 0.24 ) ! 0 .08 63 ( ! 5.71 ) 0 .02 6 9 (1.56 ) 0 .29 Tr adi n g co m p o n en t 0 .00 11 (1.8 3) 0 .01 66 (1.08 ) 0 .08 85 (3.61 ) ! 0. 0 1 2 0 (0 .4 4) 0. 1 1 Ru le s com po n ent 0. 0 0 0 6 (1 .2 6 ) ! 0 .00 73 ( ! 0.39 ) ! 0 .13 47 ( ! 4.05 ) ! 0 .12 18 ( ! 4.33 ) 0 .33 8th -dec il e h o ld ra n g e 0 .00 0 4 (1.1 7 ) 0 .01 2 2 (1.23 ) ! 0 .07 01 ( ! 3.47 ) ! 0 .11 30 ( ! 6.08 ) 0 .40 IP O ex cl u si on ! 0 .00 00 ( ! 0.0 9 ) ! 0 .01 02 ( ! 1.89 ) ! 0 .01 31 ( ! 1.56 ) 0 .04 9 5 (5.19 ) 0 .35 Lo w p ri ce /s iz e exc l. 0 .00 03 (1.1 4) ! 0 .00 92 ( ! 1.23 ) ! 0 .05 14 ( ! 3.29 ) ! 0 .05 84 ( ! 4.77 ) 0 .36
the overall period is due primarily to a significant growth tilt in the latter subperiod (¹"!3.74). This occurs because the growth tilt induced by the
eighth-decile hold range and the exclusion of low-price stocks more than offsets the value tilt provided by the IPO policy during this subperiod.
In summary, in the early period the investment rules of the 9—10 Fund, which induce a large-cap tilt relative to the 9—10 Index, heavily influenced the return behavior of the 9—10 Fund due to the significant large-cap premium that characterized this period. In contrast, in the later period the trade strategy, which increasingly relied on block trading in the upstairs market when buying shares, imparts a small-cap tilt because the blocks are primarily in the smaller end of the small-cap spectrum, thereby skewing the portfolio weights toward the smallest stocks in the fund. Combined, the small-cap tilt of the trade strategy offsets the large-cap influence of the investment rules, resulting in an insignific-ant size tilt relative to the 9—10 Index. However, the investment rules (the eighth-decile hold range and low-price restriction, in particular) impart a growth tilt to the fund relative to the index during this period.
6. Conclusions
This paper explores issues related to mutual fund design by examining the implementation of DFA’s 9—10 Fund, a passive mutual fund designed to deliver the returns and risks of small-cap stocks. The design is interesting because it recognizes the potentially excessive costs of a pure indexing strategy (which demands immediacy of execution) in the illiquid small-cap market. The 9—10 Fund’s strategy sacrifices tracking accuracy by allowing portfolio weights to deviate from the underlying index according to investment and trading strategies that are designed to minimize trading costs. As a result, over the 1982—1995 period the 9—10 Fund delivered the price behavior of small-cap stocks (the correlation between the monthly returns of the 9—10 Fund and the 9—10 Index is 0.98) while providing an annual premium of 2.2% over the 9—10 Index.
The investment rules and policies, which exclude very illiquid, low-price stocks and maintain a hold range that extends to a region of more liquid, larger-cap stocks than are included in the target universe, tend to reduce trade costs but also add a large-cap tilt to the fund relative to the index. As a result, the investment rules contribute positively to the performance differential during periods when large-cap stocks outperform small-cap stocks (like the 1980s) and contribute negatively during periods when small-cap stocks outperform large-cap stocks (like the early 1990s). On average, the investment rules contribute 12 basis points per month to the performance differential over the life of the fund, although much of this is attributable to the first portion of the 9—10 Fund’s history during the 1980s.
Through its trading strategy DFA is effectively operating as a supplier of liquidity and, as such, should enjoy reduced trading costs. The evidence con-firms this: trading contributes five basis points per month, gross of fees, to the performance differential during the 1982—1995 period. This positive contribu-tion is attributable to the latter porcontribu-tion of the 9—10 Fund’s history. After 1986, a period when at least half of the trading volume in each year was completed using lower-cost block trades, the trading contribution was a significant 17 basis points per month (¹"2.30). Seventeen basis points per month is economically
large; it is remarkable when compared to the averagereductionin value of 1.92% associated with the one-way trade costs of comparable NYSE and AMEX small-stock trades for a sample of institutional money managers in Keim and Madhavan (1997).
References
Allen, H.F., Gale, D., 1988. Optimal security design. Review of Financial Studies 1, 229—263. Booth, D.G., Keim, D.B., 1998. Is there still a January effect?, in: Keim, D.B., Ziemba, W.T. (Eds.),
Security market imperfections in world-wide equity markets. Cambridge University Press, Cambridge.
Fama, E.F., French, K., 1993. Common risk factors in the returns on stocks and bonds. Journal of Financial Economics 33, 3—56.
Keim, D.B., Madhavan, A., 1996. The upstairs market for large-block transactions: analysis and measurement of price effects. Review of Financial Studies 9, 1—36.
Keim, D.B., Madhavan, A., 1997. Execution costs and investment style: an interexchange analysis of institutional equity trades. Journal of Financial Economics 46, 265—292.
Loughran, T., Ritter, J.R., 1995. The new issues puzzle. Journal of Finance 50, 23—52.
Ritter, J.R., 1991. The long-run performance of initial public offerings. Journal of Finance 46, 3—28. Sinquefield, R.A., 1991. Are small stock returns achievable?. Financial Analysts Journal 47, 45—50.