The Study of Dopamine Dynamics in Transgenic Mouse Models
Brian M. Kile
A dissertation submitted to the faculty of the University of North Carolina at Chapel Hill in partial fulfillment for the degree of Doctor of Philosophy in the Department of Chemistry.
Chapel Hill 2009
Abstract
Brian M. Kile: The Study of Dopamine Dynamics in Transgenic Mouse Models (Under the direction of Dr. R. Mark Wightman)
To Eric L. Kile
(April 6, 1951-July 14, 2000).
Acknowledgements
Table of Contents
List of Tables ... x
List of Figures... xi
List of Abbreviations and Symbols ... xiii
Chapter I. Analytical Neuroscience and Transgenic Animals ... 1
Introduction ... 1
Murine Brain Slices ... 4
Electrochemistry ... 7
Brain Slice Measurements ... 15
High Performance Liquid Chromatography ... 17
Transgenic Mouse Models ... 19
Thesis Overview ... 23
Literature Cited ... 24
II. Materials and Methods ... 28
Introduction ... 28
Transgenic Mouse Models ... 28
Electrochemistry ... 30
Slice Experiments ... 31
Electrochemical Data Analysis ... 33
Simplex Modeling ... 34
Km Determination ... 35
Chromatographic Data Analysis ... 36
Drugs and Reagents ... 37
Literature Cited ... 38
III. Synapsins and Dopamine Release ... 40
Introduction ... 40
Materials and Methods ... 42
Results ... 42
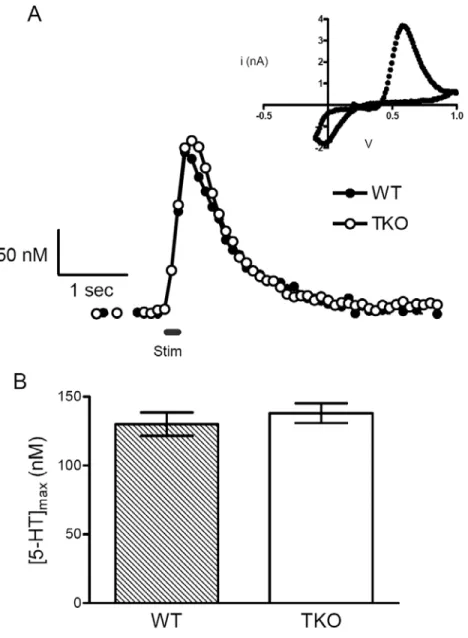
Serotonin Release in Substantia Nigra Brain Slices ... 42
Synapsins Affect Dopamine Release in Striatal Brain Slices ... 44
Synapsins Also Affect Striatal Dopamine Release in vivo ... 48
Calcium Dependence of Dopamine Release ... 50
Effects of Cocaine on Serotonin and Dopamine Release ... 53
Discussion ... 58
Synapsins Modulate Dopamine Release Dynamics ... 58
Synapsin Removal Alters Calcium Dynamics ... 61
Literature Cited ... 64
IV. Dopamine Uptake and Transporter Expression ... 68
Introduction ... 68
Materials and Methods ... 70
Results ... 70
Transgenic Modification of DAT Expression ... 70
Variation of Vmax with Transporter Copy Number ... 72
Increased Uptake Reduces Extracellular Dopamine Levels ... 77
DAT Overexpression Does Not Affect Autoreceptor Efficacy ... 80
Discussion ... 86
DAT Expression and Dopamine Uptake ... 86
DAT Expression and Dopamine Levels ... 87
Amphetamine Action on Dopamine Terminals ... 89
Literature Cited ... 91
V. Mitochondrial Proteins and Dopamine Release ... 95
Introduction ... 95
Materials and Methods ... 99
Disclaimer ... 99
Results ... 100
UCP2 Expression in the Substantia Nigra pars Compacta ... 100
Stimulated Neurotransmitter Release in Mouse Brain Slices ... 100
Genipin Modulation of Dopamine Release ... 104
Discussion ... 104
Literature Cited ... 108
VI. Content Analysis by High Performance Liquid Chromatography ... 111
Introduction ... 111
Materials and Methods ... 113
Results ... 113
Total Content Analysis of Transgenic Animals ... 114
Total Content Changes in Brain Regions of the Rat ... 117
Biogenic Amine Distribution in Murine Adrenal Glands ... 120
Analyzing Iontophoretic Ejections ... 120
Discussion ... 124
Isocratic Elutions of Biogenic Amines ... 124
Biogenic Amine Profiles by RP-HPLC ... 129
Evaluating Iontophoretic Ejections by RP-HPLC ... 130
Literature Cited ... 132
VII. Disease State Mouse Models ... 135
Introduction ... 135
Materials and Methods ... 138
Disclaimer ... 138
Results ... 139
Stimulated Dopamine and 5-HT Release in ob/ob Animals ... 139
Biogenic Amine Release in Fragile X Mutant Mice ... 139
Discussion ... 143
Leptin Removal and Neurotransmitter Release ... 143
Fragile X Syndrome and Neurotransmitter Release ... 144
Literature Cited ... 145
VIII. Experimental Parameters and Dopamine Release ... 148
Introduction ... 148
Materials and Methods ... 148
Results ... 149
Dopamine Sensitivity and Application Frequency ... 149
Temporal Response of FSCV ... 149
Temporal Response of FSCV Compared to Amperometry... 151
Anesthetics and Neurotransmitter Release ... 153
Iontophoretic Ejection Markers and Dopamine Release ... 155
Changes in Basal Dopamine Concentrations ... 155
Discussion ... 159
Deconvoluted FSCV Mimics Amperometry ... 161
Anesthetic Effects on Stimulated Dopamine Release ... 162
Iontophoresis Markers and Dopamine Release ... 164
Dopamine Reverse Transport ... 164
List of Tables
List of Figures
Figure 1.1 Schematic drawing of a unipolar neuron ... 2
Figure 1.2 Mechanism of action potential propagation ... 5
Figure 1.3 Slicing planes used for brain slice orientation ... 6
Figure 1.4 Sagittal brain slice showing dopamine neuron expression ... 8
Figure 1.5 An electron micrograph of a T-650 carbon fiber electrode ... 10
Figure 1.6 Fast scan cyclic voltammetry of biogenic amines ... 12
Figure 1.7 Digital background subtraction of the charging current ... 14
Figure 1.8 Stimulated dopamine release in striatal brain slices ... 16
Figure 1.9 Isocratically separated biogenic amines and metabolites ... 18
Figure 3.1 Stimulated 5-HT release in SNr brain slices from WT and TKO animals ... 43
Figure 3.2 Stimulated dopamine release is enhanced in TKO brain slices ... 45
Figure 3.3 In vivo dopamine release from WT and TKO animals ... 49
Figure 3.4 The Ca2+ release profile from WT and TKO animals ... 51
Figure 3.5 Cocaine inhibits 5-HT and dopamine uptake in WT and TKO animals ... 55
Figure 3.6 Dopamine release is enhanced by cocaine while 5-HT is unaffected ... 56
Figure 3.7 Cocaine alters the Ca2+ dependence of dopamine release ... 57
Figure 4.1 Increased DAT expression by pronuclear injection ... 71
Figure 4.2 Immunogold-silver staining of DAT ... 73
Figure 4.3 The shape of stimulated dopamine release depends on DAT ... 74
Figure 4.4 Vmax measurements using FSCV and amperometry in DAT-Tg (6) animals ... 76
Figure 4.5 Vmax is dependent on DAT copy number while Km is not ... 78
Figure 4.6 DAT controls the extracellular dopamine concentration ... 79
Figure 4.7 Uptake blockade prevents DAT modulation of [DA]max ... 81
Figure 4.9 Behavioral activation by amphetamine is greater in DAT-Tg (5) animals ... 84
Figure 4.10 The rate of reverse transport is independent of transporter number ... 85
Figure 5.1 UCP2 is a mitochondrial proton channel ... 96
Figure 5.2 UCP2 mRNA is expressed in the dopamine midbrain ... 98
Figure 5.3 Dopamine but not 5-HT release is enhanced in UCP2 KO animals ... 101
Figure 5.4 UCP2 KO animals have a higher Vmax than WT animals ... 102
Figure 5.5 Genipin is unable to modulate dopamine release or uptake ... 103
Figure 6.1 Isocratic separation of biogenic amines ... 115
Figure 6.2 Striatal brain homogenate analyzed by RP-HPLC ... 116
Figure 6.3 The vBNST has a gradient of dopamine and NE contents ... 119
Figure 6.4 Catecholamine distribution in mouse adrenal glands ... 121
Figure 6.5 Iontophoretic ejection experimental set-up ... 122
Figure 6.6 Charge analytes are ejected more quickly than neutral analytes ... 123
Figure 7.1 Leptin deficient (ob/ob) animals are larger than WT counterparts ... 136
Figure 7.2 Dopamine but not 5-HT release is reduced in ob/ob animals ... 140
Figure 7.3 The Vmax of dopamine uptake is reduced in ob/ob animals ... 141
Figure 7.4 Fragile X KO mice do not have disrupted biogenic amine release ... 142
Figure 8.1 The waveform application frequency alters the carbon fiber electrode ... 150
Figure 8.2 Km measurements at 10 Hz and 60 Hz ... 152
Figure 8.3 Amperometry is faster but less sensitive than FSCV ... 154
Figure 8.4 Ketamine and urethane effects on dopamine or 5-HT release ... 156
Figure 8.5 Iontophoretic ejection markers alter dopamine release ... 157
List of Abbreviations
5-HT 5 hydroxytryptamine or serotonin
[DA]max The maximum extracellular dopamine concentration aCSF Artificial cerebrospinal fluid
AMPH Amphetamine
AP Acetamidophenol
ATP Adenosine triphosphate BAC Bacterial vector
CFME Carbon fiber microelectrode
CNQX 6-cyano-7-nitroquinoxaline-2,3-dione CV Cyclic voltammogram or cyclic voltammetry
DA Dopamine
DAT Dopamine transporter DNA Deoxydribonucleic acid
E Epinephrine
ECD Electrochemical detector or electrochemical detection EDTA Ethylenediaminetetra-acetic acid
eGFP Enhanced green fluorescent protein EM Electron micrograph
EOF Electroosmotic flow ES Embryonic stem cell
GABA Gamma (γ)-amino butyric acid
HPLC High performance (pressure) liquid chromatography HSVTK Transgenic cassette containing the NEO and TK genes Kca2+ Calcium constant for dopamine release
Ki Inhibition constant for a competitive inhibitor of DAT
Km Michaelis-Menten constant (also listed with subscript app when inhibitor present)
KO Knock-out
L-dopa 3,4-dihydroxy-L-phenyalanine (dopamine precursor)
MAO Monoamine oxidase
MAOI Monoamine oxidase inhibitor
METH Methamphetamine
MFB Medial forebrain bundle MPP+ (1-methyl-4-phenylpyridinium)+
MPTP 1-methyl-4-phenyl-1,2,3,6-tetrahydropyridine mRNA Messenger ribonucleic acid
Nac Nucleus accumbens
NE Norepinephrine
NET Norepinephrine transporter NPE 2-(4-nitrophenoxy) ethanol PCR Polymerase chain reaction PTT 2β-propanoyl-3β-(4-tolyl)-tropane
Quin quinelorane
RNA Ribonucleic acid
ROS Reactive oxygen species
SEM Standard error in the mean SERT Serotonin transporter
SNr Substantia nigra pars reticulata SNc Substantian nigra pars compacta T-650 Thornel® 650 carbon fiber
TKO Triple knockout
tr Retention time
UCP2 Uncoupling protein 2
vBNST Ventral bed nucleus of the stria terminalis VMAT2 Vesicle monoamine transporter
Vmax Maximal uptake velocity in µM s-1 VTA Ventral tegmental area
Chapter 1
Analytical Neuroscience and Transgenic Animals
Introduction
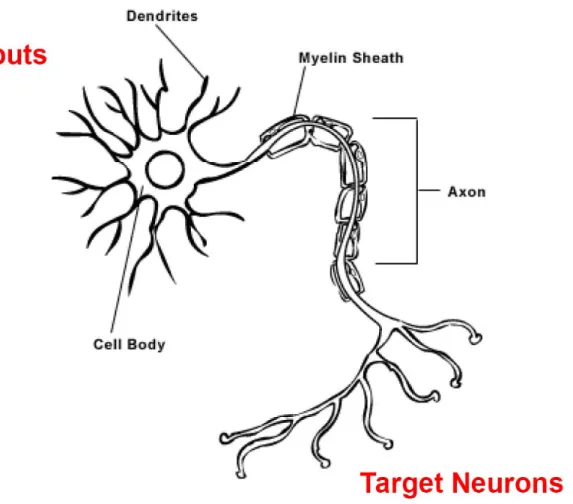
Information is transmitted through the brain via electrical impulses carried along
neurons, specialized cells capable of propagating electrical and chemical signals (Figure
1.1). Electrical signals are carried along the dendrites and axon of the neuron by ion
movement (primarily Na+, K+, and Cl-) across the plasma membrane (Hodgkin and Huxley,
1952a, b). The ion gradient that is created due to this movement changes the relative
potential of the plasma membrane. Wave like potential changes along the plasma
membrane allow for information to pass along the axon, dendrites, and cell body (Figure
1.2). The normal resting potential of a neuron is negative; positive deflections in membrane
potential are considered excitatory while negative changes are considered inhibitory. A
neuron will receive excitatory and inhibitory electrical inputs at its dendrites where they will
be summated at the cell body. If the summated inputs exceed a predetermined threshold,
the cell will fire an action potential that propagates down its axon. The axon synapses with
the dendrites of target neurons at which point electrical propagation of the signal switches to
a chemical form of communication. Information is transmitted at synapses through the use
of chemical messengers termed neurotransmitters. When the action potential reaches the
synapse, voltage gated Ca2+ channels open and Ca2+ enters the presynaptic terminal. The
membrane followed by the expulsion of neurotransmitters into the extracellular space.
These chemicals diffuse to pre- and postsynaptic targets where they trigger responses via
specific receptors.
The action of neurotransmitters at their targets depends upon the location of
synapse, the type of neurotransmitter, and the type of receptor that it binds. In general,
neurotransmitters will act either to open an ion channel, affecting the polarity of the
postsynaptic cell, or to begin an intracellular messenger cascade, changing how the target
cell operates on a longer time scale (Brown and Birnbaumer, 1989; Unwin, 1993). The
duration of action for most neurotransmitters is short; therefore, clearance mechanisms exist
to cease neurotransmitter action. These include uptake into neurons by membrane bound
transport proteins, a relatively rapid process, and the slower process of degradation by
free-floating enzymes in the extracellular space (Kandel, 2008).
The biogenic amine neurotransmitters primarily act as modulators of neuronal activity
in the brain. The biogenic amines include serotonin (5-HT), dopamine, and norepinephrine
(NE). These chemicals are known to modulate movement, wakefulness, mood, pleasure,
addiction, and appetite (Cooper et al., 2003). Proper understanding of neuronal function
related to these neurotransmitters has implications for disease state and addiction studies.
An example of the ability of these neurotransmitters to modulate behavior is the 5-HT
modulation of dopamine release (Fink and Gothert, 2007). Selective antagonism of 5-HT2A
receptors can alleviate movement phenotypes commonly associated with
hyperdopaminergia (Barr et al., 2004). 5-HT innervation of the dopamine cell bodies in the
midbrain changes their firing rate which affects the amount of dopamine released in the
striatum. In the striatum, dopamine is responsible for modulation of the synaptic strength
between γ-aminobutyric acid (GABA) (the main inhibitory neurotransmitter) neurons and
dopamine acts on the glutamate-sensitive medium spiny neurons (GABAergic neurons that
project to motor cortex) altering the ability of released glutamate to initiate movement. This
example demonstrates how biogenic amines can regulate each other as well as other
neurotransmitters and how this regulation relates to behavioral responses.
Murine Brain Slices
Neurons exist in tightly packed networks that weave throughout the brain to different
targets of action. In many cases the neurotransmitter target is distal to the location of the
cell bodies. A cluster of cell bodies, known as a nucleus, will project a bundle, or tract, of
axons to multiple sites of termination. This organization can be seen in the serotonergic
system where three cell nuclei are responsible for distributing 5-HT to 17 different target
regions (Heimer, 1995). Dissection of live tissue by techniques such as the preparation of
brain slices facilitates the isolation of these systems for study. Isolation can involve the
selection of a specific neurotransmitter tract (eg: isolation of the nigrostriatal dopamine
pathway) or portions of the same neurotransmitter tract (eg: separation of 5-HT terminals in
the ventral tegmental area from 5-HT cell bodies in the dorsal raphe nucleus).
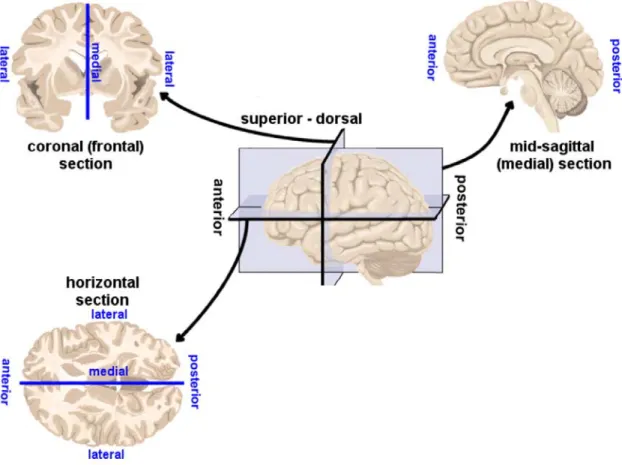
Mouse brain slices are a robust and controlled preparation for the isolation and
maintenance of brain regions for analytical studies. The brain can be divided along three
planes: horizontal, sagittal, and coronal. Figure 1.3 shows examples of these three sections
and how they are taken from a human brain. The nomenclature described in Figure 1.3 is
identical for sections taken from the mouse brain. Using a reference atlas such as The
Mouse Brain in Stereotaxic Coordinates by Keith Franklin and George Paxinos (Paxinos et
al., 1985), it is possible to pinpoint an anatomical location within a brain slice. When the
area of interest is contained within a thin section of live tissue, it can be maintained under
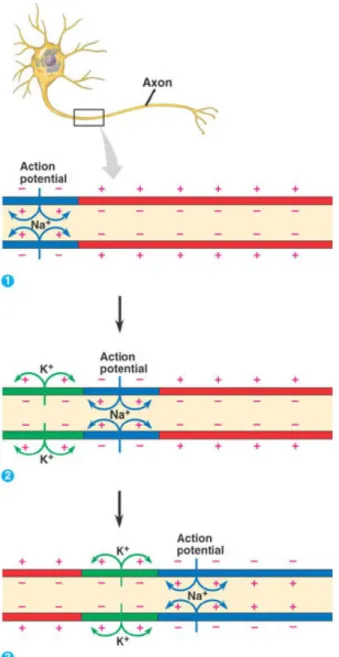
Figure 1.2 The action potential propagating down an axon. 1) Voltage gated channels open allowing Na+ to flow in along its concentration gradient. The membrane potential shifts
to a more positive potential (blue coloration) called depolarization. 2) Behind the region of more positive membrane potential K + rushes out of voltage gated K + channels. This leads
to a hyperpolarized region of membrane (green coloration). 3) Both the depolarized and hyperpolarized regions move along the axon as voltage gated Na + and K + channels open
isolating and studying midbrain structures which are occluded by the cortex and difficult to
visualize and access when the brain remains intact (Kandel, 2008). Slices are prepared
according to the structures and anatomical orientation deemed most appropriate to answer
the specific question of interest. For example, the isolation of the intact nigrostriatal
dopamine pathway is best achieved using a sagittal or horizontal section while isolation of
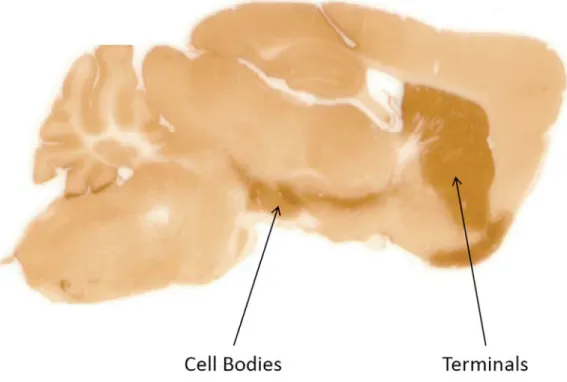
the dopamine terminal region is best done with a coronal section. A brain slice is shown in
Figure 1.4 where the nigrostriatal dopamine pathway has been visualized with
immunoperoxidase staining of the dopamine transporter (DAT) (Salahpour et al., 2008).
Had this slice been maintained in a viable state rather than fixed, it would have been
possible to do spatially resolved studies at the cell bodies, terminals, or both.
Electrochemistry
Electrochemistry is a technique through which redox chemistry can be used to study
electroactive species at the surface of an electrode. Direct monitoring of neurotransmitter
concentration changes over time is important to properly understand their actions in the
brain. This dissertation focuses on the use of two types of electrochemistry to monitor
biogenic amines: fast scan cyclic voltammetry (FSCV) and constant potential amperometry
(referred to hereafter as amperometry). The analytical sensor used was a carbon fiber
microelectrode (CFME) (Cahill et al., 1996).
FSCV at CFMEs is a useful method to evaluate the concentration of biogenic amines
and its rapid changes. In FSCV, a linear voltage ramp is used to oxidize and reduce
species of interest at an electrode surface. FSCV at CFMEs has the ability to monitor small
changes in analyte concentration while in a complex mixture. Monitoring neurotransmitter
release in brain tissue is subject to a unique set of analytical problems: closely resolved
sensitive technique, and a host of interfering compounds requires selectivity for the analyte
of interest. Also, subsecond time resolution is necessary to effectively monitor real time
release and uptake events in biological tissue (Venton et al., 2002). The cylindrical T-650
CFME used in this work is 6 µm in diameter and cut to a length of 50 µm, providing very
good spatial resolution (Figure 1.5) (Kawagoe et al., 1993; Cahill et al., 1996). Carbon
fibers provide enhanced sensitivity by adsorbing biogenic amines when held at a negative
potential (Heien et al., 2003).
The peak faradaic current at a voltammetric electrode can be defined by (Bard and
Faulkner, 2001):
2.69 10 / / / 1
where n is the number of electrons, A is the electrode area, DO is the diffusion rate of the
oxidant, Co is the concentration of the oxidant, and v is the scan rate. This equation predicts
that the peak faradaic current should increase as the square root of the scan rate, but it only
applies to a freely diffusing, non-adsorbed oxidant in solution. When an analyte is adsorbed
to the electrode surface its peak faradaic current scales proportionally with scan rate,
enhancing the analytical signal associated with the same concentration of non-adsorbed
analyte at a given scan rate. The adsorption of analyte on the sensor surface enhances the
electrochemical signal by preconcentrating the analyte and changing its electrochemical
properties.
The selectivity and temporal resolution required to monitor neurotransmission is
provided by performing FSCV at the CFME. The use of an ultra-microelectrode such as a
CFME permits the use of faster scan rates by reducing the ohmic drop and RC time
constant of the electrode (Wightman et al., 1988). Typical scan rates used in this work
resolution of the CFME using FSCV under these conditions would be 100 ms for 10 Hz and
16.7 ms for 60 Hz. Other techniques used to monitor neurotransmission, such as
microdialysis, normally operate on the minute time scale. The fastest demonstrated
microdialysis measurements were made 15 s apart using stepped flow sampling (Wang et
al., 2008).
A second advantage to FSCV is the selectivity achieved using the cyclic
voltammogram (CV) for identification of an analyte. Figure 1.6 shows the structures, voltage
ramps, and CVs for dopamine and 5-HT. The positive current arises from oxidation of
dopamine or 5-HT accumulated on the electrode surface in the time between scans (either
100 ms or 16.7 ms) while the negative current is the reduction of oxidized analyte remaining
on the electrode surface. The positive and negative current deflections occur at a
characteristic potential for each analyte, allowing the identity and presence of the analyte to
be verified in a complex mixture of proteins, lipids, other neurotransmitters, and dissolved
gases. Notice that the ramp used for 5-HT is different than that for dopamine (Figure 1.6).
The electrochemistry of 5-HT is more complicated than dopamine, requiring a more complex
waveform to prevent the accumulation of interfering species that form when 5-HT is oxidized
(Jackson et al., 1995). Figure 1.6 also shows that although the voltammetric waveforms are
very different, the oxidation of both analytes occurs at a similar potential. This similarity
should prevent positive identification of 5-HT over dopamine if both were present in a
mixture. However, the ramp provides enhanced sensitivity for 5-HT over dopamine because
the electrode rests at a positive potential preventing dopamine adsorption (Jackson et al.,
1995). This waveform makes the electrode insensitive to physiological dopamine
concentrations and allows for exclusive monitoring of 5-HT in the presence of dopamine.
Therefore, the FSCV potential ramp can be used to impart selectivity on the electrode if the
Figure 1.6 Example voltammograms of two biogenic amines. Left Panels: Dopamine is detected using a linear voltage ramp from -400 mV to 1,000 mV back to -400 mV scanned at 600 V/s. The dopamine CV is characterized by an ip,c at 650 mV and an ip,a at -200 mV.
An unavoidable effect of scanning a voltammetric electrode quickly is the large
background current associated with charging of the double layer capacitance. The
background current swamps out the relatively small faradaic current associated with analyte
detection. For example, the background of a typical 50 µm cylinder electrode may be as
high as 1000 nA while the current due to dopamine oxidation is typically less than 10 nA. To
get around this problem, background subtracted FSCV is used (Figure 1.7). The
background is stable over the time period of the measurement and can be removed by
subtraction leaving only the faradaic current associated with analyte detection.
Amperometry is used when greater temporal response is necessary. In FSCV, there
is a time delay associated with the adsorption and desorption of the analyte from the
electrode surface (Heien et al., 2003). These events slow the electrode response to
changes in analyte concentration (Bath et al., 2000). In amperometry the electrode is held
at a constant potential sufficient to oxidize the analyte of interest (700 mV for dopamine).
When the analyte encounters the electrode surface it is immediately oxidized and a signal
recorded (Hochstetler et al., 2000). The lack of any adsorption or desorption means that the
temporal response is only limited by mass transport and electron transfer kinetics. The net
result is a faster response time than FSCV (Mundroff and Wightman, 2002). Amperometric
measurements are less sensitive (almost 100 fold for dopamine) than FSCV due to a lack of
preconcentration; however, similar S/N ratios have been reported for the two techniques
(Venton et al., 2002). Unfortunately, the lack of an analyte-specific cyclic voltammogram
prevents analyte identification. For this reason amperometry is generally only used once the
Brain Slice Measurements
Brain slices are a robust and reliable tissue preparation to be used in
electroanalytical studies. In a brain slice experiment, neurotransmitter release is typically
evoked by a current pulse through a bi-polar stimulating electrode and monitored at the
working electrode (Figure 1.8). The data from the working electrode is viewed in two ways:
the CV (as shown in Figure 1.7), used for substance identification, and the current trace,
generated by monitoring the oxidation potential for changes over time (Figure 1.8). The
current trace is then translated into a concentration trace by calibrating the electrode against
a known concentration of analyte (see chapter 2). The concentration trace has two distinct
phases that occur after electrical stimulation. There is an instantaneous rise in amine
concentration after stimulation followed by clearance through presynaptic uptake
transporters (Figure 1.8). The environment of the slice can be modified by changing ion
concentrations, applying drugs, or changing temperature to modify the size and shape of
this basic curve.
Brain slice experiments are particularly informative when monitoring uptake kinetics.
The uptake of biogenic amines can be effectively modeled using Michaelis-Menten kinetics
where the transporter is treated as the enzyme and the neurotransmitter as the substrate.
Based on these approximations, the concentration of amine can be expressed as a function
of time for a single pulse stimulation:
1 2
Based on this equation the uptake parameters Km (the binding affinity for dopamine at the
transporter) and Vmax (the maximal rate of dopamine uptake) can be calculated for different
robust and effective way to measure clearance rates (Wightman et al., 1988; Wu et al.,
2001). A more detailed explanation of how uptake rates can change in the brain will be
explained in later chapters.
High Performance Liquid Chromatography
High performance liquid chromatography (HPLC) with electrochemical detection is
an important technique for the support and validation of electrochemical monitoring of
biogenic amines using CFMEs in brain slices. HPLC is most often used as the analytical
sensor associated with microdialysis measurements (Umriukhin et al., 2007; Howard et al.,
2008; Wang et al., 2008). Chapter 6 focuses on the use of HPLC in support of
electrochemical data by providing information about the content of amines in a particular
brain region. HPLC is run using an amperometric detector incapable of differentiating
between different biogenic amines electrochemically. The selectivity of the HPLC
measurement arises from a polarity based separation mechanism which resolves biogenic
amines temporally (Figure 1.9). An additional analytical technique like HPLC is often
needed because, although powerful, FSCV is unable to determine the total biogenic amine
profile for a particular brain region. Total content is also important data to have in cases
where the amount of dopamine being released has been altered in some way (Senior et al.,
2008). The combination of electrochemical and chromatographic data provides better
understanding of the mechanism of the release change by separating changes in dopamine
available for release and an increased release probability of dopamine. LC total content
measurements are also powerful when looking at regions with interfering substances. The
total content measurements can verify or refute the presence of a neurotransmitter that
Transgenic Mouse Models
In 2007, Oliver Smithies shared the Nobel Prize in Medicine with Sir Martin Evans
and Mario Capecchi for their contributions to the field of transgenic mutagenesis. In
particular, their research was central to the development of embryonic stem (ES) cells as
vehicles for specific gene mutations. The role of transgenic mice in the development of
disease state models cannot be downplayed. Mouse models such as these can be credited
with the development of new Alzheimer’s treatments, diabetes drugs, and the advancement
of heart disease research among other things. A few more examples of the impact made by
transgenic mice in the medical field can be found in the following references (Adlard et al.,
2008; Bjorkqvist et al., 2008; Choi et al., 2008; Pattison and Robbins, 2008; Seidler et al.,
2008). The two most common generation techniques are direct transfection or ES cells
transfection of fertilized embryos.
The first technique involves the direct introduction of foreign DNA into a fertilized
mouse embryo. The introduction of the foreign DNA can be performed by pronuclear
injection, retroviral infection, or adenoviral infection. Pronuclear injection requires the
introduction of foreign DNA by micropipette directly into the fertilized egg. Transfected eggs
are then implanted into a pseudo-pregnant female who gives birth to a founder animal (a
pup that expresses the transgene). Once germline transmission of the transgene is
complete, many generations are mated to create homozygous transgenic animals. This
technique is more technically controlled than the viral transfection techniques, but requires a
longer training period for proficiency and more expensive equipment. Pronuclear injection
technique can also yield unreliable transfection results because the number of incorporated
transgene copies is unknown, and the expression of the transgene can be affected by its
Viral transfection involves the incubation of a fertilized egg with adeno or
retroviruses. These viruses are unable to replicate their own genome because they have
had selected genetic deletions preventing it. Even though replication is prevented, the virus
is still able to interpolate some foreign DNA into the host egg for replication. Viral
transfection of fertilized eggs is more cost effective than pronuclear injection, but does have
limitations. Only a small amount of exogenous genetic material can be added to the viral
genome (4-7.5 kb) without making the virus non-functional. The relatively small amount of
genetic material that is implantable with this technique makes it impractical for large genetic
manipulations. In rare cases, the virus can undergo recombination with the host genome
activating its replication ability. The entire viral genome will then propagate through the host
egg. The problems with viral transfection are often outweighed by a simpler and cheaper
technique than would be possible with pronuclear injection.
The development of ES cells as transgene hosts has eliminated many of the
problems associated with previous methodologies. ES cells are undifferentiated cells
capable of replicating to form any type of physiological tissue, and therefore are capable of
carrying a transgenic manipulation to all cell types. Under proper conditions they can be
maintained in an undifferentiated state where the addition of exogenous genetic material
can occur. ES cells expressing the desired transgene can then be selected for injection into
the fertilized egg. The selection of cells is most often done using a selectable marker gene
in the transgenic cassette. The integration of the selectable marker gene will convey
attributes to the transfected cell such as antibiotic resistance that can be used to isolate it
from non transfected cells. There are many different types of selectable markers such as
NEO or β-GEO which impart neomycin resistance or expression of β-galactosidase
respectively. Reporter genes can also be added to the cassette so that the degree of gene
Gene targeting relies on the naturally occurring process of homologous
recombination to impart characteristics on the host animal. The first evidence of
homologous recombination was in the early 1980s between two plasmid molecules, and
was soon followed by targeting of the first endogenous locus in 1985 (Folger et al., 1982;
Smithies et al., 1985). Homologous recombination requires the use of known endogenous
sequence markers for targeted transfer of genetic material in ES cells. There are two main
types of gene targeting: replacement and insertion. These techniques differ mainly in the
design of the DNA vector (both contain homologous sequences, reporter genes, selectable
marker genes, and the transgene). In general, two flanking regions of homology (at least
500 bp on the short arm) are used because the length of homology increases the targeting
frequency (typically only 1:1,000,000 treated cells undergo targeted recombination).
Replacement vectors are structured so that they contain two separate homologous regions
separated by non-homologous DNA which is then incorporated into the host DNA replacing
the area between the homologues. The vector is cut outside of the region of homology
forcing the DNA polymerase to replace the endogenous locus during recombination. The
insertion vector is linearized within the region of homology inducing the DNA polymerase to
insert the entire cassette between the regions of homology. Either technique can be used to
generate gene knockout mice; however, only insertion can be used to generate a gene
knock-in animal.
Most targeted transfections require a double selection process during which ES cells
that express the gene are selected then screened for proper gene targeting. A common
double selection method uses HSVTK (contains NEO and TK marker genes in the cassette).
The NEO gene provides resistance to neomycin like drugs while the TK gene makes the cell
susceptible to ganciclovir. The transgene is created such that homologously transfected
against G418 (a synthetic neomycin derivative) spares all cells expressing the transgene. A
second exposure to ganciclovir only spares cells that have undergone homologous
recombination because a randomly inserted transgene makes the cell sensitive to
ganciclovir. The selected cells are then used to generate a mouse line that has the targeted
transgene expressed in the correct genetic location.
The introduction of genetic material by insertion is more complicated than the
knockout procedure. The insertion of genetic material is difficult because the reporter gene
or selectable marker gene could impede on the expression of the transgene once the
transgenic animal has been generated. A method developed to deal with this problem
utilizes the Cre-loxP system to remove the reporter region after selection (Sunaga et al.,
1997). This system is a robust way to snip out small sections of genetic material by flanking
that gene(s) with loxP binding sites. The enzyme cre recombinase binds and removes the
genetic material between two loxP binding sites. Cre recombinase exposure can be done
while the cells are still in vitro or once the animal has been generated. An example insertion
paradigm would use a selectable marker that is flanked by loxP binding sites. After a
positive selection is done using the marker to select for cells expressing the transgene, cre
recombinase is used to remove the selectable marker gene preventing interference with the
transgene. A similar removal could be done for any reporter genes that are being used to
measure transgene expression. This example is by no means the only use of the Cre-loxP
system. Binding sites for cre recombinase could also be placed around endogenous genetic
material. Endogenous material could then be silenced at particular times to study the effect
of a particular gene during development or cut out to generate a knockout animal.
Performing transgenic manipulations in this way is often referred to as conditional
transfections. The use of this system is a more elegant way of transfecting but is not always
A large amount of literature is available for the study of mouse transgenic
techniques. The topics discussed here are only a sampling and are derived mainly from
several sources dedicated to the molecular biology of transgenic mouse generation
(Scarpelli et al., 1992; Tymms and Kola, 2001; Clarke, 2002; Hofker and Deursen, 2003).
Thesis Overview
The following work focuses on the combination of electrochemistry, brain slices, and
transgenic mouse models for the evaluation of biogenic amine transmission in the brain.
Five distinct transgenic mouse models have been used to better understand the
neurotransmission of dopamine and 5-HT. A particular emphasis has been placed on
dopaminergic transmission as it applies to movement phenotypes and drugs of addiction (ie.
cocaine and methamphetamine). Collaboration with Marc Caron at Duke University has
facilitated the study of animals over-expressing the dopamine transporter and how it relates
to amphetamine sensitivity and movement initiation. A second transgenic mouse model
from the lab of George Augustine at Duke University has been used to study the genetic
deletion of the presynaptic protein synapsin and how it relates to the action of cocaine. Two
mouse models were used in collaboration with the lab of Brad Lowell at Harvard University.
These mice were used to evaluate obesity and ATP utilization and how they apply to
movement phenotypes and dopamine release. Finally, dopamine dynamics in Fmr1 KO
mice were studied in collaboration with the University of Illinois at Urbana-Champagne. This
dissertation will clearly demonstrate the power of transgenic mouse models for the
Literature Cited
Adlard PA, Cherny RA, Finkelstein DI, Gautier E, Robb E, Cortes M, Volitakis I, Liu X, Smith JP, Perez K, Laughton K, Li QX, Charman SA, Nicolazzo JA, Wilkins S, Deleva K, Lynch T, Kok G, Ritchie CW, Tanzi RE, Cappai R, Masters CL, Barnham KJ, Bush AI (2008) Rapid restoration of cognition in Alzheimer's transgenic mice with 8-hydroxy quinoline analogs is associated with decreased interstitial Abeta. Neuron 59:43-55.
Bard AJ, Faulkner LR (2001) Electrochemical methods : fundamentals and applications, 2nd Edition. New York: Wiley.
Barr AM, Lehmann-Masten V, Paulus M, Gainetdinov RR, Caron MG, Geyer MA (2004) The selective serotonin-2A receptor antagonist M100907 reverses behavioral deficits in dopamine transporter knockout mice. Neuropsychopharmacology 29:221-228.
Bath BD, Michael DJ, Trafton BJ, Joseph JD, Runnels PL, Wightman RM (2000) Subsecond adsorption and desorption of dopamine at carbon-fiber microelectrodes. Anal Chem 72:5994-6002.
Bjorkqvist M, Wild EJ, Thiele J, Silvestroni A, Andre R, Lahiri N, Raibon E, Lee RV, Benn CL, Soulet D, Magnusson A, Woodman B, Landles C, Pouladi MA, Hayden MR, Khalili-Shirazi A, Lowdell MW, Brundin P, Bates GP, Leavitt BR, Moller T, Tabrizi SJ (2008) A novel pathogenic pathway of immune activation detectable before clinical onset in Huntington's disease. J Exp Med 205:1869-1877.
Brown AM, Birnbaumer L (1989) Ion channels and G proteins. Hosp Pract (Off Ed) 24:189-193, 198, 202-184.
Cahill PS, Walker QD, Finnegan JM, Mickelson GE, Travis ER, Wightman RM (1996) Microelectrodes for the measurement of catecholamines in biological systems. Anal Chem 68:3180-3186.
Chase TN, Oh JD (2000) Striatal dopamine- and glutamate-mediated dysregulation in experimental parkinsonism. Trends Neurosci 23:S86-91.
Choi CW, Chung YJ, Slape C, Aplan PD (2008) Impaired differentiation and apoptosis of hematopoietic precursors in a mouse model of myelodysplastic syndrome. Haematologica 93:1394-1397.
Cooper JR, Bloom FE, Roth RH (2003) The biochemical basis of neuropharmacology, 8th Edition. Oxford ; New York: Oxford University Press.
Fink KB, Gothert M (2007) 5-HT receptor regulation of neurotransmitter release. Pharmacol Rev 59:360-417.
Folger KR, Wong EA, Wahl G, Capecchi MR (1982) Patterns of integration of DNA
microinjected into cultured mammalian cells: evidence for homologous recombination between injected plasmid DNA molecules. Mol Cell Biol 2:1372-1387.
Heien ML, Phillips PE, Stuber GD, Seipel AT, Wightman RM (2003) Overoxidation of carbon-fiber microelectrodes enhances dopamine adsorption and increases sensitivity. Analyst 128:1413-1419.
Heimer L (1995) The human brain and spinal cord : functional neuroanatomy and dissection guide, 2nd Edition. New York: Springer-Verlag.
Hochstetler SE, Puopolo M, Gustincich S, Raviola E, Wightman RM (2000) Real-time amperometric measurements of zeptomole quantities of dopamine released from neurons. Anal Chem 72:489-496.
Hodgkin AL, Huxley AF (1952a) Propagation of electrical signals along giant nerve fibers. Proc R Soc Lond B Biol Sci 140:177-183.
Hodgkin AL, Huxley AF (1952b) Movement of sodium and potassium ions during nervous activity. Cold Spring Harb Symp Quant Biol 17:43-52.
Hofker MH, Deursen Jv (2003) Transgenic mouse methods and protocols. Totowa, N.J.: Humana Press.
Howard EC, Schier CJ, Wetzel JS, Duvauchelle CL, Gonzales RA (2008) The shell of the nucleus accumbens has a higher dopamine response compared with the core after non-contingent intravenous ethanol administration. Neuroscience 154:1042-1053.
Jackson BP, Dietz SM, Wightman RM (1995) Fast-scan cyclic voltammetry of 5-hydroxytryptamine. Anal Chem 67:1115-1120.
Kawagoe KT, Zimmerman JB, Wightman RM (1993) Principles of voltammetry and microelectrode surface states. J Neurosci Methods 48:225-240.
Mundroff ML, Wightman RM (2002) Amperometry and cyclic voltammetry with carbon fiber microelectrodes at single cells. Curr Protoc Neurosci Chapter 6:Unit 6 14.
Pattison JS, Robbins J (2008) Protein misfolding and cardiac disease: establishing cause and effect. Autophagy 4:821-823.
Paxinos G, Watson C, Pennisi M, Topple A (1985) Bregma, lambda and the interaural midpoint in stereotaxic surgery with rats of different sex, strain and weight. J Neurosci Methods 13:139-143.
Salahpour A, Ramsey AJ, Medvedev IO, Kile B, Sotnikova TD, Holmstrand E, Ghisi V, Nicholls PJ, Wong L, Murphy K, Sesack SR, Wightman RM, Gainetdinov RR, Caron MG (2008) Increased amphetamine-induced hyperactivity and reward in mice
overexpressing the dopamine transporter. Proc Natl Acad Sci U S A 105:4405-4410.
Scarpelli DG, Migaki G, Pletcher JM, Registry of Comparative Pathology. (1992) Transgenic animal models in biomedical research : proceedings of a Symposium held at the National Institutes of Health, Bethesda, Maryland, November 4-5, 1991. Washington, DC: Armed Forces Institute of Pathology.
Seidler B, Schmidt A, Mayr U, Nakhai H, Schmid RM, Schneider G, Saur D (2008) A Cre-loxP-based mouse model for conditional somatic gene expression and knockdown in vivo by using avian retroviral vectors. Proc Natl Acad Sci U S A 105:10137-10142.
Senior SL, Ninkina N, Deacon R, Bannerman D, Buchman VL, Cragg SJ, Wade-Martins R (2008) Increased striatal dopamine release and hyperdopaminergic-like behaviour in mice lacking both alpha-synuclein and gamma-synuclein. Eur J Neurosci 27:947-957.
Smithies O, Gregg RG, Boggs SS, Koralewski MA, Kucherlapati RS (1985) Insertion of DNA sequences into the human chromosomal beta-globin locus by homologous
recombination. Nature 317:230-234.
Sunaga S, Maki K, Komagata Y, Ikuta K, Miyazaki JI (1997) Efficient removal of loxP-flanked DNA sequences in a gene-targeted locus by transient expression of Cre recombinase in fertilized eggs. Mol Reprod Dev 46:109-113.
Umriukhin AE, Diukareva EV, Vetrile LA, Trekova NA, Kravtsov AN, Evseev VA, Sudakov KV (2007) Dynamics of dopamine and norepinephrine contents in the dorsal hippocampus of rats during immunization with dopamine conjugate. Bull Exp Biol Med 143:399-402.
Unwin N (1993) Neurotransmitter action: opening of ligand-gated ion channels. Cell 72 Suppl:31-41.
Venton BJ, Troyer KP, Wightman RM (2002) Response times of carbon fiber
microelectrodes to dynamic changes in catecholamine concentration. Anal Chem 74:539-546.
Wang M, Roman GT, Schultz K, Jennings C, Kennedy RT (2008) Improved temporal resolution for in vivo microdialysis by using segmented flow. Anal Chem 80:5607-5615.
Wightman RM, Amatore C, Engstrom RC, Hale PD, Kristensen EW, Kuhr WG, May LJ (1988) Real-time characterization of dopamine overflow and uptake in the rat striatum. Neuroscience 25:513-523.
Chapter 2
Materials and Methods
Introduction
This chapter explains the primary methods used in the generation of transgenic
mouse models and the analysis of mouse brain slices with electrochemistry. The methods
described here should were used in subsequent chapters unless otherwise noted.
Transgenic Mouse Models
Mice used in this study were age and sex matched whenever possible and handled
via procedures approved by the Institutional Animal Care and Use Committees (IACUC) of
Duke University, Harvard University, the University of Illinois at Urbana Champagne, and the
University of North Carolina at Chapel Hill.
The DAT-Tg mouse models used in this study were created in the lab of Dr. Marc
Caron at Duke University according to the procedure published in Salahpour et al. (2008). A
bacterial vector (BAC) containing the mouse DAT locus was obtained from Genome
Sciences (Duke University, Durham NC). The topology of the BAC was verified using PCR
analysis. A BAC clone was chosen for pronuclear injection containing the DAT locus (40
Kb) flanked by 80 Kb of upstream and downstream genomic homology. The BAC DNA was
buffer (0.03mM Spermine, 0.07mM Spermidine). Pro-nuclear injections were carried out by
the Duke Transgenic Mouse Facility using C57BL/6J embryos. One transgene positive
founder was identified by PCR based genotyping with oligos recognizing BAC vector
sequences (Forward: 5’-gcatcagccagcgcagaaatatttcc, Reverse:
5'-gatacttcgttatcgacaccagctgc-3') and bred for characterization of the transgene.
The synapsin triple knockout (TKO) animals were generated at Duke University in
the lab of Dr. George Augustine. The following procedure for the generation of synapsin
TKO mice and corresponding littermate wild type mice was published in Gitler et al. (2004).
Synapsin TKO mice were generated by serial breeding of synapsin I knockout (KO) mice
(Chin et al., 1995), synapsin II KO mice (Ferreira et al., 1998), and synapsin III KO mice
(Feng et al., 2002). Genotyping of bred animals was done by PCR using sense and
antisense primers for synapsin I, synapsin I/II, and synapsin III. Western blots were used to
confirm the presence or absence of the synapsin proteins. Synapsin TKO mice are on a
mixed genetic background.
Leptin deficient (ob/ob mice) are available for purchase through Jackson
Laboratories (Bar Hardbor, ME.). The ob/ob mice used in these studies were on a C57BL/6
background and were discovered by chance in a colony at Jackson Laboratories. Mice
lacking UCP2 were also generated on a C57 BL/6 background in the lab of Dr. Brad Lowell
at Harvard University using ES cell transfection techniques as previously described (Zhang
et al., 2001). Briefly, a targeted replacement of the Ucp2 gene including a portion of the
start codon was performed using a replacement cassette. Properly transfected ES cells
were injected into mouse blastocysts generating a germline from which WT, heterozygous
UCP2 KOs, and homozygous UCP2 KOs were bred. Successful deletion of UCP2 was
Mice lacking the Fragile X protein gene Fmr1 were generated at the University of
Illinois by William Greenough. They are commercially available through Jackson
Laboratories (Bar Harbor, ME.). A complete discussion of their generation can be found in a
paper from the Dutch Consortium (1994). Briefly, a targeted vector was used to disrupt the
5’ axon of the Fmr1 gene in ES cells. Properly targeted ES cells were selected and injected
into blastocysts from C57BL/6 mice.
Electrochemistry
Cylindrical carbon-fiber microelectrodes (6 µm diameter, Thornel T-650, Amoco,
Greenville, SC) were fabricated as previously described (Bath et al., 2000). Carbon fibers
were aspirated into glass capillary (1.2 mm X 0.68 mm, 4”, AM Systems, Carlsborg, WA.).
The electrodes were pulled on a vertical capillary puller (Narishige) and the excess carbon
fiber was trimmed to 50 µm. Waveform application, current monitoring, and stimulus
application were all controlled by locally written software (Tarheel CV, Labview) through a
home built potentiostat (UEI, UNC electronics shop).
For dopamine and NE detection, the carbon-fiber electrode was held at -400 mV vs.
a Ag/AgCl reference electrode between voltage scans. Detection in brain slices was
achieved by application of a triangular waveform: -400 mV to 1,000 mV to -400 mV at a
scan rate of 600 V/s repeated every 16.7 or 100 ms. This waveform provides high temporal
resolution while maintaining good sensitivity (Bath et al., 2000). The waveform for in vivo
use employed the same voltages, but at 300 V/s and repeated every 100 ms; this method
provides improved sensitivity but decreased time resolution (Baur et al., 1988). The current
at the peak oxidation potential for dopamine (500-700 mV vs. Ag/AgCl) was used to
For 5-HT detection the electrode potential between scans was 200 mV vs Ag/AgCl.
The cyclic voltammogram was obtained with an initial scan to 1,000 mV, back to -100 mV,
and then scanned to 200 mV at 1000 V/s applied every 100 ms. The positive rest potential
minimizes electrode fouling from 5-HT reduction products (Jackson et al., 1995). In addition,
the rapid scan rate prevents side reactions characteristic of the electrochemical detection of
5-HT from contributing to the current signal (Jackson et al., 1995). The positive potential
also decreases the electrode’s sensitivity to dopamine by at least 100 fold. For dopamine,
NE, and 5-HT, the electrodes were calibrated in a flow injection system with a 1 µM bolus of
analyte.
Amperometry experiments were performed using the same equipment as the FSCV
measurements or an Axopatch 200B (Axon Instruments). For biogenic amine
measurements by amperometry, the electrode was held at a potential sufficient for oxidation
(700 mV vs. Ag/AgCl). Ascorbic acid (500 µM) was added to the slice and calibration
buffers to enhance the amperometric signal and allow for calibration of the electrode
(Venton et al., 2002). Amperometric electrodes were calibrated in a flow injection system
against 1 µM dopamine in buffer containing 500 µM ascorbate.
Slice Experiments
Mice were anesthetized with ether and decapitated. The brain was rapidly removed
and placed on ice. Coronal brain slices (300 µm thick) containing the caudate putamen,
substantia nigra pars reticulata (SNr), or the ventral bed nucleus of the stria terminalis
(vBNST), were prepared in ice cold artificial cerebral spinal fluid (aCSF) using a Lancer
Vibratome (World Precision Instruments, Sarasota, Fl.). The aCSF contained (in mM): 20
HEPES, 2.4 CaCl2, 1.2 MgCl2, 1.2 NaH2PO4, 2.45 KCl, 126 NaCl, 11 glucose, and 25
CO2. Slices were superfused in aCSF at 37 oC for 35-40 minutes prior to recording.
Recordings were performed on a microscope (Nikon FN1, Gibraltar Stage) fitted with a slice
perfusion chamber (Warner Instruments, Hamden CT).
Neurotransmitter release was evoked by local electrical stimulation delivered through
a tungsten bipolar stimulating electrode placed on the surface of the slice (Frederick Haer
Co., Bowdoinham, ME). The stimulation consisted of a computer generated, biphasic (2 ms
per phase), constant-current (350 µA) pulse. A single stimulation pulse was used to evoke
striatal dopamine release in the caudate putamen (Jones et al., 1995), a 20 pulse 100 Hz
stimulation train was used to evoke 5-HT release in the SNr (Bunin et al., 1998), and a 60
pulse 60 Hz stimulation was used to evoke NE release in the vBNST (Miles et al., 2002).
The current pulse was optically isolated from the preparation (NL 800, Neurolog, Medical
Systems, Great Neck, NY). Stimulations were performed at regular 3-5 intervals to maintain
consistent release. Neurotransmitter release was detected at a carbon-fiber microelectrode
placed 75-100 µm into the slice at a distance of 100-200 µm from the stimulating electrode.
Electrode placements were made with the aid of the microscope.
To determine the amount of dopamine release in transgenic animals, the maximal
release at 4 locations in a single slice was recorded over a 20 minute period, and the values
were averaged together. The responses from animals of each genotype were pooled. The
amount of 5-HT released was determined in a similar fashion to dopamine with the
exception that three locations were used. A single release site was used for NE
measurements in the vBNST. The number of sites used for each neurotransmitter was
determined based on brain region size and release heterogeneity within that brain region.
Single site recordings were used anytime an experiment required the manipulation of the
slice environment to minimize the contribution of spatial heterogeneity to the measured
changed by manipulation of external ion concentrations or by the application of a drug. An
additional 35 minutes was given if the concentration of external ion or drug was changed.
Some drugs (l-dopa and tetrabenazine) required an incubation time of 1 hour prior to
recording. With the exception of l-dopa (1 hour incubation followed by a 35 minute rinse
with aCSF), all drugs remained in the perfusion buffer for the entirety of the measurement.
Slice experiments utilized two types of background subtraction to remove the large
currents associated with double layer charging that occurs when scanning voltages quickly.
Stimulated dopamine release experiments used traditional digital background subtraction
techniques (Michael et al., 1999). In cases where basal dopamine concentrations were
calculated using principal component regression (reverse transport in Chapter 7), analog
background subtraction was used. Analog background subtraction was performed as
previously described (Hermans et al., 2008). Unless specified, all data was collected using
the traditional digital background subtraction methodology.
Electrochemical Data Analysis
Dopamine release profiles from striatal brain slices were used to quantify the
maximal dopamine release for different animal genotypes. The maximal dopamine released
([DA]max) was determined using an electrode calibration factor and the current recorded at
the oxidation potential of dopamine (650 mV vs. Ag/AgCl). These [DA]max values are
reported as being the value of dopamine release for a particular area or type of animal. The
same technique was used for the neurotransmitters 5-HT and NE whose maximum attained
concentrations were determined from calibrated current traces. Changes in basal dopamine
levels were determined differently than stimulated release by using principal component
regression as described previously (Heien et al., 2004). Briefly, mathematic algorithms were
components were generally limited to dopamine concentration changes, background drift,
and electrode capacitance changes. Removal of components that are not dopamine related
facilitates a more accurate description of dopamine dynamics over long times. This
technique was not used for stimulated release experiments because the time course of
dopamine concentration changes (< 1 sec) was too short for appreciable signal contributions
from factors other than dopamine.
Current responses for a particular animal genotype or brain location were pooled
prior to further data analysis. All data shown are written as mean ± standard error in the
mean (SEM). The n values are the number of animals used for a specific experiment. In
addition to this replicate number, multiple locations and stimulations were used to reduce
random error in the electrochemical measurements. Tests of significance included Student’s
t-test and one way ANOVA where applicable.
Simplex Modeling
Simplex modeling was used to extract kinetic constants associated with the uptake of
dopamine and 5-HT from the extracellular space. Concentration traces were modeled using
a Michaelis-Menten based non-linear regression model (Wightman et al., 1988). For a
dopamine trace, modeling extracts dopamine per pulse (DAp), maximal uptake rate (Vmax),
and transporter affinity for dopamine or 5-HT (Km) values from the trace. Simplex modeling
requires deconvolution of the FSCV signal from the adsorption/desorption time delay by
using an electrode time constant (15-50 ms for a 60 Hz sampling rate). Deconvolution of
the signal for the adsorptive time delay facilitated more accurate modeling of the uptake
kinetics (Venton et al., 2002). When determining Vmax values, the Km value was fixed at 200
nM (Near et al., 1988) for dopamine and 170 nM for 5-HT (John et al., 2006). When
simplex using predrug files for the measurement site. Once Vmax for a particular location
was determined, it was fixed and changes in Km (Km(app)) were accurately measured.
Simplex modeling facilitated the robust and accurate determintation of Michaelis-Menten
uptake kinetics from FSCV measurements (Wu et al., 2001).
Km Determination
The binding affinity of dopamine for the DAT was determined using two methods:
cocaine inhibition and amperometric modeling. Single site measurements were performed
using a 60 Hz collection frequency and a single pulse stimulation in coronal brain slices of
the mouse caudate putamen. A stable baseline of 50 minutes was prerequisite to any drug
application and used to determine an initial Vmax value for the study location. Cocaine was
applied through the superfusion buffer for 35 minutes prior to drug files being recorded. A
linearized curve was generated using ascending concentrations of cocaine (1, 2, 5, 10, 20,
and 30 µM). The curve represented the Km(app) as a function of cocaine concentration. The
y-intercept of the line is the Km(app) without any inhibitor on board which is equivalent to the
original Km. These Km values could be compared for the genotypes in question.
Amperometry was used to directly evaluate the kinetics of dopamine uptake. In this
experiment, Vmax and Km were measured at three locations in the caudate. An initial large
stimulation was used to evoke 2 µM dopamine; the slope of line taken between [DA]max and
½ [DA]max was estimated to be the Vmax value for that location. Once Vmax had been
determined, a smaller stimulation current was used to evoke dopamine release at a
concentration of 400 nM. The resultant curve was modeled with an exponential decay
function which effectively mimics dopamine uptake at low concentrations of dopamine.
Using this function, and the Vmax value obtained for the recording site, a Km value was
High Performance Liquid Chromatography
Tissue samples were dissected from a slice (300-500 µm in thickness) containing the
region of interest. The tissue was weighed and homogenized with a wand sonicator (Fisher
Scientific) in 200-500 µL 0.1 N perchloric acid spiked with 1 µM hydroquinone (HQ) or 1 µM
acetamidophenol (AP). Following centrifugation at 6,000 rpm for 10 min, the supernatant
was removed and filtered with a 0.2 µm syringe filter unit (Millex-LG). Iontophoretic studies
were done by ejecting analytes into a known volume of 0.1 N perchloric acid (Herr et al.,
2008). Injections (10 or 50 µL) were made onto a reverse phase column (C-18, 5 µm, 4.6 x
250 mm, Waters symmetry 300 or Waters Atlantis T3). The mobile phase (prepared in
HPLC grade water) contained 0.1 M citric acid, 0.1 mM EDTA, and 1 mM hexyl sodium
sulfate, pH 3.5. Methanol was added as the organic modifier at a concentration of 5-10 % to
shorten analyte elution times. Catecholamines were detected with a thin-layer radial
electrochemical flowcell (BASi, West Lafayette, IN, USA), with the working electrode at 700
mV vs. a Ag/AgCl reference electrode (BASi, West Lafayette, IN, USA). Catecholamine
standards were prepared from 10 mM stock solutions in 0.1 N perchloric acid. The HQ or
AP (1 µM) was used as an internal standard for analyte quantification and recovery. All
analyte response ratios were taken with respect to the internal standard to account for
differential electrode responses.
Chromatographic Data Analysis
The determination of peak areas for HPLC total content measurements was
performed using custom written Igor programs. These programs were designed in the
Jorgenson lab at UNC-CH. Peak area determination was performed using statistical
moments regression theory (Hsieh and Jorgenson, 1996). The peak area of the analyte
differential detector response. The ratio was then used to calculate a mass of analyte in the
extraction solution which was normalized by the mass of tissue taken. Again, n dictates the
number of animals used; however, replicate extractions and injections were performed to
reduce random error in the chromatographic measurements.
Drugs and Reagents
All drugs were used as received and dissolved in either doubly deionized water or a
mixture of doubly deionized water and ethanol. Cocaine, amphetamine, methamphetamine,
CNQX, picrotoxin, and buproprion were purchased from Sigma Aldrich. The dopamine
uptake blocker PTT was a gift from Dr. F. Ivy Carroll through Dr. Marc Caron. Reagents for
buffers and mobile phases were also purchased from Sigma Aldrich and prepared in doubly
Literature Cited
(1994) Fmr1 knockout mice: a model to study fragile X mental retardation. The Dutch-Belgian Fragile X Consortium. Cell 78:23-33.
Bath BD, Michael DJ, Trafton BJ, Joseph JD, Runnels PL, Wightman RM (2000) Subsecond adsorption and desorption of dopamine at carbon-fiber microelectrodes. Anal Chem 72:5994-6002.
Baur JE, Kristensen EW, May LJ, Wiedemann DJ, Wightman RM (1988) Fast-scan voltammetry of biogenic amines. Anal Chem 60:1268-1272.
Bunin MA, Prioleau C, Mailman RB, Wightman RM (1998) Release and uptake rates of 5-hydroxytryptamine in the dorsal raphe and substantia nigra reticulata of the rat brain. J Neurochem 70:1077-1087.
Chin LS, Li L, Ferreira A, Kosik KS, Greengard P (1995) Impairment of axonal development and of synaptogenesis in hippocampal neurons of synapsin I-deficient mice. Proc Natl Acad Sci U S A 92:9230-9234.
Feng J, Chi P, Blanpied TA, Xu Y, Magarinos AM, Ferreira A, Takahashi RH, Kao HT, McEwen BS, Ryan TA, Augustine GJ, Greengard P (2002) Regulation of neurotransmitter release by synapsin III. J Neurosci 22:4372-4380.
Ferreira A, Chin LS, Li L, Lanier LM, Kosik KS, Greengard P (1998) Distinct roles of synapsin I and synapsin II during neuronal development. Mol Med 4:22-28.
Heien ML, Johnson MA, Wightman RM (2004) Resolving neurotransmitters detected by fast-scan cyclic voltammetry. Anal Chem 76:5697-5704.
Hermans A, Keithley RB, Kita JM, Sombers LA, Wightman RM (2008) Dopamine detection with fast-scan cyclic voltammetry used with analog background subtraction. Anal Chem 80:4040-4048.
Herr NR, Kile BM, Carelli RM, Wightman RM (2008) Electroosmotic flow and its contribution to iontophoretic delivery. Anal Chem 80:8635-8641.
Jackson BP, Dietz SM, Wightman RM (1995) Fast-scan cyclic voltammetry of 5-hydroxytryptamine. Anal Chem 67:1115-1120.
John CE, Budygin EA, Mateo Y, Jones SR (2006) Neurochemical characterization of the release and uptake of dopamine in ventral tegmental area and serotonin in substantia nigra of the mouse. J Neurochem 96:267-282.
Jones SR, Garris PA, Wightman RM (1995) Different effects of cocaine and nomifensine on dopamine uptake in the caudate-putamen and nucleus accumbens. J Pharmacol Exp Ther 274:396-403.
Michael DJ, Joseph JD, Kilpatrick MR, Travis ER, Wightman RM (1999) Improving data acquisition for fast-scan cyclic voltammetry. Anal Chem 71:3941-3947.
Miles PR, Mundorf ML, Wightman RM (2002) Release and uptake of catecholamines in the bed nucleus of the stria terminalis measured in the mouse brain slice. Synapse 44:188-197.
Near JA, Bigelow JC, Wightman RM (1988) Comparison of uptake of dopamine in rat striatal chopped tissue and synaptosomes. J Pharmacol Exp Ther 245:921-927.
Venton BJ, Troyer KP, Wightman RM (2002) Response times of carbon fiber
microelectrodes to dynamic changes in catecholamine concentration. Anal Chem 74:539-546.
Wightman RM, Amatore C, Engstrom RC, Hale PD, Kristensen EW, Kuhr WG, May LJ (1988) Real-time characterization of dopamine overflow and uptake in the rat striatum. Neuroscience 25:513-523.
Wu Q, Reith ME, Wightman RM, Kawagoe KT, Garris PA (2001) Determination of release and uptake parameters from electrically evoked dopamine dynamics measured by real-time voltammetry. J Neurosci Methods 112:119-133.
Chapter 3
Synapsins and Dopamine Release
Introduction
Synapsins are phosphoproteins that bind to the cytosolic surface of synaptic vesicles
and represent almost 10% of the total protein content of synaptic vesicles. There are three
synapsins genes (synapsin I, II, and III), with alternative splicing creating 10 known synapsin
isoforms. They are differentially expressed in nerve terminals, with synapsins I and II
predominant in most areas of the adult brain, although synapsin III is present in some
regions including the dorsolateral striatum (Pieribone et al., 2002). Synapsins are thought to
play a role in segregating vesicles into a reserve pool that is located away from the active
zone, where exocytosis occurs (Greengard et al., 1993). Early evidence supporting this
proposal include observations that perturbing synapsins by microinjection disrupts a distal,
reserve pool of vesicles, while sparing vesicles in the active zone (Pieribone et al., 1995). It
is thought that mobilization of vesicles from the reserve pool is triggered by the elevation of
presynaptic calcium resulting in phosphorylation of synapsins (Llinas et al., 1991; Greengard
et al., 1993; Chi et al., 2003). More recent evidence has shown that synapsins are also
important regulators of exocytosis, vesicle recycling, and vesicle integrity at the active zone;
furthermore, these actions differ depending on the type of neurotransmitter terminal (Fdez


![Figure 3.4 Calcium dependence of dopamine release in striatal slices. A) Relative [DA] max](https://thumb-us.123doks.com/thumbv2/123dok_us/8322841.2206364/66.918.230.695.124.902/figure-calcium-dependence-dopamine-release-striatal-slices-relative.webp)

