ESSAYS ON HIGHER EDUCATION IN THE UNITED STATES:
THE EFFECTS OF CONTEMPORARY STATE- AND INSTITUTION-LEVEL POLICIES ON STUDENT OUTCOMES
Nicole Marie Voss Ross
A dissertation submitted to the faculty at the University of North Carolina at Chapel Hill in partial fulfillment of the requirements for the degree of Doctor of Philosophy in the Department of Public
Policy in the College of Arts and Sciences.
Chapel Hill 2019
ii
Ó 2019
iii
ABSTRACT
Nicole Marie Voss Ross: Essays on higher education in the United States: The effects of contemporary state- and institution-level policies on student outcomes
(Under the direction of Steven W. Hemelt)
This dissertation investigates the role of contemporary state- and institution-level policies in public higher education in the United States. In Chapter 1, I examine the effect of earning college credit in a statewide dual credit course on student postsecondary enrollment and early performance outcomes. I find that banking college credit in high school increases the probability that a student enrolls in college within a year of high school graduation by approximately 5 percentage points. This effect is driven by the boost in the likelihood of postsecondary enrollment at public two-year
institutions for passers of career-related, technical courses (e.g., Plant Science). However, I find little evidence that banking college credit improves measures of early college performance along the dimensions of credit accumulation, GPA, or remediation.
Chapter 2 utilizes student-level data from four public four-year institutions in North Carolina to characterize whichstudents tend to be most impacted by tuition surcharge policies. Moreover, I observe how more intermediate early college behaviors and performance measures (e.g., major choice, credit accumulation, etc.) influence the likelihood a student may eventually be assessed the surcharge. I find that compared to their otherwise similar peers, black and Hispanic males with lower measures of pre-college achievement are more likely to be assessed the surcharge. Students who eventually hit the surcharge are also much more likely to major in a STEM (Science,
iv
Last, in Chapter 3, I examine how the share of nonresident (i.e., foreign-born and out-of-state) students on public, in-state campuses affects institutional spending priorities. I employ an instrumental variables approach to isolate exogenous variation in nonresident enrollment. I find that the practical, economic effect that nonresident students have on public university spending behavior is extremely small, and often negligible. I find no effect of nonresident enrollment on total spending per FTE, suggesting that many public institutions are in fact using the additional revenues generated from nonresident tuition and fees to fill in revenue shortfalls resulting from diminished state
v
vi
ACKNOWLEDGEMENTS
I would like to thank individuals at the Tennessee Department of Education and
MeasureTN for their data assistance, support, and willingness to answer questions of all types over the course of five years. Jonathon Attridge, Lacey Hartigan, Caroline Martin, Tandra Martin, Emily Pratt, Nate Schwartz, and Patrice Watson made Chapter 1 of this dissertation possible.
I would also like to thank Chris Derickson, former University Register at the University of North Carolina at Chapel Hill, for supporting and facilitating earlier dissertation research ideas and for providing invaluable contextual information about UNC’s tuition surcharge policy. Thanks also to Dan Cohen-Vogel and Catherine Zomberg at the University of North Carolina’s General Administration Data & Analytics division. They provided the data necessary for Chapter 2 and thoroughly answered any clarifying questions I had along the way.
vii
TABLE OF CONTENTS
LIST OF TABLES ... xii
LIST OF FIGURES ... xv
LIST OF ABBREVIATIONS ... xvii
INTRODUCTION ... 1
CHAPTER 1: BANKING ON DUAL CREDIT: EARNING COLLEGE CREDIT IN HIGH SCHOOL AND EARLY POSTSECONDARY PERFORMANCE OF TABLES.... 6
1. Introduction... 6
2. Background literature ... 10
2.1 Theoretical rationale of credit-based transition programs ... 10
2.2 Dual credit, dual enrollment, and postsecondary outcomes of credit- Based transition programs ... 12
2.3 Advanced Placement versus Dual Credit ... 15
3. Tennessee’s Statewide Dual Credit policy context ... 18
4. Data ... 23
4.1 Analytic sample generation... 23
4.2 Summary statistics ... 27
5. Empirical approach ... 31
5.1 Regression discontinuity estimation ... 31
5.2 Exploration of RD assumptions... 33
5.3 Limitations ... 37
viii
6.1 First-year college enrollment ... 38
6.1.1 Full analytic sample... 38
6.1.2 SDC subgroups ... 42
6.2 First-year college choice ... 43
6.2.1 Full analytic sample... 43
6.2.2 SDC subgroups ... 44
6.3 First-year college performance... 47
6.3.1 Full analytic sample... 47
6.3.2 SDC subgroups ... 50
6.4 Second-year college enrollment and choice, student persistence ... 54
6.5 Second-year college performance ... 56
7. Additional regression models ... 59
7.1 Demographic subgroups ... 59
7.1.1 Expected graduation year ... 60
7.1.2 Gender ... 62
7.2 Placebo cut scores... 63
8. Discussion ... 63
9. Tables ... 70
10. Figures ... 87
CHAPTER 2: EXCESS CREDIT HOUR POLICIES AT NORTH CAROLINA INSTITUTIONS: WHO PAYS THE SURCHARGE? ... 97
1. Introduction... 87
2. Background literature ... 103
2.1 Tuition, completion, and time-to-degree ... 103
ix
2.3 Excess credit hour policies ... 105
3. North Carolina tuition surcharge policy ... 109
4. Data and analytic sample ... 112
4.1 Data... 112
4.2 Analytic sample institutions and all UNC system institutions ... 115
4.3 Identifying surcharge students and relevant comparison groups ... 116
4.4 Surcharge, Delayed, Typical, and Accumulator students ... 120
5. Which students are assessed the tuition surcharge? ... 122
5.1 How do surcharge students compare to those in other groups? ... 122
5.2 What demographic characteristics are predictive of being assessed the surcharge? ... 128
6. How do the early college experiences of surcharge students differ from their peers? ... 131
6.1 Enrollment patterns, stopping out, and sample attrition ... 131
6.2 Attempted credit accumulation ... 136
6.2.1 Cumulative surcharge-relevant hours ... 136
6.2.2 Cumulative summer and extension attempted credit hours ... 139
6.3 Earned credit accumulation... 142
6.4 Choice of major ... 144
6.4.1 First declared major, last declared major, and degree... 145
6.4.2 Temporal major choice and switching ... 149
6.5 Course performance ... 157
6.5.1 Summative course performance ... 158
6.5.2 Temporal variation in failing, repeating, and withdrawing from courses ... 160
6.6 Financial aid ... 163
x
8. Limitations ... 172
9. Discussion ... 174
10. Tables ... 180
11. Figures ... 197
CHAPTER 3: NONRESIDENT ENROLLMENT AND INSTITUTIONAL SPENDING: HOW DOES THE INCREASED SHARE OF NONRESIDENT STUDENTS CHANGE INSTITUTIONAL SPENDING? ... 213
1. Introduction... 213
2. Background literature ... 218
2.1 Demand for nonresidents ... 218
2.2 Academic value, consumption value, and institutional resources ... 220
2.3 Institutional spending and college outcomes... 222
2.4 Conceptual framework ... 222
3. Empirical approach and data ... 224
3.1 Empirical framework... 224
3.2 Data and variables... 226
4. Instrumental variables identification strategy ... 230
4.1 Initial instruments: Cap on nonresident enrollment ... 231
4.2 Additional instruments: Merit aid expenditure in other states ... 234
4.3 Assessing instrument validity ... 236
4.3.1 Monotonicity ... 237
4.3.2 Relevance... 237
4.3.3 Independence ... 240
4.3.4 Exclusion restriction ... 242
xi
5.1 Reduced form estimates... 245
5.2 The effect of nonresident enrollment on university expenditure behavior ... 247
5.3 Heterogeneity by institution type ... 251
6. Robustness checks ... 254
6.1 Alternative instruments ... 254
6.2 Alternative specifications and samples ... 257
7. Discussion ... 260
8. Tables ... 265
9. Figures ... 279
APPENDIX 1 ... 281
APPENDIX 2 ... 282
APPENDIX 3 ... 284
xii
LIST OF TABLES
Table 1.1 – Statewide Dual Credit course and challenge exam implementation ... 70
Table 1.2 – SDC challenge exam pass rates overall and by year, full analytic sample ... 71
Table 1.3 – Summary statistics, Full sample and SDC course subgroups ... 72
Table 1.4 – Effects of passing challenge exam on postsecondary enrollment, Full sample ... 74
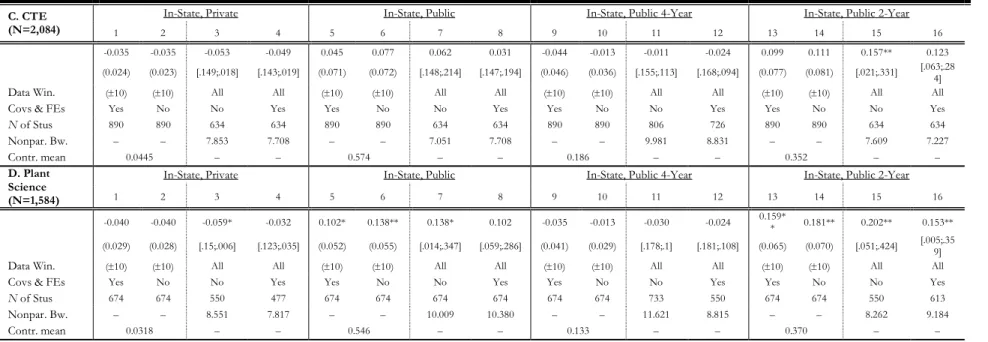
Table 1.5 – Effect of passing challenge exam on postsecondary enrollment, by SDC course subject ... 75
Table 1.6 – Effects of passing challenge exam on college choice, Full sample ... 76
Table 1.7 – Effects of passing challenge exam on Tennessee college choice, By SDC subgroup ... 78
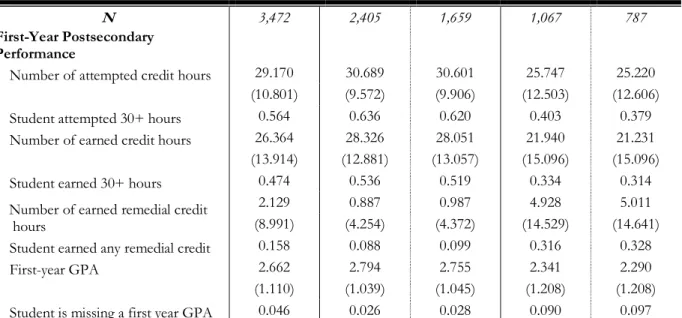
Table 1.8 – Effects of passing challenge exam on first-year college performance, Full THEC sample (n=3,472) ... 80
Table 1.9 – Effects of passing challenge exam on first-year credits attempted And credits earned, by THEC SDC subgroup ... 82
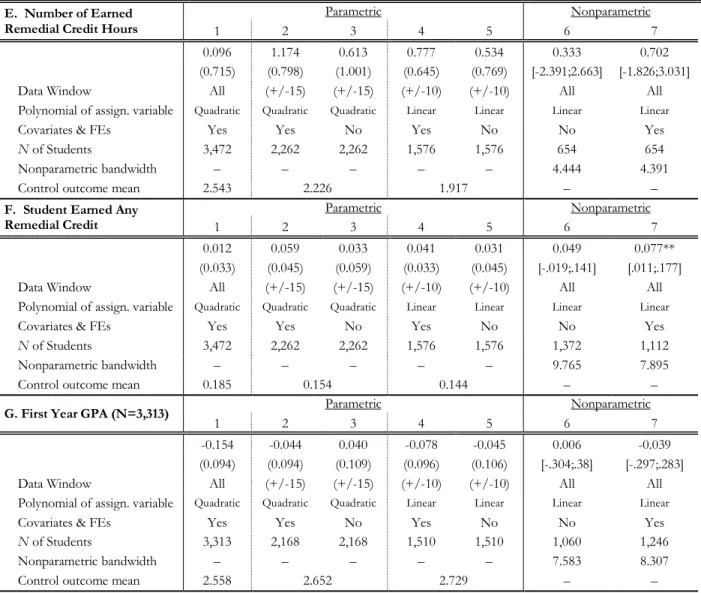
Table 1.10 – Effects of passing challenge exam on first-year remedial credits And GPA, by THEC SDC subgroup ... 83
Table 1.11 – Effects of passing challenge exam on postsecondary enrollment within two years of expected high school graduation year ... 84
Table 1.12 – Effects of passing challenge exam on credits attempted and earned by the end of the second year, by THEC SDC subgroup ... 85
Table 1.13 – Effects of passing challenge exam on remedial credits and GPA by the end of the second year, by THEC SDC subgroup ... 86
Table 2.1 – Institutional comparison along key dimensions ... 180
Table 2.2 – Original student counts by institution and entering cohort in UNC-GA data ... 181
Table 2.3 – Analytic sample student counts by institution and entering cohort in UNC-GA data .. 181
Table 2.4 – Total hours attempted and total terms by credit-term group ... 182
Table 2.5 – Summary statistics of static student-level measures, by credit-term group ... 183
xiii
Table 2.7 – What baseline demographic characteristics predict Surcharge status? ... 185
Table 2.8 – Summary of first major, last major, and earned degree, Freshmen ... 186
Table 2.9 – Summary of major switching behavior, Freshmen ... 187
Table 2.10 – Summary of course performance, Freshmen ... 188
Table 2.11 – Summary of financial aid, Freshmen and Transfers ... 189
Table 2.12 – What predicts surcharge incidence? Full Sample ... 190
Table 2.13 – What predicts surcharge incidence? Freshmen ... 192
Table 2.14 – Surcharge student finances: excess credit hours, financial aid, and the surcharge burden ... 194
Table 3.1 – Expenditure categories ... 265
Table 3.2 – Summary statistics ... 266
Table 3.3 – Nonresident enrollment caps by state and year ... 267
Table 3.4 – Relevance of the instrument: First-stage estimates with different instruments ... 269
Table 3.5 – Reduced form estimates with different expenditure outcomes ... 270
Table 3.6 – The effect of nonresident enrollment on total institution expenditures... 271
Table 3.7 – The effect of nonresident enrollment on expenditures ... 272
Table 3.8 – Interaction model: relevance of the instrument, First-stage estimates with different instruments, by AAU status ... 273
Table 3.9 – Interaction model: reduced form estimates with different expenditure outcomes and !1#$% instrument only, by AAU status ... 274
Table 3.10 – Interaction model: The effect of nonresident enrollment on expenditures, by AAU status ... 275
Table 3.11 – Robustness of findings to alternative instruments, First-stage and Second-stage... 277
Table 3.12 – Robustness of findings to to alternative specifications and samples, Second-stage ... 278
Table 1.1A – SDC challenge exam pass rates overall and by year, Full Sample ... 281
xiv
xv
LIST OF FIGURES
Figure 1.1 – Number of SDC exam takers and exam passers in each
Tennessee county, Math and CTE ... 87
Figure 1.2 – McCrary test for the Full Sample, Math, and CTE ... 88
Figure 1.3 – Covariate balance in Algebra I EOC and White, non-Hispanic for Full Sample, Math, and CTE ... 89
Figure 1.4 – Probability of enrolling in any college within a year of expected high school graduation, Full Sample ... 90
Figure 1.5 – Probability of enrolling in any college within a year of expected high school graduation, SDC subgroups ... 91
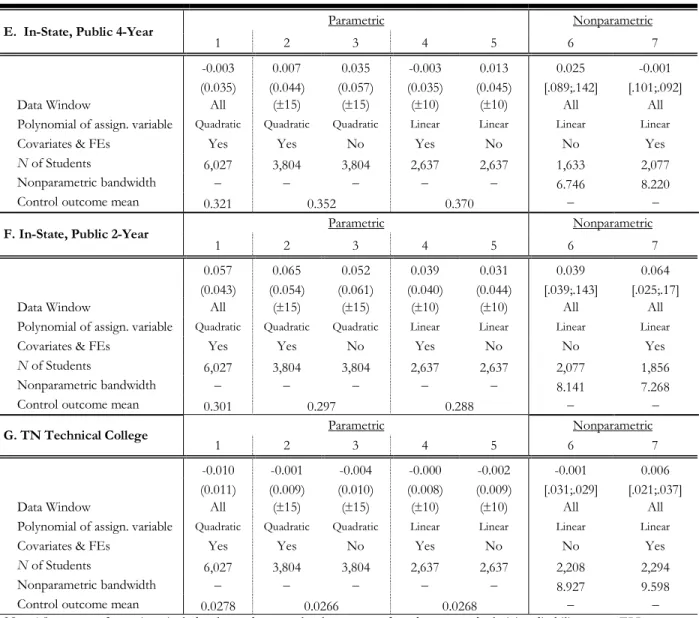
Figure 1.6 – Probability of enrolling at an in-state, public institution within a year of expected high school graduation ... 92
Figure 1.7 – Probability of enrolling at an in-state, public within a year of expected high school graduation, by SDC course subgroup ... 93
Figure 1.8 – First-year college performance, by THEC SDC course subgroup ... 94
Figure 1.9 – Probability of enrolling in college within two years of expected high school graduation, Math and CTE ... 95
Figure 1.0 – Second-year college performance, by THEC SDC course subgroup ... 96
Figure 2.1 – Number of students assessed a tuition surcharge by term, Fall 2007 through Spring 2012 ... 196
Figure 2.2 – Cohort progression and surcharge rate ... 196
Figure 2.3 – Distribution of students, grouped by attempted credit hours and total terms ... 197
Figure 2.4 – Share of students in each group who are _____ ... 197
Figure 2.5 – Cumulative number of times that students stop out by term and group ... 198
Figure 2.6 – Enrollment, graduation, and leaving patterns by term and group... 199
Figure 2.7 – Surcharge-relevant attempted hours and the accumulation patterns by term and group ... 200
xvi
Figure 2.9 – Extension attempted hours and the accumulation patterns by term and group ... 202
Figure 2.10 – Ratio of cumulative credits earned to cumulative credits attempted accumulation patterns by term and group ... 203
Figure 2.11 – Share of freshmen whose ____ is in the field of ____ ... 204
Figure 2.12 – Share of freshmen who have switched their major at some point by term ... 205
Figure 2.13 – Cumulative number of times freshmen switched majors by term ... 205
Figure 2.14 – Share of freshmen who are undeclared ... 205
Figure 2.15 – Share of freshmen majoring in stem and non-stem by term and group ... 206
Figure 2.16 – Cumulative share of freshmen moving into and out of stem majors by term and group ... 206
Figure 2.17 – Share of freshmen majoring in key fields with unadjusted and adjusted differences in shares compared to Delayed students ... 207
Figure 2.18 – Ratio of cumulative number of times freshmen fail, repeat, or withdraw from a course relative to the cumulative number of credits they have attempted by term and group ... 209
Figure 2.19 – Ratio of cumulative number of times freshmen fail, repeat, or withdraw from a course in STEM, while a STEM major, relative to the cumulative number of credits they have attempted by term and group ... 209
Figure 2.20 – ratio of cumulative number of times freshmen fail, repeat, Or withdraw from a course as it aligns with their declared major Relative to the cumulative number of credits they have attempted by term and group... 210
Figure 2.21 – Share of freshmen applying for FAFSA by term and group along with unadjusted and adjusted differences ... 211
Figure 2.22 – Share of freshmen receiving financial aid and the cumulative Aid received to cumulative credits attempted by term and group ... 211
Figure 3.1 – Share nonresident versus state appropriations per FTE... 279
Figure 3.2 – Mean share of total spending in key expenditure categories ... 279
xvii
LIST OF ABBREVIATIONS
AAU American Association of Universities ACT American College Test
AP Advanced Placement
ASC American Survey of Colleges BA Bachelor of Arts (degree) CTE Career and Technical Education DD Difference-in-differences (model) ECH Excess Credit Hour
ECU East Carolina University EOC End-of-Course
FAFSA Federal Application for Federal Student Aid FE Fixed Effects (model)
FRD Fiscal Research Division FTE Full-time Equivalent (student) GPA Grade Point Average
IV Instrumental Variables (model)
IPEDS Integrated Postsecondary Education Database System NASSGAP National Association of State Student Grant & Aid Programs NCA&T North Carolina Agricultural and Technical State University NCES National Center for Education Statistics
xviii NIH National Institutes of Health
RD Regression Discontinuity (model) SAT Scholastic Aptitude Test
SDC Statewide Dual Credit SES Socioeconomic status
STEM Science, Technology, Engineering, and Mathematics TDOE Tennessee Department of Education
THEC Tennessee Higher Education Commission
TN Tennessee
UNC University of North Carolina
UNC-GA University of North Carolina General Administration UNCC University of North Carolina – Charlotte
UNCCH University of North Carolina – Chapel Hill
INTRODUCTION
This dissertation investigates the role of contemporary state- and institution-level policies in public higher education in the United States. Across three chapters, each focused on a specific policy and context, this dissertation broadly explores the effects that these policies have on college
enrollment and performance in the modern era. In the context of this body of work, contemporary
refers to secular trends occurring post 2000, and especially after the Great Recession (2007-2009). This contemporary postsecondary era is characterized by declining state appropriations, rising tuition costs and student debt, flat-lining college completion rates, and increased time-to-degree (Kane, Orszag, Apostolov, Inman, & Reschovsky, 2005; Bound, Lovenheim, & Turner, 2012). Public institutions and the state agencies that run them have worked to cope with and ameliorate these challenges in a multitude of ways, while also trying to ensure a college education remains accessible and attainable for an increasingly diverse set of college enrollees.
In Chapter 1, I examine the effect of earning college credit in a statewide dual credit course on student postsecondary enrollment and early performance outcomes. Dual credit programs deliver college-level content within a high school setting and provide the potential for students to earn both high school and college credit in a single course instance. Proponents argue that exposure to
rigorous college-level content and the opportunity to earn college credits before setting foot on a college campus help smooth the transition from the secondary to postsecondary realm. While past work has largely explored the total effect of participating in a dual-credit course on college
programs on a range of early postsecondary outcomes. I employ a regression discontinuity design that exploits exam cut score criteria, whereby dual-credit participants who score at or above a certain score percentage “bank,” or retain, three college credits that can be transcripted at any public
Tennessee postsecondary institution upon enrollment.
I find that banking college credit in high school increases the probability that a student enrolls in college within a year of high school graduation by approximately 5 percentage points. This effect is driven by the boost in the likelihood of postsecondary enrollment at public two-year
institutions for passers of career-related, technical courses (e.g., Plant Science). However, I find little evidence that banking college credit improves measures of early college performance along the dimensions of credit accumulation, GPA, or remediation. In fact, I find that barely passers of math subject exams (e.g., College Algebra) both attempt and earn fewer credits than their barely failing peers, rising to a gap of roughly 3 earned credits within two years of expected high school graduation. Math exam passers are also more likely to earn lower cumulative GPAs and obtain remedial credit hours than their otherwise similar peers who fail to bank college credit. Taken altogether, the findings of this chapter highlight the potential for unintended consequences for earning college credit while in high school, such as reduced credit loads and underperformance once in college. They also raise important questions about the appropriate placement of cut scores used to certify college credit, as well as questions about the steps that students must take in order to ensure that their banked college credits are officially transcribed once setting foot on a college campus.
from 20% to 100% of tuition) for credits taken beyond a predetermined cutoff, ranging from between 110 and 150 percent of a degree’s usual required credits. Prior work using institution-level data (Kramer, Holcomb, & Kelchen, 2018) found that these policies failed to bolster degree
attainment or curtail time-to-degree; however, but increased median student debt, shifting the costs of education from the state to the college attendee. This paper complements the work of Kramer and colleagues by utilizing student-level data from four public four-year institutions in North Carolina to characterize which students tend to be most impacted by tuition surcharge policies. Moreover, I observe how more intermediate early college behaviors and performance measures (e.g., major choice, credit accumulation, etc.) influence the likelihood a student may eventually be assessed the surcharge.
I find that compared to their otherwise similar peers, black and Hispanic males with lower measures of pre-college achievement (e.g., high school GPA, SAT score) are more likely to be assessed the surcharge. Students who eventually hit the surcharge are also much more likely to major in a STEM (Science, Technology, Engineering, & Math) field, particularly engineering, and are more likely to formally commit to a degree path at later point in college. Still, whether in a STEM major or not, surcharge students attempt fewer per-term credit hours and fail to earn credits at the rate of their peers, even with a comparatively lower course load each term. Meanwhile, they are much more likely to finance their education with federal grant aid, an indication that they may be economically more disadvantaged than many of their peers. In many ways, the types of students
whether the policy is working as intended, especially with respect to the types of students that the surcharge is most likely to affect.
Finally, in Chapter 3, I expand my focus beyond the singular state level to focus on trends affecting four-year public colleges and universities across the US. I examine how the share of nonresident (i.e., foreign-born and out-of-state) students on public, in-state campuses affects institutional spending priorities. The growth in nonresident enrollment at public institutions has coincided with the substantial decline in state appropriations over this same period of time, especially after the recessions of 2001 and 2008 (Baum, Ma, Bell, & Elliott, 2014). An emerging concern, documented mostly in the popular press, is that the growing presence of nonresident students on public campuses shifts the funding priorities of public institutions away from education- and access-focused efforts towards ancillary amenities (e.g., lazy rivers, world-class dining) meant to attract and retain these higher-paying, out-of-state students. Due to issues of simultaneity and reverse causality embedded in the relationship between nonresident enrollment and institution expenditure behavior, I employ an instrumental variables (IV) approach to isolate exogenous variation in nonresident enrollment. Using data from the Integrated Education Postsecondary Database System (IPEDS) between 2002 and 2015, I examine the effect of the growing share of nonresident students at research-focused public four-year institutions on institutional spending behavior.
decreasing the share of spending they put towards spending on research activities and scholarships and fellowships. Nevertheless, despite the statistical significance of some of the effects, the practical effect of nonresident enrollment on institutional spending patterns is extremely small financially. I also fail to detect a relationship between the share of nonresidents and spending patterns on student services and auxiliary enterprises, often considered “consumption amenities” in prior literature. These findings suggest the anecdotes conveyed in the popular press and by concerned in-state constituents may be overhyped. It still remains an important calling for future research to look at the levers responsible for shifting institutional spending; however, the residency status of public
CHAPTER 1: BANKING ON DUAL CREDIT: EARNING COLLEGE CREDIT IN HIGH SCHOOL AND EARLY POSTSECONDARY PERFORMANCE
1. Introduction
Despite college aspirations and enrollment rates increasing steadily over the last several decades, college completion rates have plateaued and median time-to-degree has lengthened over this same period (Bowen, Chingos, & McPherson, 2009; Bound, Lovenheim, & Turner, 2010). Over three quarters of high school students expect to achieve a four-year degree or higher, yet only about a third are successful in attaining one (Goyette, 2008). For many students, the hurdles separating their degree ambitions from their attainment begin as soon as they enter college.
Remedial coursework is common, with nearly 50 percent of students required to take remedial classes (with nearly 70 percent at community colleges). Even among those who’ve taken the recommended college preparatory high school courses, remediation rates are around 40 percent (NCES, 2012). In addition, attrition remains relatively high. Roughly 30 percent of students who begin school will not return after the first year (Schneider, 2010). These statistics suggest that many high school students are not adequately prepared for the academic rigor of college.
Concerns about early college performance have led a variety of stakeholders, from researchers to policymakers and practitioners, to devise initiatives that help bridge the curricular divide between secondary and postsecondary institutions. These initiatives are in contrast to remedial coursework interventions, which have historically been the primary method that postsecondary institutions have attempted to ameliorate perceived deficiencies in academic
students at the margin of passing out of remediation (Calcagno & Long, 2008; Boatman & Long,
2011; Martorell & McFarlin, 2011; Scott-Clayton & Rodriguez, 2015). A reasonable explanation for
these discouraging findings is that college is too late to address issues of under-preparedness.
As an alternate approach, policy efforts have shifted towards engaging students much earlier, especially while still in high school, as a way to ease the scholastic disjuncture between high school and college (Kirst & Venezia, 2004; Venezia, Kirst, & Antonio, 2003). Though taking different forms, these initiatives serve a common purpose of aligning standards, objectives, and information between the K-12 and postsecondary realms. As the most robust example, some states have adopted K-16 or pre-K-20 reforms that explicitly coordinate educational aims between education sectors – though these aims and their scope vary widely between states (Venezia et al., 2005).
Credit-based transition programs1 are another enterprise meant to expose students to
college-level material and expectations in high school as preparation for the next academic stage (Bailey & Karp, 2003). Advanced Placement (AP) and dual credit2 initiatives represent well-known
examples of these programs, which allow students to participate in rigorous, college-level courses while in high school, earning high school credit and potentially college credit as well. These programs continue to expand in number across the US, with 69 percent of public high schools offering AP courses and 82 percent offering dual credit courses in the 2010-11 year (NCES, 2013). In that year, around 3.5 million students enrolled in AP courses and over 1 million in dual credit.
Dual credit programs, in particular, have been billed by advocates as a promising way to bridge the high school-to-college divide for a broader set of students, including those traditionally
1 The programs also go by the name “accelerated learning options” (Hoffman, Vargas, & Santos, 2009) and “secondary-postsecondary learning options” (Lerner & Brand, 2006).
underrepresented in higher education. Proponents hypothesize that dual credit can improve
students’ postsecondary enrollment and success through several avenues. They argue that dual credit can improve students’ academic preparedness for college work as well as partially alleviate their cost burden. Moreover, exposure to dual credit can provide students with tangible information about the college experience; this knowledge may improve student expectations of – and perhaps motivation to pursue – postsecondary work (Bailey & Karp, 2003; Borden et al., 2013).
Yet, despite the continued expansion of dual credit and its proposed merits, there is sparse evidence establishing a clear relationship between dual credit policies and student postsecondary outcomes. Critics also point to the challenges of policing course quality. Moreover, prior literature has not investigated the nuances of student dual credit experiences – namely, whether effects vary between those dual credit participants who only obtain high school credit and those participants who obtain both high school and college credit. As an exception, Smith, Hurwitz, & Avery (2017) do investigate the effect of accruing college credits through AP exam performance. However, dual credit programs – the focus of this paper – often target or attract different types of students. Considering that the mechanisms through which dual credit theoretically influence postsecondary outcomes – academic readiness, motivation, and financial savings – may relate to college credit accrual, the distinction between participants who earn college credit and those who do not may be meaningful.
exposed to any theoretical treatment effects gained by exposure to college-level material, only exam passers earn three college credits that they “bank”, or retain, until they enroll in college where this credit is formally transcripted. This paper focuses on this credit-bearing dimension of dual credit, probing how it shapes the early postsecondary experiences of dual credit participants.
I examine the effects of banking credit within a pooled sample of exam records that includes scores across seven different dual credit courses, as well as in a couple of key subject and course subgroups separately (e.g., Math courses, career and technical education (CTE) courses). I find that passing a challenge exam boosts college enrollment within one year of a student’s expected high school graduation by about 5 percentage points. This full sample effect is primarily due to the fact that passers of CTE exams – and especially Plant Science – are more likely enroll in college than their barely failing peers, and especially at in-state, public two-year institutions. Passing a challenge exam boosts Plant Science student enrollment in Tennessee two-years by 16-18 percentage points. Meanwhile, there is some evidence that Math students who miss banking college credit by 1-6 percentage points are discouraged from enrolling in a postsecondary institution within the year following high school graduation.
The findings for Math, in particular, highlight the potential unintended consequences of Tennessee’s statewide dual credit policy that awards college credit based on cut score criteria. Right around the passing threshold, barely failers and barely passers in Math were equally likely to shift their enrollment away from in-state, public two-year colleges to in-state, public four-year colleges instead. At these more academically demanding institutions, passers may have been able to capitalize on their banked credit in ways their barely failing peers were not – either by applying this credit towards college graduation requirements or responding to the positive signal of passing by tackling more challenging coursework. Either way, the fact that passers earn fewer credits and lower GPAs than their barely failing peers suggests that whatever behavioral changes they made in response to banking college credit culminated with them being academically behind their barely failing peers, who scored slightly lower on the challenge exam and did not merit credit.
The findings of this paper also underscore the importance of considering dual credit not as one singular policy, but as a collection of course offerings that not only teach different content, but attract different participants, and therefore may affect the postsecondary performance of passers in disparate ways. The rest of the paper is organized as follows: Section two discusses relevant
background literature, while Section three provides contextual details of Tennessee’s statewide dual credit policy. Section four describes how I generated my analytic sample, and Section five addresses the internal validity of my RD empirical approach. Section six presents findings, Section seven discusses additional analyses, and Section eight discusses the implications of the findings.
2. Background literature
2.1 Theoretical rationale of credit-based transition programs
students by addressing academic preparedness, informational, and financial and barriers (Borden at al., 2013). Scholastically, these courses reflect the challenging content and high expectations of college a classroom, giving a student advantageous experience with rigorous coursework before entering college. This exposure is valuable considering that intensity of a student’s high school curriculum is predictive of college enrollment (Long, Conger, & Iatarola, 2012) and remains one of the strongest predictors of bachelor degree attainment (Adelman 1999; 2006).
Engaging with rigorous course material and assignments can bolster preparedness by informing students of their academic abilities and how they may expect to fare in a college classroom (Bailey & Karp, 2003). Having this information prior to enrolling in college allows students to make changes to their college preparatory behavior in ways that may prove beneficial later. For example, dual credit students may add (or subtract) additional advanced courses in their schedules, register for college entrance exams like the SAT or ACT, or seek tutoring or mentoring assistance in response to their dual credit course experience. These actions may reduce the likelihood of requiring remediation and may help build a strong academic foundation for postsecondary study.
transparent, quality information about the postsecondary landscape (Venezia, Kirst, & Antonio, 2003; Hoxby & Avery, 2013; Avery, Howell, & Page, 2014).
Finally, these programs may also benefit students from a financial standpoint by allowing them to earn college credit while still in high school. Early credit accumulation may shorten overall time-to-degree and potentially reduce the cost of education. Accruing college credits earlier may also increase the likelihood a student graduates from college, making the financial commitment to pursue a degree worthwhile. Adelman (1999; 2006) finds that meaningful credit accumulation (at least 20) by the end of the first year significantly improves the likelihood a student graduates from college. These credits may serve as a “nest egg”, helping provide academic and psychological momentum to continue progressing towards a degree (Swanson, 2008; An, 2013).
2.2 Dual credit, dual enrollment, and postsecondary outcomes
Despite the recent expansion of dual credit programs, little causal evidence exists that delineates a clear relationship between participation in dual credit and later postsecondary outcomes. Several studies have examined how participation in dual enrollment courses impacts postsecondary outcomes. Unlike dual credit, dual enrollment courses typically represent instances where a high school student is concurrently enrolled in high school and a postsecondary institution, and where that student takes a college course delivered by a college faculty member at the latter.
However, the relationships noted above are often drawn from correlational studies or regression analyses that control for key observable characteristics, but are unable to adequately account for the issue of selection bias. Selection bias can arise as academically motivated students selecting into taking early postsecondary courses like dual enrollment (or dual credit). These students may differ from non-participants in ways unobservable to researchers. Selection is also a problem if students with already high college ambitions and preparedness see dual enrollment as an opportunity to get a head start (i.e., a nest egg) for college. The decision to honor college credit earned in high school is most often determined by the postsecondary institution a student matriculates at; and college-bound students may be more likely to attend institutions accepting of credit. In any case, selection appears as a spurious, positive correlation between participation and postsecondary outcomes. On a final note, though the evidence from these studies suggests dual enrollment has a non-negligible impact on the extensive margin of college-going (whether students are more likely to enroll), the evidence that it improves outcomes along the intensive margin (how they perform in college in terms of GPA, credit accumulation, or completion) is much weaker (What Works Clearinghouse, 2017).
In one of few quasi-experimental studies conducted, Speroni (2011b) exploits eligibility criteria cutoffs for dual enrollment in Florida. Using a RD design that examines student outcomes around the 3.0 GPA cutoff, she does not find evidence that simply taking dual enrollment
impact of dual enrollment and dual credit courses separately by subject because effects may vary depending on the difficulty, content, and standards of a course.
Like Speroni, An (2013) also examines the impact of dual enrollment – as opposed to dual credit – on a postsecondary outcomes. Using propensity score matching, he compares college students who did and did not take dual enrollment courses, controlling for observable differences between groups. He finds a positive effect of dual enrollment on bachelor’s (BA) degree attainment, and especially large effects for low-income students. Still, these estimates are likely biased upwards due to positive selection of students into dual enrollment who differ from non-enrollees on a number of non-observable attributes that also predict postsecondary performance (and propensity score matching cannot account for). An does conduct a simulation exercise to test the sensitivity of his estimates to the presence unobserved confounders, though this additional analysis still makes important assumptions about the relationship of potential confounders to the college outcomes of interest. Further limiting is the fact that An’s analytic sample contains initial college enrollees. Thus, he is unable to examine the influence of dual enrollment on college enrollment or college choice – both factors that influence the composition of college enrollees and their subsequent progress in college.
2.3 Advanced Placement versus Dual Credit
The extent to which credit-based transition programs are successful in reducing barriers to college depends upon the features of each program and the students they serve. In these ways, AP and dual credit tend to differ, and are thus often regarded as distinct curricular acceleration strategies with the potential to differentially benefit particular groups of students (Karp, 2015; An, 2013;
Speroni, 2011a). Administered nationally by the College Board, AP courses are taught by high school teachers who are specially trained to deliver standardized curriculum in a particular course intended to be college-level in intensity. In order to receive college credit, an AP student must take the optional exam at the end of the course and receive a passing score, which is typically a 3 or above out of 5 points maximum (Smith, Hurwitz, & Avery, 2017). Even so, the minimum score required for college credit varies by AP exam subject and by the postsecondary institution accepting credit. Historically, AP enrollment and test participation rates have been low among minority and low-SES students (Klopfenstein, 2003), and so to address this criticism, the College Board has worked to waive exam fees and encourage schools to expand access to AP course opportunities for
underrepresented students (College Board, 2014). Between 2003 and 2013 the number of students who took an AP exam roughly doubled, from 514,000 to over 1 million.
In comparison to the standardized nature of AP, dual credit programs vary widely in their course curricula, structure, and college credit criteria across – and even within – states, depending on the local preferences and objectives of stakeholders (Karp et al., 2007; Borden et al., 2013; Taylor, Borden, & Park, 2015). Courses range from being college-preparatory in nature to focusing more on vocational skills or CTE topics. At the same time, policies outlining the scope of dual credit
systematically study the effectiveness of dual credit programs in encouraging high school and college success.3
Though national demographic figures on participants are unavailable (Allen, 2010), earlier studies suggest white and affluent students are more likely to enroll in these courses (Museus, Lutovsky, & Colbeck, 2007). However, especially in recent years, dual credit has been touted as a vital policy approach that can successfully target students underrepresented in college due to these programs’ flexibility; and many states have used this aim to justify broadening dual credit coverage and course offerings in order to engage students across the geographic, socioeconomic, and even academic achievement spectrum (Karp et al., 2007; Hoffman, Vargas, & Santos, 2009; Hughes et al., 2012). Tennessee’s statewide dual credit initiative, the focus of this paper, was established for many of these reasons.
When it comes to the credit-bearing dimension of dual credit courses, no studies have investigated the causal effect of receiving college credit in high school through dual credit. However, two papers have examined the effect of receiving college credit through scoring a higher AP score while in high school. Using data from the College Board and the National Student Clearinghouse for graduating high school cohorts 2004-2009, Smith, Hurwitz, and Avery (2017) implement an RD approach to estimate the effect of earning a higher AP integer score (1-5), and thus college credit, on college completion.4 They find that students who receive college credit on a single AP exam are 1-2
percentage points more likely to receive a BA degree within four years of high school graduation compared to their peers who do not receive college credit. Though receipt of college credit has no
3 Concerned about issues of quality assurance, the National Alliance of Concurrent Enrollment Partnership (NACEP) serves as national voluntary accreditation organization for dual credit and dual enrollment programs and courses based on a set of established criteria. For more information, see http://www.nacep.org/about-nacep/.
effect on the six-year graduation rate, suggesting that earning college credit in high school improves time-to-degree, though not overall completion. Looking at other integer margins where scoring above or below a threshold does not distinguish earning college credit, they do not find an effect on four-year BA completion. Therefore, they attribute the increased propensity to graduate within four years to AP college credits’ direct ability to fulfill college graduation requirements (e.g., introductory course requirements, general education requirements) and not just the psychological benefits of earning a higher integer score.
In a related paper that employs the same data source, student cohorts, and RD technique, Avery, Gurantz, Hurwitz, and Smith (2018) estimate the effect of receiving a higher AP integer score on college major choice. They find that scoring a higher AP integer score increases the probability of a student decides to major in that exam subject, with the effects strongest at the 4/5 margin.
Compared to their similarly scoring peers who merit a 4, students scoring a 5 are 0.64 percentage points (or 5 percent) more likely to major in the AP exam’s subject area. Avery et al. also find a similar positive relationship at the 2/3 margins and 3/4 margins, though they are smaller in magnitude. Interestingly, whereas the results from their paper looking at BA attainment found the effect of earning college credits on completion was due to AP credits’ ability to meet college course requirements, they find evidence that the positive effect of AP score on college major choice is primarily driven by a behavioral effect. A higher integer scores communicates a positive signal to students, shifting their major choice, even at integer margins where a higher score does not coincide with a boost in college credits.5 The credit-bearing aspect, on other words, does not seem to matter
in driving student major decisions.
5The most common threshold that coincides with a jump in college credits is at the margin of earning a 2 or a 3 on an
The findings from these two AP papers suggests that the overall effect of earning college credit in high school may affect some aspects of students’ postsecondary course-taking behaviors and performance, but not others. While it may mechanically reduce a student’s time-to-degree by helping them meet degree requirements earlier, it may not necessarily influence their course-taking behavior. These papers also highlight the importance of considering the signaling effect of attaining a certain score on an exam with college-credit-bearing potential – whether the student earns college credit with their score or not.
This paper adds to the existing body of literature by providing insight into how dual credit, as opposed to dual enrollment or AP, affects postsecondary enrollment and performance through the mechanism of college credit accrual. I rely on unique data from Tennessee’s statewide dual credit initiative to estimate the causal effect of successfully obtaining college credit on a range of early postsecondary outcomes including college choice, GPA, credits accrued, and persistence. Using an RD approach, I explore how outcomes differ between dual credit participants who obtain college credit and those participants whose course performances do not merit college credit.
3. Tennessee’s Statewide Dual Credit policy context
Tennessee’s Statewide Dual Credit (SDC) initiative was implemented as part of a larger enterprise aimed at establishing and improving early postsecondary experiences in the state. In 2007, and later in 2012, the Tennessee General Assembly passed legislation governing early postsecondary opportunities for high school students. Together, Public Chapter 459 (2007) and Public Chapter 967 (2012) developed the Cooperative Innovative High Schools Initiative, creating a consortium
Education, the Tennessee Department of Education (TDOE), the state’s postsecondary systems6,
and the Tennessee Higher Education Commission. The 2012 legislation also established the Office of Postsecondary Coordination and Alignment within TDOE, tasked with overseeing
implementation efforts.
As the first major initiative to emerge from these public charters, Tennessee’s SDC policy is the product of a collaborative effort between Tennessee secondary and postsecondary educators (TDOE, 2017). Together, educators developed high school courses that “incorporated college-level learning objectives” and content that would align high school courses with college expectations. Trained high school instructors teach these SDC courses on high school campuses.7 Each course
pairs with an aligned challenge exam, a cumulative assessment taken online at the end of the course.8
Students who score at or above a designated cut score on the challenge exam earn three college credit hours that can be applied to any public postsecondary institution in Tennessee, upon enrollment.9 In essence, high school exam passers bank transferable college credit that becomes
transcripted once they officially enroll in a Tennessee public college.
Tennessee’s SDC represents a “structural reform” to the K-12-to-college pipeline by tightly integrating or “fusing” together secondary and postsecondary education and forcing them, in addition to state and local agencies, to “adapt to a new educational paradigm” (Karp, 2015). This reform differs from the most common decentralized approaches where agreements to establish dual
6 These include the Tennessee Board of Regents, the University of Tennessee system, and the Tennessee Independent Colleges and Universities Association.
7 Both first-time and experienced SDC high school instructors attend professional development sessions over the summer, where they participate in sessions articulating the alignment of secondary and postsecondary learning objectives for their course. They also receive supplemental resources provided by the SDC faculty work group (TDOE, 2017).
8 The exam is free and students are only allowed one attempt.
credit or enrollment programs and to honor college credits are determined on a case-by-case basis, specific to student circumstances and institutional preferences. Critics argue the lack of
standardization in these approaches perpetuates the disconnect between high school and college. Structural reform, exemplified by Tennessee’s SDC, is often hailed as the preferred method for streamlining the secondary-postsecondary transition in a meaningful, comprehensive way (Karp, 2015; Hughes et al., 2012; Venezia, Kirst, & Antonio, 2003).
Since the 2013-14 academic year, the Consortium has gradually rolled out SDC courses, encompassing a diverse swath of subject areas. According to TDOE (2017), the courses are chosen based on consideration of several factors including workforce trends, vertical alignment with postsecondary programs, and student interest. All SDC courses go through a pilot stage for three years, at which point the Consortium determines whether the course should be submitted to the State Board of Education for formal approval of full implementation. In this process, some pilot courses are dropped or altered to become a different course.
Table 1 outlines information about the 14 different SDC courses and their accompanying challenge exams that have been implemented from 2013-14 through 2018-19. Both the subjects covered and their respective exam components vary, though the majority of exams are
student who earns college credit in a course that subsequently changes or retires still banks college credit for that course (TDOE, 2017; 2019).
Tennessee’s comprehensive SDC policy offers important opportunities to learn about the influence of dual credit course-taking on a suite of secondary and postsecondary outcomes. More recently, Hemelt, Schwartz, and Dynarski (2019) have worked with Tennessee’s Office of Research and Policy and the Office of Postsecondary Coordination and Alignment to design an experiment that would evaluate key outcomes. As the first randomized, controlled trial employed in dual credit research, the authors evaluate the effect of a school-level implementation of dual credit College Algebra on student high school and college outcomes. Out of the 14 dual credit courses listed in Table 1, College Algebra is the only course implemented as an experiment where treatment high schools offer a dual credit version of the course and control high schools offer a regular, high school version. This experiment lasted for two years (2013-14 and 2014-15), and the partnership aspect of this work has allowed interim findings to shape the rollout of other dual credit courses.
Hemelt et al. find that participation in an SDC College Algebra altered students’ later high school math course-taking, shifting students away from remedial math and boosting enrollment in AP courses. However, they fail to find a statistically significant effect of participating in College Algebra on overall college enrollment rates within a year of expected high school graduation. Still, they find some suggestive evidence that participation did incline students to enroll in Tennessee public four-year colleges and away from Tennessee public two-year institutions. Finally, they are unable to find conclusive evidence that dual credit College Algebra exposure affected students’ first-year college math performance in terms of GPA, credits earned, or number of math courses taken.
with only 27 percent of the 4,105 exam takers obtaining a minimum of 75 percent on their challenge exams.10 Within the experimental setup, this affords little power to detect effects of passing on
postsecondary outcomes. In contrast, this analysis pools together challenge exam records across a range of dual credit courses to isolate the effect of securing transferable college credit as distinct from participating in a dual credit course.
Students earn bankable college credit by passing a course-specific challenge exam, scoring at or above a designated score. Successful passers may have different postsecondary experiences relative to those who also took the course, but who failed to earn the corresponding credit nest egg as well. For both groups, exposure to rigorous course content may have enhanced participants’ preparedness and expectations for college study. Yet, in the context of Tennessee’s SDC policy, exam passers may disproportionately benefit from a financial or momentum standpoint by earning college credits before setting foot on a college campus.
The purpose of this research is to understand the potential premium (or penalty) that dual credit exam passers receive in terms of early-stage college outcomes. Proponents of dual credit expansion often cite its ability to confer college credits to high schoolers as a major benefit and strategy for improving student performance along a spectrum of enrollment and performance outcomes. Yet, there is little evidence to back up these assertions to date. This paper aims to contribute to the literature by providing causal estimates for how dual credit, through the
mechanism of college credit accumulation, influences students’ educational outcomes. Tennessee’s SDC initiative provides a compelling context for conducting this research. Specifically, my research questions are:
(1) Does passing an SDC challenge exam (and therefore banking college credit) increase the likelihood a student will enroll in college within a year of expected high school
graduation?
(2) Does passing a challenge exam affect the type of college or institution a student matriculates at within a year of graduating?
(3) How does passing a challenge exam and earning college credits before college affect early student performance as measured by credit accumulation, remedial credits earned, and first-year GPA?
(4) Does passing a challenge exam increase the likelihood a student will persist to their second year of college?
(5) How does banking three college credits in high school affect student performance (e.g., credits accumulation, GPA) into students’ second year of college?
4. Data
4.1 Analytic sample generation
I use data from four sources. First, I integrate (1) SDC challenge exam records from TDOE with (2) student-level administrative-level data from Tennessee’s data consortium, the State
Longitudinal Data System (“MeasureTN”). MeasureTN data contain information on all students in Tennessee public high schools including demographics, school and course enrollment, and
institutions, I also incorporate data from the (4) National Student Clearinghouse (NSC), likewise structured at the student-institution-semester level.11
To generate the analytic sample, I begin with de-identified student-challenge exam records provided by TDOE for challenge exams taken up through the 2016-17 school year (the most recent available). These records include score information for 10 of the 14 courses listed in Table 1, excluding Criminal Justice II, Introduction to Business, Speech and Communication, and American History. The raw data file contains 16,384 observations with 1,003 students holding more than one exam record. Hence, a unique record is identified at the student-exam-year level.12 Each record
specifies a student’s earned raw exam score percentage, the exam’s designated cut score percentage, and whether a student passed the exam (i.e., scored at or above the cut score). I then merge these records with student-level data from MeasureTN, THEC, and NSC.
I next restrict the sample to those students who are expected to matriculate at college within the window for which I have available postsecondary data. In addition, to probe the hypotheses that college credit earned in high school may provide momentum for students into their second year, I further restrict my sample to those students who could be expected to have up to two years of college experience. Spring 2018 is the latest term for which I have complete postsecondary records
11 TDOE and THEC submit cohorts of high school graduates to the NSC to measure rates of immediate college enrollment and choice. Based on data for the past cohorts of high school graduates, about 90 percent of all college-going students attend an in-state college – and 90 percent of those in-state enrollees appear at public institutions. It is also important to note that college credits earned through SDC courses are not required to be recognized at private or out-of-state institutions.
in both THEC and NSC data. I therefore restrict the sample to only those students whose expected13 on-time high school graduation year is 2013-14, 2014-15, or 2015-16.14
Additionally, I focus on student-exam records where a student scores within ± 30, ± 25, or ± 20 percentage points of the exam’s cut score, depending on the corresponding cut score’s value. A student’s challenge exam score represents a percentage between 0-100 percent. For exams with a cut score of 70 percent (e.g., Plant Science), students cannot score more than 30 points above the threshold; therefore, I create a symmetrical lower bound by retaining students who score no less than 30 points below the cut score. I apply this same lower bound logic to the exams with the cut scores of 75 percent (students within ± 25) and 80 percent (students within ± 20).
Consideration of course-specific cut scores and exam components also led me to drop all Sociology students from my analytic sample (N=617). Sociology is the only remaining course in my sample with a 2-essay exam component, and these questions require evaluation by a postsecondary faculty member. Due to random testing error, students cannot fully determine their scores on a given challenge exam, and this imprecise control is sufficient to produce random assignment at the cut score (Lee & Lemieux, 2010). However, if essay graders are aware of the minimum score required for a student to bank college credit, they may be able to manipulate the position of a student around the passing threshold by grading more leniently. TDOE clarifies that, though these faculty graders are often participants in the development of SDC courses and challenge exams, they evaluate essays according to a standardized rubric and remain unaware of a student’s performance on the multiple-choice portion (TDOE, 2017; 2019). Still, inspection of Sociology students scoring around the cut score revealed both a positive discontinuity in the density of students at the threshold
13A student’s expected graduation year is generated based on her entering 9th grade cohort year. TDOE provides entering cohort information for each student.
14Restricting the sample as such also means that I no longer include challenge exam records for any courses first offered
(McCrary test (2008)) and discontinuities in key demographic covariates that are also likely correlated with college enrollment and performance (e.g., race and ethnicity, achievement on prior end-of-course exams). I cannot rule out the possibility that grader bias may manipulate a student’s exam score percentage in Sociology, and so to preserve internal validity in my RD model, I eliminate these Sociology exam takers from my further analyses.
Finally, I restrict the sample to only those students who have non-missing information for demographic and achievement variables including gender, race and ethnicity, disability status, English Language Learner (ELL) status, and Algebra I end-of-course (EOC) exam score. The Algebra I EOC is a state-mandated assessment that students must take after completing the Algebra I course, which is taken by nearly all students by the end of 9th grade. The full analytic sample
contains 6,027 unique student-exam observations, including 284 (4.7 percent) who take more than one exam either in a different course or in a different year.
Table 2 shows the SDC course offerings, exam pass rates, and participant counts by course category and year for the full analytic sample. As the table indicates, both the pass rate and the number of exam takers varies widely between SDC courses and between years for the same SDC course. The courses with the highest overall pass rates are Agricultural Business (40.2 percent), College Algebra (36.1 percent), and Plant Science (34.0 percent) – though pass rates fluctuate within each course between 3-30 percentage points year-to-year. In contrast, none of the 33 students who took Health Information Technology passed the associated challenge exam and the pass rate for Criminal Justice is only 7.7 percent.
This variation in pass rates and participation rates between years, within the same course, is not a reflection of changes in the content or standards of the exam.15 Nor does it seem likely due to
changes in the composition of students taking the challenge exams. For each course offered over multiple years in my analytic sample, I tested the balance of key student demographic and academic achievement variables between years. There is some evidence that the proportion of exam takers in certain courses became less White, Non-Hispanic over time (in College Algebra and Criminal Justice I). Meanwhile, some courses became comprised of slightly lower-achieving students – as measured by performance on the Algebra I EOC exam – over time (in College Algebra, Agricultural Business) while others appeared to draw relatively higher-achieving students (Plant Science).
However, these differences in means were either not statistically significant at conventional levels or weakly significant depending on if standard errors were clustered at the school-level or cohort-level. Moreover, these compositional changes were not related to the course pass rate in that given year. To sum up, the wide variation in exam participation and pass rates within courses does not have a clear explanation, at least from observable student-level data. Table 1A in the Appendix provides an analogous table to Table 2 for the full sample of challenge exam records up through 2016-17 (N=16,438). It shows similar, seemingly idiosyncratic variability in participation and pass rates by year for the same SDC course. Finally, for additional context, the percentage of Tennessee students scoring a three or above in 2017 on AP exams in topical areas similar to SDC courses are as follows: Human Geography (49 percent), Psychology (64.2 percent), and Statistics (54.3 percent).
4.2 Summary statistics
Table 3 presents a comprehensive list of summary statistics for the full analytic sample of challenge exam takers and broken out by SDC broad subject and key courses, separately. Column 1 describes the full, pooled analytic sample. Column 2 describes “Math” participants in College
Algebra, Pre-Calculus, and Statistics, while column 3 describes characteristics of just College Algebra
exam takers (who comprise 70.5 percent of all Math participants). In a similar fashion, column 4 provides figures for “CTE” exam participants in the courses Criminal Justice I, Health Information Technology, Agricultural Business, and Plant Science. Column 5 describes just Plant Science
participants (representing 76.0 percent of all CTE). Students may appear in more than one column if they took multiple SDC courses.
Variables of interest are grouped into four panels. Student-level demographic and
achievement variables include means for gender, race and ethnicity, disability and Ell status, as well as prior Algebra I EOC achievement.16 Means and standard deviations are presented for students’
standardized Algebra I scores. A student’s score is standardized (i.e., mean=0, sd=1) within the population of all students in the state of Tennessee (TN) who took the Algebra I EOC in the same year. Column 1 in the top panel indicates that, overall, SDC examinees in the analytic sample are mostly White (87.2 percent) 12th graders17 (71.0 percent), who are about equally likely to be male or
female. They also perform, on net, a little more than half a standard deviation above (0.56) the statewide mean on the Algebra I EOC exam.
The demographic profile of students in the analytic sample aligns in some ways with that of the broader set of all Tennessee high school students in the academic years covered (not shown). Still, along several dimensions, some stark differences emerge. The share of Tennessee high school students who are White in these years is about 69 percent, indicating that the analytic sample share is about 18 percentage points higher. In the opposite direction, about 24 percent of Tennessee high school students are Black, while in the analytic sample, the share is only 6.6 percent. The analytic
16 I do not have student-level data on eligibility for free or reduced-price meals – an indication of socioeconomic status – as I am legally prohibited from having it due to the manner in which TDOE interprets guidance from the federal Department of Agriculture.
17 For all SDC courses, grade levels 11 and 12 (and occasionally 10) are the grade levels suggested by TDOE as
sample is also higher achieving, on average, according to Algebra I standardized scores. The mean score for all Tennessee high schools is 0.260 (sd=0.992), which is less than half the value for the full analytic sample. Dual credit participants are not necessarily representative of all Tennessee high school students.
Moreover, the pooled sample masks variation between course subject areas. Math exam takers are more female (55.9 percent) and comprised of more non-White (15.8 percent) students than the full sample. Meanwhile, CTE exam takers are disproportionately more White (92.9 percent) and male (58.7 percent) than the Math examinees. Compared to Math, CTE courses also contain a relatively higher proportion of 10th graders (5.9 percent vs. 1.3 percent) and 11th graders (30.0
percent vs. 24.0 percent). Finally, and perhaps unsurprisingly, students who take SDC Math exams have the higher average Algebra I EOC performance, with students performing 0.753 standard deviations about the statewide mean (compared to 0.199 standard deviations above the mean for CTE).18 The second panel in Table 3 provides SDC course and exam information, illustrating further
variation in student experiences. CTE students more likely than Math students to take (18.2 percent vs. 11.2 percent) and pass (6.2 percent vs. 3.8 percent) other SDC exams.
The third panel in Table 3 shows unconditional mean college enrollment figures within one year of a student’s expected high school graduation (spring) semester. Beyond basic enrollment, the table provides means for college choice based on characteristics of the institution at which a student enrolls. These choice outcomes fall along several dimensions including out-of-state versus in-state, private19 versus pubic, and Tennessee public four-year versus two-year versus Tennessee Technical
18 To put these standardized math scores into further context, the Math mean of 0.753 is in the 79th percentile in the distribution of all Tennessee high school students with a non-missing Algebra I SD score. The CTE mean of 0.199 is in the 52nd percentile. Math students scoring 0-10 points above the passing margin have a mean score of 0.91 which is in the 84th percentile of the score distribution, while CTE students scoring 0-10 points above have a mean score of 0.46 which is in the 68th percentile of the score distribution.