Cover Page
The handle
http://hdl.handle.net/1887/42781
h
olds various files of this Leiden University
dissertation.
Author: Elbaz M.S.M.M.
Title: Three-dimensional in-vivo intra-cardiac vortex flow from 4D Flow MRI :
quantification, automatic identification and association with energy loss
Three-dimensional in-vivo intra-cardiac
vortex flow from 4D Flow MRI
Quantification, automatic identification and association
with energy loss
Colophon
About the cover:
For the printed copy of this thesis, move the thesis vertically around the horizontal axis to see the animation. The animated printed cover shows the time evolution of 3D vortex ring (in brown) within left ventricular blood flow of a healthy human heart during early diastolic filling (from the moment of peak inflow to end diastasis) as derived from in-vivo 4D flow MRI velocity field. The structures in brown are 3D vortex cores (based on Lambda2 definition) superimposed on a streamline visualization of a cross-sectional view of LV blood flow color coded from blue to red according to velocity magnitude. Time (t), placed at the bottom of the cover, is the relative time of each phase/frame presented as a fraction of the RR interval starting from the time of peak inflow (0.43RR) to the time of the end of diastasis (0.73RR). More details can be found in Chapter 2 and online movie 2 referred therein.
Online cover shows the 3D vortex ring core superimposed on streamlines in the left ventricle at the moment of peak early filling. Copyright Mohammed S.M. Elbaz.
This work was carried out in the ASCI graduate school. ASCI dissertation series number 356
This research is supported by the Dutch Technology Foundation STW, which is part of the Netherlands Organisation for Scientific Research (NWO) and partly funded by the Ministry of Economic Affairs (project number 11626).
Three-dimensional in-vivo intra-cardiac vortex flow from 4D Flow MRI: Quantification, automatic identification and association with energy loss
Ph.D. thesis with a summary in Dutch.
ISBN 978-94-6332-052-8
Thesis layout by Mohammed S.M. Elbaz
Cover designed by Mohammed S. M. Elbaz and Rahil Shahzad Printed by GVO Drukkers en Vormgevers BV
© 2016 Mohammed S.M. Elbaz, Leiden, the Netherlands
Three-dimensional in-vivo intra-cardiac
vortex flow from 4D Flow MRI
Quantification, automatic identification and association
with energy loss
Proefschrift
ter verkrijging van
de graad van Doctor aan de Universiteit Leiden,
op gezag van Rector Magnificus Prof. mr. C. J. J. M. Stolker,
volgens besluit van het College voor Promoties
te verdedigen op dinsdag 6 september 2016
klokke 16:15 uur
door
Mohammed Samir Mohammed Mohammed Elbaz
Promotiecommissie
promotor: Prof.dr.ir. B.P.F. Lelieveldt
co-promotor: Dr.ir. R.J. van der Geest
leden promotie commissie: Prof.dr.ir. T. Ebbers
Linköping University, Linköping (Sweden)
Prof.dr. H.J. Lamb
Dr.ir. J. Wentzel
Contents
Chapter 1 Introduction 9
Chapter 2 Vortex flow during early and late left ventricular filling in normal subjects: quantitative characterization using retrospectively-gated 4D flow cardiovascular magnetic resonance and three-dimensional vortex core analysis
21
Chapter 3 Altered left ventricular vortex ring formation by 4-dimensional flow magnetic resonance imaging after repair of atrioventricular septal defects
43
Chapter 4 Assessment of viscous energy loss and the association with 3D vortex ring formation in left ventricular inflow: in vivo evaluation using 4D Flow MRI
63
Chapter 5 Abnormal left atrial flow patterns in patients after atrioventricular septal defect correction and regurgitation: evaluation with 4D Flow Magnetic Resonance Imaging and particle tracing
91
Chapter 6 Automatic extraction of the 3D left ventricular diastolic transmitral vortex ring from 3D whole-heart phase contrast MRI using Laplace-Beltrami signatures
107
Chapter 7 Hierarchical Shape Distributions for Automatic Identification of 3D Diastolic Vortex Rings from 4D Flow MRI
119
Chapter 8 Summary, Discussion and Future Perspectives 131
Samenvatting en conclusies 139
Chapter 1
Introduction
1
1.1.
Cardiac Physiology: Background
The heart is a vital organ in the human body that is responsible for pumping blood into the
circularity system through a network of blood vessels. The human heart is decomposed of
four chambers (Figure 1.1): left and right atria as well as left and right ventricles. Atria are
the upper chambers of the heart and work as reservoir for blood incoming from veins to
pass it into the ventricles. Ventricles are the two lower chambers of the heart that are
responsible for pumping (ejecting) the blood, incoming from the atria, out of the heart to
the body. The left atrium and ventricle are commonly referred to as the left heart whereas
right atrium and ventricle are referred to as the right heart. The right heart helps
oxygenating the blood: the de-oxygenated blood flows through the right atrium into the
right ventricle that pumps blood to the lungs where it gets oxygenated. The left heart pumps
this oxygenated blood into the rest of the body: oxygenated blood coming from the lungs
flows through the left atrium into the left ventricle (LV) that pumps it to the rest of the
body through the aorta.
Figure 1.1. Anatomy of the heart (source: https://commons.wikimedia.org)
A single cardiac cycle (heart beat) consists of two phases: systole and diastole.
The systole, or contraction phase, is the part of the cardiac cycle when left and right
ventricles contract to eject blood into the aorta and pulmonary artery, respectively.
Unidirectional flow out of the ventricles is ensured by the atrioventricular (mitral and
part of the cardiac cycle when the ventricles relax and refill with blood following the
systole. Diastolic filling consists of two main phases: early filling and late (atrial) filling.
Early diastolic filling (E-wave), also known as passive filling, is the phase when the
ventricle relaxes and its pressure drops below the pressure in the atrium. As a result, the
atrioventricular valves open causing the accumulated blood in the atria to flow into the
ventricle in a passive manner. Late diastolic filling (A-wave), also known as atrial or active
filling, is the phase when the atria contract and push the atrial blood into the ventricle. The
duration from the end of E-wave to the start of A-wave is called diastasis and it is inversely
proportional to the heart rate. In normal hearts, the passive early diastolic filling accounts
for 70-80% of the total ventricular inflow therefore, minimizing the needed atrial
contraction (work).
1.2.
Cardiac Vortex ring formation: Historical perspective
A vortex can be defined, intuitively, as the swirling motion of a group of particles
around a common axis. In more formal terms, a vortex is considered a flow region with a
concentrated vorticity. In three-dimensional space, vorticity is a vector quantity that
quantifies the local rotation rate of flow particles along the three principal components of
the flow field. Vorticity is a fundamental property of the flow and, in case of
incompressible flow, allows a complete reconstruction of the velocity field [1]. In
mathematical terms, vorticity is defined as the curl of velocity.
Vortex structures in the flow motion are abundant in nature, ranging from
destructing vortices of hurricanes and volcano eruptions to smoke rings and vortices in the
wake of a jelly fish swimming motion. Interestingly, vortex flow does not only form in our
surrounding environment, but also inside the heart and in every single heartbeat. In the
cardiac left ventricle, both in-vitro and in-vivo studies have shown that during diastolic
filling, a vortex ring (also known as a toroidal vortex) is naturally formed from the shear
layer distal to the mitral valve (MV) [2-6]. In a two-dimensional (2D) cross sectional view,
a vortex ring is visualized as a pair of counter rotating vortices (Figure 1.2).
Vortex ring formation in the left ventricle was initially reported from in-vitro
experiments using LV models [2, 4], suggesting it as a mechanism to help the full closure
of the bicuspid mitral valve. However, given that the in-vivo study of vortex flow requires
a flow imaging modality, it was not until the rise of color Doppler velocity mapping when
Kim et al. have confirmed the vortex formation in-vivo in a pig’s heart using 2D color
1
in the normal human left ventricle using 3D magnetic resonance (MR) velocity mapping
and 2D streamline flow visualization [6]. Kilner et al. have further confirmed the presence
of recirculating flow in the LV distal to the MV leaflets from MR velocity mapping. They
suggested a role of LV vortex flow formation in efficient redirection of blood inflow
towards the aortic outflow tract in an energy efficient manner [3].
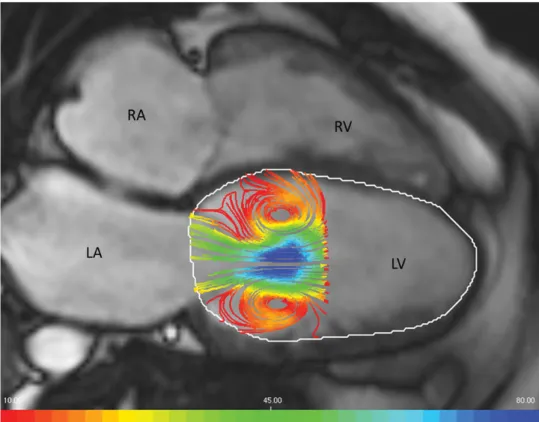
Figure 1.2. 2D view of an early filling vortex ring flow in the left ventricle (LV) visualized
as a pair of counter rotating vortices (left) using streamlines (color coded by velocity
magnitude from red to blue) and superimposed on a four chamber MR cardiac view. LV
endocardial boundary is delineated in white contours. (RV: Right Ventricle, LA: Left
Atrium and RA: Right Atrium).
Moving from investigational studies to more quantitative cardiac vortex flow
analysis, Gharib et al. have introduced the vortex formation time (VFT) as a global
quantitative and dimensionless index that describes the optimal vortex ring formation and
progression during early diastolic LV filling [7]. VFT is essentially the length-to-diameter
D [8]. In the LV, VFT can be computed as (ܸܨܶ ൌ ܷሺݐሻതതതതതതǤ ݀ݐȀܦഥ) with ܷሺݐሻതതതതതത as time-averaged speed through the opened MV over the early filling period ݀ݐ and through the average MV inflow diameter ܦഥ. From in-vitro experiments, optimal VFT is found to consistently take place at a specific VFT of § 4. Optimal VFT in the early LV filling phase of normal human volunteers was found to be consistent with in-vitro experiments (normal
VFT range = 3.3-5.5). A significantly different VFT from the optimal range was reported in
patients with dilated cardiomyopathy [7], stenotic mitral valves [9, 10], heart failure,
elevated LV afterload [11] and even in Alzheimer’s disease patients [12]. Therefore VFT
has been suggested as a novel index for diastolic dysfunction and cardiac health [7, 13].
Nevertheless, recent studies [14] have reported that VFT happens in the healthy LV much
earlier in diastole (VFT§1.6) compared to previously reported optimal VFT (VFT§4) [7], therefore questioning previously suggested relation between VFT and diastolic function
and concluded that VFT might not be related to diastolic function [15].
1.3.
Progress in vortex flow analysis
In recent years new advancements in in-vivo flow imaging techniques, such as
echo Particle Image Velocimetry (echo-PIV) [16, 17] and phase contrast Magnetic
Resonance Imaging (PC-MRI) [18, 19] have enabled more in-depth analysis of LV vortex
flow. For instance, echo-PIV was used to reconstruct 2D velocity and vorticity fields to
quantitatively characterize 2D LV vortex flow in normal subjects and patients with systolic
dysfunction [20], prosthetic mitral valve heart failure [21] and patients with apical
thrombus formation [22]. Nevertheless, Echo-PIV requires injection of contrast particles
(contrast agent) which are then tracked using so-called particle image velocimetry (PIV) to
approximate the velocity field. While promising, Echo-PIV is mainly limited to assessment
of 2D velocity field and consequently is a 2D analysis.
Recent developments are not limited to flow imaging techniques. Major progress
in computational fluid mechanics (CFD) modeling methods has also been made. This has
been driven by the significant growth of available computer processing power and the use
of in-vivo-derived boundary conditions. Such progress enabled simulation and analysis of
cardiac vortex flow in unprecedented detail. Specifically, 3D modeling of LV flow
dynamics has revealed the complex 3D nature of the LV flow field [23-25]. Detailed 3D
simulations guided by in-vivo MR boundary conditions of diastolic LV vortical flow,
1
impingement on the wall and following breakup [26, 27]. These studies emphasizes the
three-dimensional nature of LV vortex ring flow, indicating that proper in-vivo analysis of
intra-cardiac vortex flow needs to be three-dimensional and involving the three components
of the velocity field.
While CFD simulations provide high spatial and temporal resolution allowing
detailed physical analysis, it involves numerous simplifications to the cardiac geometry and
dynamics. This can result in a different vortex ring flow dynamics from true human cardiac
flow. Hence, in-vivo analysis of 3D intra-cardiac vortex ring flow is important to
understand its dynamics, mechanism and physiological properties in the human cardiac
(dys)function.
1.4.
Four-dimensional Flow Magnetic Resonance Imaging (4D
Flow MRI)
4D Flow MRI (also known as three-directional three-dimensional phase contrast
MRI) is an emerging in-vivo flow imaging technique that enables the acquisition of all
three components of the flow field, over the three spatial dimensions and over the cardiac
cycle [18, 19, 28-31]. As opposed to other techniques, e.g. echo-PIV, 4D Flow MRI does
not require the use of a contrast agent for flow imaging. Instead, 4D Flow MRI uses the
intrinsic magnetic properties of blood flow. That is, the property of the flow velocity being
directly related to the phase shift in the MR signal along a magnetic field [19, 31]. The
velocity along a specified encoding direction can be detected by applying suitable bipolar
gradients, where two acquisitions are performed that are identical in all parameters but with
two different velocity-dependent signal phases [18, 19, 29]. The velocity images can then
be calculated by subtracting the two resulting phase images. This approach is also known
as phase contrast MRI (PC-MRI).
A dynamic flow acquisition over a cardiac cycle involves acquiring the data over
multiple ECG-gated cardiac cycles to tackle the slow (up to 20 minutes) MR acquisition
relative to the cardiac dynamics. Acquiring velocity encoded data requires to manually
predefine the velocity sensitivity encoding parameter (VENC). That is the maximum
positive or negative velocity that can be detected without an aliasing error. VENC is mainly
defined empirically and based on prior knowledge of the maximum expected velocity in the
region of interest. 4D Flow MRI acquires dynamic volumetric velocity data over three
its clinical use. Therefore, different acceleration techniques have been developed to speed
up the scan time [28, 32-34].
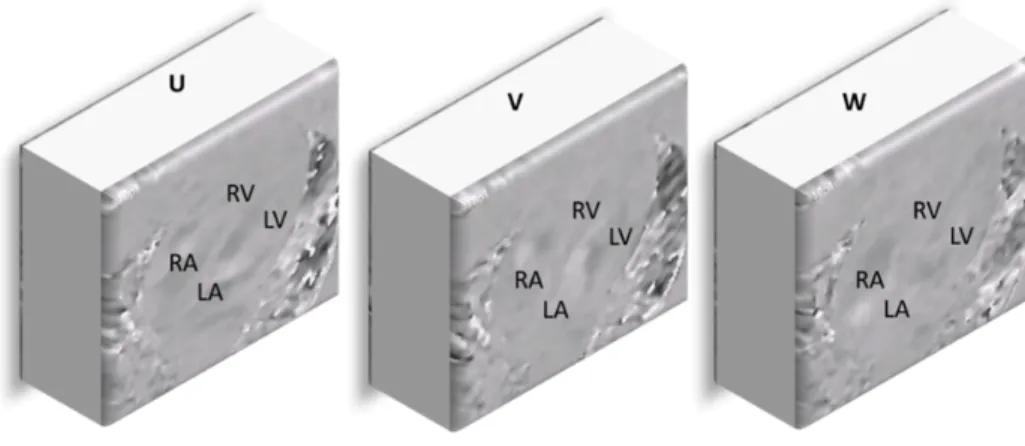
The typical output of a reconstructed 4D Flow MRI acquisition is
three-dimensional image volumes that encode the three velocity field components (i.e. the two
in-plane ܃ǡ ܄ components and the through-plane ܅ component) (Figure 1.3). The fact that 4D Flow MRI provides the complete velocity field, enables in vivo analysis of LV kinetic
energy [35, 36], turbulent flow [37, 38], relative pressure field [39-41] evaluation of
different flow components [42] and flow patterns [43] in three-dimensional space as well as
their evolution over time.
Töger et al. have used Lagrangian coherent structure (LCS) analysis [44, 45] of
4D Flow MRI to quantify the vortex ring volume in LV diastolic function in healthy human
subjects and in patients with dilated cardiomyopathy [46]. While encouraging, LCS
provides global vortex flow analysis over a period of time without providing direct
information about the instantaneous vortex development. To characterize the details of
diastolic vortex ring flow dynamics in the LV and in relation to inflow, 3D
instantaneous-based analysis of vortex ring flow evolution over the diastolic LV filling is needed.
Figure 1.3. Example of reconstructed whole-heart 4D Flow MRI volumes of the three
velocity components (the in-plane ܃ǡ ܄ components and the through-plane ܅ component). Grey-scale values encode the velocity magnitude and direction along the direction of
1
1.5.
Thesis objectives and outline
The aim of this thesis is to develop methods that enable in-vivo analysis of 3D
vortex flow patterns in the human heart, particularly through analysis of the 3D velocity
field from in-vivo 4D Flow MRI. Accordingly, this thesis has the following four objectives:
1. To characterize and quantify in-vivo 3D cardiac vortex flow to reveal the normal
3D vortex flow formation process in healthy human subjects.
2. To determine the impact of unnatural cardiac morphology in human patients, on
3D cardiac vortex flow formation.
3. To assess consequences of altered 3D cardiac vortex flow on cardiac physiology.
4. To enable objective analysis of in-vivo 3D cardiac vortex flow from 4D Flow
MRI.
These objectives are addressed throughout the remaining chapters of this thesis as follows:
Chapter 2 introduces an interactive workflow for instantaneous 3D vortex ring
identification in the LV during early and late diastolic filling from in-vivo 4D Flow MRI.
Standardized quantitative geometric characterization of 3D diastolic vortex ring flow is
proposed providing normal ranges in a cohort of healthy subjects. The association of 3D
vortex ring shape with MV inflow shape through mitral annulus and leaflet tips are
evaluated.
Chapter 3 investigates the effect of abnormal atrioventricular (mitral) valvular
inflow on 3D vortex ring formation in a cohort of congenital heart disease patients who are
known to develop abnormal atrioventricular (mitral) valvular inflow and morphology.
These are patients who underwent an atrioventricular surgical repair due to a congenital
septal defect. Quantitative characterization of 3D vortex ring shape, geometry and position
relative to LV, introduced in chapter 2, are evaluated and compared to those of healthy
subjects. Altered 3D vortex formation in the studied patients is revealed.
Chapter 4 evaluates the consequences of altered vortex ring flow formation on
LV physiology through assessment of the association between in-vivo, 4D Flow
MRI-derived, viscous energy loss during diastole and inflow 3D vortex ring formation during
both early and late filling in both healthy subjects and patients.
Chapter 5 explores 3D systolic left atrial vortex flow in healthy subjects and
congenital heart disease patients with various degrees of left atrioventricular valve (LAVV)
Chapter 6 and Chapter 7 address the critical need in clinical practice to ensure objective quantitative results by proposing two novel methods, based on 3D shape
signatures, for automatic identification and extraction of 3D vortex ring objects
(isosurfaces). The proposed methods are evaluated in healthy subjects (Chapter 6 and
Chapter 7) and patients (Chapter 7) showing quite promising and encouraging results.
Chapter 8 summarizes the results of this thesis, and discusses future perspectives.
1.6. References
1. Kheradvar, A. and G. Pedrizzetti, Vortex formation in the cardiovascular system. 2012, Springer. p. 45-79.
2. Bellhouse, B., Fluid mechanics of a model mitral valve and left ventricle. Cardiovascular research, 1972. 6(2): p. 199-210.
3. Kilner, P.J., et al., Asymmetric redirection of flow through the heart. Nature, 2000. 404(6779): p. 759-761.
4. Reul, H., N. Talukder, and E. Mu, Fluid mechanics of the natural mitral valve. Journal of biomechanics, 1981. 14(5): p. 361-372.
5. Kim, W.Y., et al., Two-dimensional mitral flow velocity profiles in pig models using epicardial Doppler echocardiography. Journal of the American College of Cardiology, 1994. 24(2): p. 532-545.
6. Kim, W.Y., et al., Left ventricular blood flow patterns in normal subjects: a quantitative analysis by three-dimensional magnetic resonance velocity mapping. Journal of the American College of Cardiology, 1995. 26(1): p. 224-238.
7. Gharib, M., et al., Optimal vortex formation as an index of cardiac health. Proceedings of the National Academy of Sciences, 2006. 103(16): p. 6305-6308.
8. Gharib, M., E. Rambod, and K. Shariff, A universal time scale for vortex ring formation. Journal of Fluid Mechanics, 1998. 360: p. 121-140.
9. Kheradvar, A. and M. Gharib, Influence of ventricular pressure drop on mitral annulus dynamics through the process of vortex ring formation. Annals of biomedical engineering, 2007. 35(12): p. 2050-2064.
10. Kheradvar, A., M. Milano, and M. Gharib, Correlation between vortex ring formation and mitral annulus dynamics during ventricular rapid filling. ASAIO Journal, 2007. 53(1): p. 8-16.
11. Jiamsripong, P., et al., Impact of Acute Moderate Elevation in Left Ventricular Afterload on Diastolic Transmitral Flow Efficiency: Analysis by Vortex Formation Time. Journal of the American Society of Echocardiography, 2009. 22(4): p. 427-431.
12. Belohlavek, M., et al., Patients With Alzheimer Disease Have Altered Transmitral Flow Echocardiographic Analysis of the Vortex Formation Time. Journal of Ultrasound in Medicine, 2009. 28(11): p. 1493-1500.
13. Kheradvar, A., et al., Assessment of transmitral vortex formation in patients with diastolic dysfunction. Journal of the American Society of Echocardiography, 2012. 25(2): p. 220-227.
14. Stewart, K.C., et al., Left ventricular vortex formation is unaffected by diastolic impairment. American Journal of Physiology-Heart and Circulatory Physiology, 2012. 303(10): p. H1255-H1262.
15. Pasipoularides, A., P.P. Vlachos, and W.C. Little, Vortex formation time is not an index of ventricular function. Journal of cardiovascular translational research, 2015. 8(1): p. 54-58. 16. Kim, H., J. Hertzberg, and R. Shandas, Development and validation of echo PIV.
Experiments in fluids, 2004. 36(3): p. 455-462.
1
18. Pelc, N.J., et al., Phase contrast cine magnetic resonance imaging. Magnetic resonancequarterly, 1991. 7(4): p. 229-254.
19. Markl, M., et al., 4D flow MRI. Journal of Magnetic Resonance Imaging, 2012. 36(5): p. 1015-1036.
20. Hong, G.R., et al., Characterization and Quantification of Vortex Flow in the Human Left Ventricle by Contrast Echocardiography Using Vector Particle Image Velocimetry. Jacc-Cardiovascular Imaging, 2008. 1(6): p. 705-717.
21. Abe, H., et al., Contrast echocardiography for assessing left ventricular vortex strength in heart failure: a prospective cohort study. European Heart Journal-Cardiovascular Imaging, 2013. 14(11): p. 1049-1060.
22. Son, J.-W., et al., Abnormal left ventricular vortex flow patterns in association with left ventricular apical thrombus formation in patients with anterior myocardial infarction. Circulation Journal, 2012. 76(11): p. 2640-2646.
23. Domenichini, F., G. Pedrizzetti, and B. Baccani, Three-dimensional filling flow into a model left ventricle. Journal of fluid mechanics, 2005. 539: p. 179-198.
24. Cheng, Y., H. Oertel, and T. Schenkel, Fluid-structure coupled CFD simulation of the left ventricular flow during filling phase. Annals of biomedical engineering, 2005. 33(5): p. 567-576.
25. Nordsletten, D., et al., Fluid–solid coupling for the investigation of diastolic and systolic human left ventricular function. International Journal for Numerical Methods in Biomedical Engineering, 2011. 27(7): p. 1017-1039.
26. Le, T.B. and F. Sotiropoulos, On the three-dimensional vortical structure of early diastolic flow in a patient-specific left ventricle. European Journal of Mechanics-B/Fluids, 2012. 35: p. 20-24.
27. Schenkel, T., et al., MRI-based CFD analysis of flow in a human left ventricle: methodology and application to a healthy heart. Annals of biomedical engineering, 2009. 37(3): p. 503-515.
28. Dumoulin, C., et al., ThreeǦdimensional phase contrast angiography. Magnetic Resonance in Medicine, 1989. 9(1): p. 139-149.
29. Bernstein, M.A., A. Shimakawa, and N.J. Pelc, Minimizing TE in momentǦnulled or flowǦ encoded twoǦand threeǦdimensional gradientǦecho imaging. Journal of Magnetic Resonance Imaging, 1992. 2(5): p. 583-588.
30. Gu, T., et al., PC VIPR: a high-speed 3D phase-contrast method for flow quantification and high-resolution angiography. American journal of neuroradiology, 2005. 26(4): p. 743-749. 31. Ebbers, T., Flow imaging: cardiac applications of 3D cine phase-contrast MRI. Current
Cardiovascular Imaging Reports, 2011. 4(2): p. 127-133.
32. Wigström, L., L. Sjöqvist, and B. Wranne, Temporally resolved 3D phaseǦcontrast imaging. Magnetic resonance in medicine, 1996. 36(5): p. 800-803.
33. Markl, M., et al., TimeǦresolved 3D MR velocity mapping at 3T: Improved navigatorǦgated assessment of vascular anatomy and blood flow. Journal of magnetic resonance imaging, 2007. 25(4): p. 824-831.
34. Johnson, K.M. and M. Markl, Improved SNR in phase contrast velocimetry with fiveǦpoint balanced flow encoding. Magnetic Resonance in Medicine, 2010. 63(2): p. 349-355. 35. Carlsson, M., et al., Quantification of left and right ventricular kinetic energy using
four-dimensional intracardiac magnetic resonance imaging flow measurements. American Journal of Physiology-Heart and Circulatory Physiology, 2012. 302(4): p. H893-H900. 36. Eriksson, J., et al., Quantification of presystolic blood flow organization and energetics in
the human left ventricle. American Journal of Physiology-Heart and Circulatory Physiology, 2011. 300(6): p. H2135-H2141.
37. Dyverfeldt, P., et al., Assessment of fluctuating velocities in disturbed cardiovascular blood flow: in vivo feasibility of generalized phase-contrast MRI. Journal of Magnetic Resonance Imaging, 2008. 28(3): p. 655-663.
39. Ebbers, T., et al., Noninvasive measurement of time-varying three-dimensional relative pressure fields within the human heart. Journal of biomechanical engineering, 2002. 124(3): p. 288-293.
40. Ebbers, T., et al., Estimation of relative cardiovascular pressures using timeǦresolved threeǦ dimensional phase contrast MRI. Magnetic resonance in medicine, 2001. 45(5): p. 872-879. 41. Ebbers, T. and G. Farnebäck, Improving computation of cardiovascular relative pressure
fields from velocity MRI. Journal of Magnetic Resonance Imaging, 2009. 30(1): p. 54-61. 42. Eriksson, J., et al., Semi-automatic quantification of 4D left ventricular blood flow. J
Cardiovasc Magn Reson, 2010. 12(9): p. 12.
43. Markl, M., P.J. Kilner, and T. Ebbers, Comprehensive 4D velocity mapping of the heart and great vessels by cardiovascular magnetic resonance. J Cardiovasc Magn Reson, 2011. 13(7): p. 10.1186.
44. Haller, G. and G. Yuan, Lagrangian coherent structures and mixing in two-dimensional turbulence. Physica D: Nonlinear Phenomena, 2000. 147(3): p. 352-370.
45. Shadden, S.C., F. Lekien, and J.E. Marsden, Definition and properties of Lagrangian coherent structures from finite-time Lyapunov exponents in two-dimensional aperiodic flows. Physica D: Nonlinear Phenomena, 2005. 212(3): p. 271-304.
Chapter 2
Vortex flow during early and late left ventricular
filling in normal subjects: quantitative characterization
using retrospectively-gated 4D flow cardiovascular
magnetic resonance and three-dimensional vortex core
analysis
This chapter was adapted from:
Elbaz, M. S.*, Calkoen, E. E.*, Westenberg, J. J., Lelieveldt, B. P.,
Roest, A. A., & van der Geest, R. J. (2014).
Vortex flow during early
and late left ventricular filling in normal subjects: quantitative
characterization using retrospectively-gated 4D flow cardiovascular
magnetic resonance and three-dimensional vortex core analysis
.
Journal of Cardiovascular Magnetic Resonance, 16(1), 78.
Abstract
Background: LV diastolic vortex formation has been suggested to critically contribute to
efficient blood pumping function, while altered vortex formation has been associated with
LV pathologies. Therefore, quantitative characterization of vortex flow might provide a
novel, objective tool for evaluating LV function. The objectives of this study were 1) to
assess feasibility of vortex flow analysis during both early and late diastolic filling in vivo
in normal subjects using 4D Flow cardiovascular magnetic resonance (CMR) with
retrospective cardiac gating and 3D vortex core analysis 2) establish normal quantitative
parameters characterizing 3D LV vortex flow during both early and late ventricular filling
in normal subjects.
Methods: With full ethical approval, twenty-four healthy volunteers (mean age: 20േ10 years) underwent whole-heart 4D Flow CMR. The Lambda2-method was used to extract
3D LV vortex ring cores from the blood flow velocity field during early (E) and late (A)
diastolic filling. The 3D location of the center of vortex ring core was characterized using
cylindrical cardiac coordinates (Circumferential, Longitudinal (L), Radial(R)). Comparison
between E and A filling was done with a paired T-test. The orientation of the vortex ring
core was measured and the ring shape was quantified by the circularity index (CI). Finally,
the Spearman’s correlation between the shapes of mitral inflow pattern and formed vortex
ring cores was tested.
Results: Distinct E- and A-vortex ring cores were observed with centers of A-vortex rings
significantly closer to the mitral valve annulus (E-vortex L=0.19±0.04 versus A-vortex
L=0.15±0.05; p=0.0001), closer to the ventricle’s long-axis (E-vortex: R=0.27±0.07,
vortex: R=0.20±0.09, p=0.048) and more elliptical in shape (E-vortex: CI=0.79±0.09,
A-vortex: CI=0.57±0.06; p<0.001) compared to E-vortex. The circumferential location and
orientation relative to LV long-axis for both E- and A-vortex ring cores were similar. Good
to strong correlation was found between vortex shape and mitral inflow shape through both
the annulus (r=0.66) and leaflet tips (r=0.83).
Conclusions: Quantitative characterization and comparison of 3D vortex rings in LV
inflow during both early and late diastolic phases is feasible in normal subjects using
retrospectively-gated 4D Flow CMR, with distinct differences between early and late
2
2.1. Introduction
Vortex formation within the left ventricular (LV) blood flow has been suggested to
critically contribute to efficient blood pumping function [1]. A vortex can be described as a
group of fluid particles with a swirling motion around a common axis. Among different
types of vortices, vortex rings (also known as toroidal vortex) are abundant in nature
because of their compactness and stability [1-3].
In the LV, in healthy subjects, both in vivo and in vitro studies have reported vortex ring formation during early diastolic filling, originating at the distal tip of the mitral
valve (MV) leaÀets [1, 4-11]. In a three dimensional (3D) view, this vortex ring appears as
a closed tube with torus-like shape distal to the mitral valve orifice. In a two dimensional
(2D) four-chamber view a 3D vortex ring appears as a counter-rotating vortex pair, one
distal to the anterior MV leaflet and another distal to the posterior leaflet. Such vortex
formation may help in efficient MV closure [5], efficient diastolic filling, minimizing
kinetic energy loss [4, 6] and preventing thrombus formation [7]. An altered (early filling)
vortex formation have been shown to develop in patients with diastolic dysfunction and
dilated ischemic cardiomyopathy, suggesting a relation between abnormal vortex formation
and LV dysfunction [7, 8]. On the other hand, in normal subjects, discrepancies arise in
literature and little is known about vortex formation during late filling. Experimental
studies using computational fluid dynamics (CFD)-based simulations of LV inflow have
reported the formation of a vortex ring distal to the MV during late LV filling, [12-17]. In
contrast, in vivo studies have reported only the formation of a single anterior vortex during late filling (i.e. not a vortex ring because of the absence of a posterior vortex) [6, 9, 18-21]
or even the absence of any vortex [18]. While CFD simulation can provide higher temporal
and spatial resolution than in vivo data, application of CFD techniques also involve simplifications of the geometry and dynamics of the left ventricle and mitral valve leaflets
which might result in inaccurate modelling of the true blood flow.
4D Flow CMR (also known as 4D Flow MRI) with retrospective cardiac gating
can acquire all the three directional velocity components (in-plane and through-plane) of
the blood flow relative to the three spatial dimensions and over the whole cardiac cycle,
providing a powerful tool for evaluating blood flow patterns during both early and late left
ventricular filling in-vivo [6, 22, 23]. Previous studies have shown the feasibility of using 4D Flow CMR for vortex flow analysis [6, 19, 22, 24-27]. These studies mainly focus on
establishing normal ranges defining LV vortex flow, standardized quantitative
characterization of the 3D shape and location of normal vortex flow are currently lacking.
Different from visualization-based vortex identification, vortex core detection
techniques [28-30] base their vortex identification on the underlying physical properties of
a vortex instead of only visual assessment, therefore, provide more objective vortex
definition. CFD experiments have shown that LV vortex ring originates from the inlet jet
through the mitral valve orifice during early LV filling [1, 4, 10, 13], therefore, the shape of
the formed vortex is expected to resemble the shape of the originating valvular opening [4,
13]. Hence, we hypothesized that similar behavior could be identified in vivo where a more oval opening of the MV during peak late filling results in a more elliptical vortex ring
compared to the one originating from a more circular valve opening during peak early
filling. Accordingly, the aims of our study were to apply retrospectively-gated 4D Flow
CMR and quantitative 3D vortex core analysis to 1) Assess feasibility of in vivo vortex flow analysis during both early and late diastolic filling in normal subjects 2) Establish
normative quantitative parameters characterizing 3D LV vortex flow during both early and
late ventricular filling in normal subjects.
2.2. Methods
2.2.1. Study population
Twenty-four healthy volunteers (9 males, mean age 20±10 years; age range 9-44
years), without history of cardiac disease, abnormalities on ECG or echocardiography were
included. The study protocol was approved by the institutional review board and written
informed consent was given by all subjects or their legal representatives.
2.2.2. 4D Flow CMR protocol
All subjects underwent 4D Flow MR imaging using a 3T digital broadband
multi-transmit CMR system (Ingenia, Philips Medical Systems, Best, The Netherlands), with
maximal gradient amplitude 45 mT/m and maximal slew rate 200 T/m/s. For signal
reception, a 60cm Torso coil was used in combination with the FlexCoverage Posterior coil
in the tabletop, combining a maximum of 32 elements. A 3D time-resolved volume
acquisition of the whole heart was performed with velocity encoding in all three directions
with velocity sensitivity (VENC) of 150 cm/s. The acquired volume data was reconstructed
2
(three subjects were scanned with 3 mm slice thickness). Retrospective cardiac gating was
performed with Vector ECG triggering. Scan parameters: echo time 3.0 ms, repetition time
9.9 ms, flip angle 10°, field-of-view 400 mm, number of signal averages 1. VENC 150
cm/sec. Acceleration was achieved by Echo Planar Imaging with EPI factor 5. Free
breathing was allowed and no respiratory motion compensation was used. Commercially
available concomitant gradient correction was used for phase offset correction.
2.2.3. 3D vortex core identification using the Lambda2-method
In this study, vortex cores in the LV cavity were detected over the diastolic phases
using the Lambda2 (Ȝ2)-method [28]. The Lambda2-method is an objective method that
identifies 3D vortex cores based on their physical fluid dynamics properties, and is
considered the most accepted vortex detection technique [31]. In short, the
Lambda2-method uses the fluid’s velocity gradient properties to obtain a scalar value, Ȝ2. In a loose
sense, this obtained scalar reflects the pressure due to velocity gradients after excluding the
effect of the irrotational part of the flow. The vortex cores are then identified as the regions
with extreme negative Ȝ2-values. These identified vortex cores can be visualized by use of
isosurfaces of isovalue ఒమ, which is an application-dependent threshold. More technical
background of applying the Lambda2-method on 4D Flow CMR, including the choice of
the isovalue threshold, has been described earlier [32].
2.2.4. Vortex core analysis workflow
4D Flow CMR data were analyzed with in-house developed software based on
Matlab (Version R2012a, Mathworks Inc., Novi, MI). First, the LV endocardial boundaries
were manually delineated using MASS research software (Version 2013EXP, Leiden
University Medical Center, Leiden, The Netherlands). Subsequently, the Lambda2-method
was applied to the 4D Flow CMR data to identify the vortex structures within the LV blood
pool. Early (E) filling and atrial (A) filling phases were defined from the flow rate-time
graph after transmitral velocity mapping in combination with retrospective valve tracking
[33]. For every subject, the vortex ring core (if detected) of peak early filling and peak late
filling was used for further quantitative analysis. As described in previous work, the
Lambda2 isovalue threshold (ఒమ) was defined as ఒమ = ۹Ɋ (with ۹ as a real number and Ɋ
and late (A) -vortex ring cores were further quantitatively analyzed using the parameters
explained below. In the remainder, the vortex cores detected at peak early filling and peak
late filling will be denoted as E-vortex and A-vortex, respectively.
2.2.5. 3D quantitative characterization of diastolic vortex ring core
The 3D location and orientation of the vortex ring core were quantified using a
standardized 3D local cardiac (cylindrical) coordinate system, abbreviated by CLR. Every
vortex ring core center was localized using its circumferential (C), longitudinal (L) and
radial (R) coordinates and orientation relative to the LV as defined and illustrated in
(Figure 2.1). The shapes of the vortex ring cores were quantified using a dimensionless
circularity index (), defined as the ratio between the vortex’s short (ͳ) to long (ʹ) diameters, i.e., ൌ ͳȀʹ (See Figure 2.2 a).
2.2.6. Intra and interobserver reproducibility:
One observer repeated the same measurements after one week to allow assessment
of intraobserver reproducibility. Two independent observers repeatedly performed
measurements on all subjects to assess interobserver reproducibility of derived parameters.
The observers manually defined the Lambda2 threshold (మ ) as explained above. Then, C, L, R coordinates and orientation of vortex ring cores for both early and late filling were
quantified.
2.2.7. Vortex-Mitral flow association
To investigate the relationship between the geometry of the vortex ring core and
the inflow jet area through the MV, the area of MV opening was assessed at two levels
using retrospective valve tracking [33]. In short, at the same phase as the selected vortex, a
plane was positioned at the annulus level and a second plane at one centimeter distal to the
annulus (Figure 2.2: (b)) as an approximation of the tip level of the opened MV leaflets.
These planes resulted in two cross-sectional images with through-plane velocity encoding
in which the flow through the opened MV was outlined (Figure 2.2: (c), (d)). The outlined
regions were then used to calculate the circularity index of the inflow area at the mitral
annulus level (CIMV) and at the valve tip level (CIMV_tip), as the ratio between the short- to
long-diameters of the outlined region. The correlation between the vortex circularity index
2
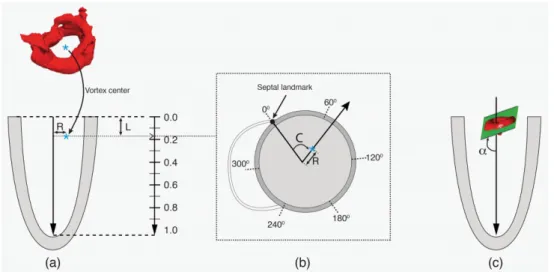
Figure 2.1. Definition of the local cardiac coordinate system (C, L, R) relative to the LV:
The LV long-axis is defined as the line from the mid of the mitral valvular opening to the
LV apex. The long-axis was calculated separately per filling phase (i.e. one for early filling
and another for late filling). The center of the vortex ring was projected on this long-axis.
The distance of the projected point to the MV and to the vortex center defined the vortex’s
longitudinal (L) and radial (R) coordinates as illustrated in (a), respectively. Both L and R
distances were normalized to the long-axis length and to the basal endocardial radius
(measured on a reformatted short-axis slice), respectively to provide dimensionless
parameters. Circumferential (C) Coordinate is defined as the angle between the septal
landmark (the anterior attachment of the RV free wall with the LV) and the vortex center as
illustrated in cross-sectional view (b). the vortex ring orientation ( Į ) measured as angle between the LV long-axis vortex and a fitting plane of the vortex ring, where an orientation
of 90° means a vortex ring is perpendicular to the LV long-axis as shown in (c).
2.2.8. Statistical analysis
Statistical analysis was performed using SPSS Statistics software (version 20.0
IBM SPSS, Chicago, Illinois). Quantitative parameters were presented as mean ± standard
deviation or median and inter-quartile ranges (IQR) where appropriate. Differences
between E- vortex ring and A-vortex ring parameters were compared using paired Student
t-test. Spearman’s correlation test was used to assess the relationship between vortex ring
shape and mitral inflow area shape. Inter- and intraobserver reproducibility were
determined by the interclass correlation coefficient for absolute agreement, the absolute and
of variance defined as the standard deviation of the difference divided by the mean of both
measurements. A p-value <0.05 was considered statistically significant.
2.3. Results
2.3.1 Subject characteristics
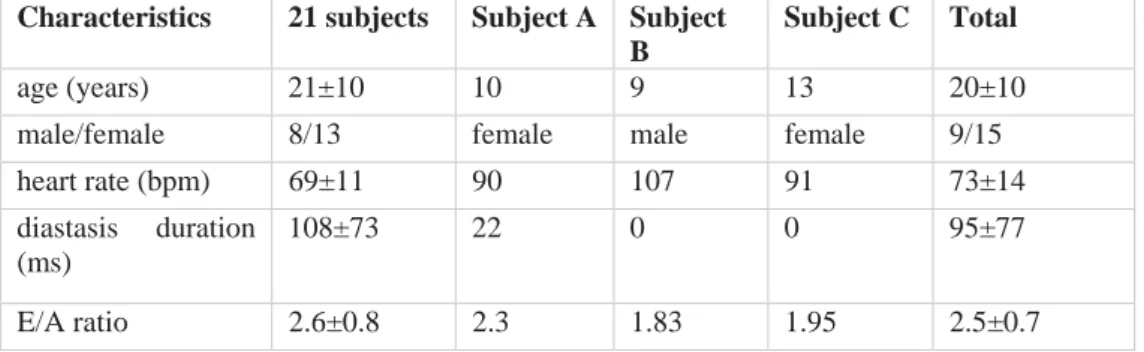
Clinical characteristics of the study population are shown in Table 2.1. Three
subjects with an absent A-vortex ring core are described separately.
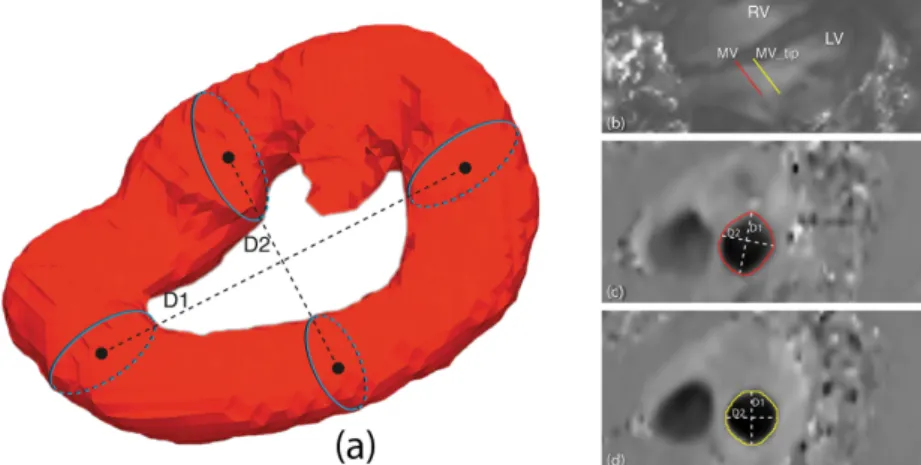
Figure 2.2. Diagram showing the measurement of the vortex circularity Index (CI). In (a),
CI=D2/D1, D1 represents vortex’s long diameter and D2 represents the vortex’s shortest
diameter. Both diameters measured as the distance between centers of corresponding and
opposite cross-sections along the diameter of interest. (b) Two planes positioned on
through-plane velocity-encoded MR images at the annulus level (red) and one centimeter
distal of the annulus (yellow) resulted in two cross-sectional images of the through-plane
velocity (c, d) in which the flow through MV was outlined and used to define circularity
index of MV flow.
2.3.2 Characterization of 3D LV vortex ring cores
In all twenty-four subjects, during the E-filling, a compact quasi-torus-shaped
vortex ring core (Figure 2.3: (a-c)) started to form distal to the mitral valve leaflets shortly
after the onset of the E-filling and continued its development during the period of E-filling
acceleration, reaching its full development with the E-filling approaching its peak (Figure
2
complex shape which tended to align with the LV long-axis (Figure 2.4: f6-f10) while
progressing towards the apex. Only a remaining residual of the vortex ring core, located at
the mid-ventricular level could be observed at the onset of atrial contraction and this
remnant of the E-vortex ring core could not be observed anymore at end diastole (Figure
2.4: f17,f18). In the majority of subjects (twenty-one subjects, 88%), during the late
diastolic filling, a new isolated compact and more asymmetrically shaped vortex ring core
was formed at the ventricular basal level with a more dilated anterior side (i.e., the part
close to the aortic outflow tract) and more compressed posterior side (Figure 2.3: (d-f)),
reaching its complete formation while approaching peak late filling (Figure 2.4: f15-f17).
The A-vortex ring core was persistently present until the end of diastole without major
dissipation and was still located at the basal level (Figure 2.4: f18, f19). For the three
remaining subjects, (subjects A, B and C in Table 2.1) no vortex ring core was present
during late diastolic filling. Samples of the Lambda2-based detected peak early and late
diastolic formed vortex ring cores are shown in Figure 2.3 and are depicted together with
streamlines visualization of the velocity vector field in Figure 2.5. A time-sequence of the
3D vortex detection during the diastole is shown in Figure 2.4 (Additional file 1 and 2)1,2.
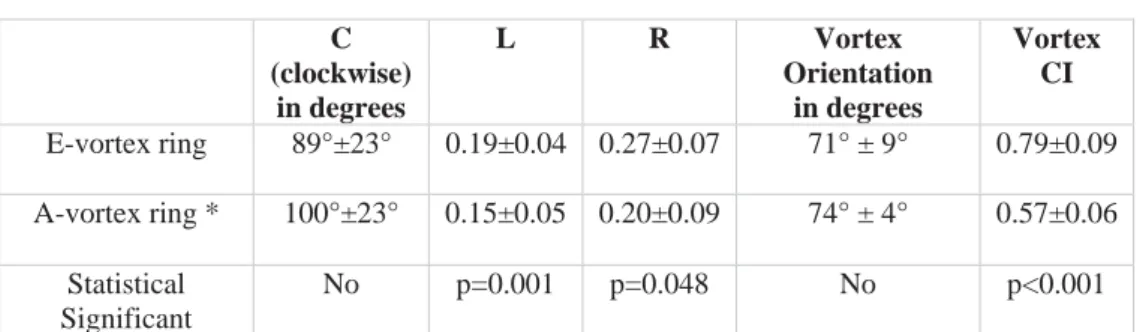
2.3.3 3D Quantification of LV vortex ring core parameters
The quantified CLR parameters are presented in Table 2.2. The centers of the 3D
vortex ring cores during early and late filling were located at the LV basal level, but the
rings during A-filling were significantly closer to the mitral valve compared to the rings
during E-filling (E-vortex L=0.19±0.04 versus A-vortex L=0.15±0.05; p=0.0001). The
centers of the vortex rings during both E- and A-filling were located in the anterior and
anterolateral segments (E-vortex: C=89±23°, A-vortex: C=100±23°; p=NS). A-filling
vortex center was located closer to the ventricle’s long-axis during A-filling compared to
E-filling (E-vortex: R=0.27±0.07, A-vortex: R=0.20±0.09, p=0.048). Both E- and A-
vortex ring cores were similarly orientated relative to the LV long-axis (E-vortex 71.0±9°
versus A-vortex 74±4°; p=NS). E-vortex rings were significantly more circular in shape
compared to A-vortex rings (E-vortex: CI=0.79±0.09, A-vortex: CI=0.57±0.06; p<0.001).
1
http://www.jcmr-online.com/content/16/1/78/suppl/S1
2
Figure 2.3. Results of Lambda2-based vortex core detection from a sample subject: (a)
Identified vortex ring core at peak early (a) diastolic filling with respective location to LV
(a), in top-down (b) and bottom-up (c) views. Similarly, identified peak late diastolic vortex
ring core is shown in (d), (e) and (f). The core of the peak early filling vortex ring appears
with a quasi-torus-like shape, more circular and symmetrical compared to the core of peak
late filling vortex ring which appears more elliptical in shape and asymmetrical with dilated
anterior side and compressed posterior side. Lambda2 isovalue threshold (ఒమ) = Ɋ was used to define the isosurfaces of vortex ring cores (with Ɋ as the ɉଶ average of voxels with
2
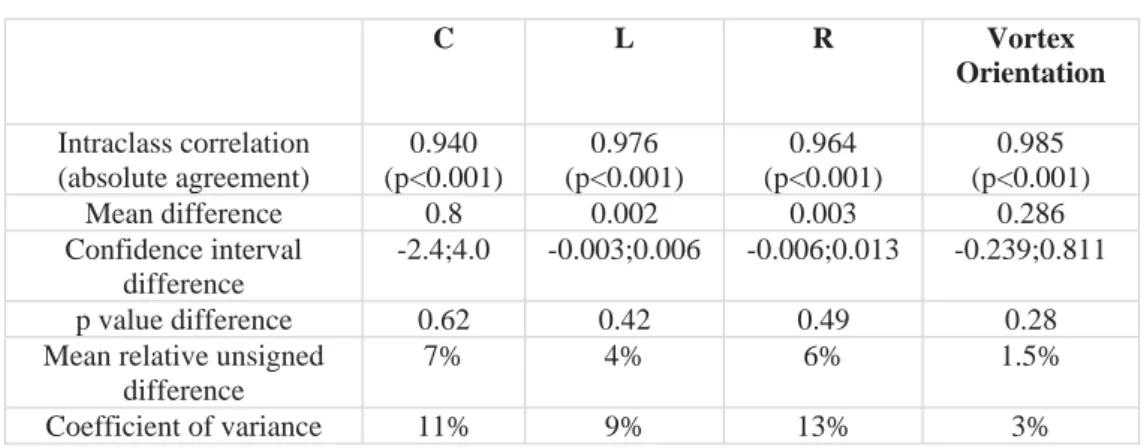
2.3.4 Inter and intra-observer variation
Results of inter- and intra-observer analysis for assessment of relative vortex core
position and orientation are presented in Table 2.3 and Table 2.4. Inter-observer analysis
revealed intraclass correlation coefficient higher or equal to 0.96 (all p<0.001), with mean
relative unsigned differences ranging between 1.5% and 7%, which was not statistically
significant different. The coefficient of variation ranged between 1% and 3%.
Intra-observer analysis showed intraclass correlation higher or equal to 0.97 (all p<0.001), with a
mean relative unsigned difference ranging between 0.5% and 3%, which was not
statistically significant different. The coefficient of variation ranged between 1% and 8%.
Table 2.1. Study characteristics
Characteristics 21 subjects Subject A Subject B
Subject C Total
age (years) 21±10 10 9 13 20±10
male/female 8/13 female male female 9/15
heart rate (bpm) 69±11 90 107 91 73±14
diastasis duration (ms)
108±73 22 0 0 95±77
E/A ratio 2.6±0.8 2.3 1.83 1.95 2.5±0.7
2.3.5 Vortex-Mitral flow association
The Spearman correlation coefficient between the shapes of the vortex ring
(CIvortex) and the MV inflow jet at the level of the annulus (CIMV) was R=0.66 (p<0.001).
The correlation coefficient between CIvortex with the shape of inflow jet at the tip of the
valve leaflets (CIMV_tip) was higher with R=0.83 (p<0.001) (Figure 2.6).
2.4. Discussion
To our knowledge this is the first work to provide standardized quantitative
characterization and comparison of the 3D LV vortex rings during both early and late
diastolic filling in normal subjects. Using retrospective-gated 4D Flow CMR and 3D vortex
core analysis, using the Lambda2-method, we observed the formation of a separate
the close correlation between the shape of the formed vortex ring and the shape of the
inflow area through both the mitral annulus and the tip of the opened MV leaflets.
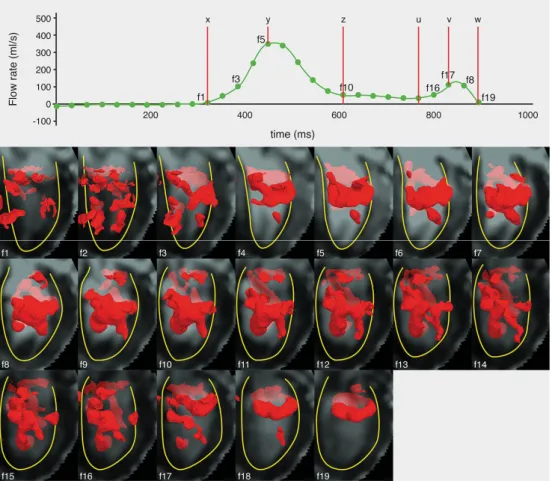
Figure 2.4. time-sequence of the Lambda2-detected 3D LV vortex structures (visualized as
isosurfaces in red color) over all acquired diastolic phases of a sample normal subject, with
E-filling onset (x), peak (y) and end (z), and A-filling onset (u), peak (v) and end (w).
Diastasis is the duration between z and u. Every dot in the cardiac curve corresponds to a
time point of the cardiac cycle in which a 4D Flow volume was acquired. With the start of
diastolic phase (f1), the start of the presence of a compact ring-like shaped vortex ring
during early- (f3) and late (f7) diastolic filling, the most developed vortex ring formed
during early-(f5) and A-filling (f18), the start of vortex stretching or elongation in direction
parallel to the LV long-axis (f10) and end of late filling while compact vortex ring is still
2
Table 2.2 Vortex quantification parameters
*In 21 subjects an A-filling vortex was observed. Data are presented as mean ± standard deviation
2.4.1 LV vortex ring formation and dynamics with emphasis on late diastolic filling
Several studies have demonstrated the presence of rotating flow distal to the MV
corresponding to a compact vortex ring during the early diastolic filling. This vortex
formation has been related to the normal shape and function of the LV and its alteration has
been suggested to be associated with pathologies of the left ventricle [1, 4-6, 9, 11, 18, 24,
25]. In agreement with previous studies, in all subjects a compact 3D vortex ring core was
identified distal to the mitral valve during the early filling phase of diastole [6, 9, 10, 18].
In previous studies, vortex analysis within LV flow has been primarily devoted to the early
phase of the diastolic filling [1, 4-10, 15, 21, 34, 35]. Discrepancies exist in literature when
defining or evaluating vortex formation during late diastolic filling, where CFD simulation
reports vortex ring formation [12-17] and in vivo studies report no vortex ring formation but only a single vortex (rotating flow) distal to the anterior MV leaflet [6, 9, 19-21, 36, 37]
or no vortex at all [18]. Some of the discrepancies among in vivo studies can be a result of limitations of the employed flow acquisition and/or analysis approach. 4D Flow CMR has
intrinsic advantages over other in vivo flow imaging modalities such as Doppler Echocardiography or 2D phase contrast CMR, by allowing acquisition of all three
directional velocity components and over the three spatial dimensions. Moreover, 4D Flow
CMR provides the feasibility of retrospective flow acquisition therefore allowing
acquisition of flow over both early and late diastolic filling phases instead of only the early
filling phase as with prospective flow acquisition. Previous studies have successfully
employed 4D Flow CMR to visualize and study LV vortex flow [6, 19, 22, 24-27]. In these
studies no explicit analysis of vortex ring formation during late diastolic filling have been
performed and relatively low temporal resolution (50-70 ms) were generally used [24, 27,
36] while higher temporal resolution of 30 ms was used in this study to help capturing flow C
(clockwise) in degrees
L R Vortex Orientation
in degrees
Vortex CI
E-vortex ring 89°±23° 0.19±0.04 0.27±0.07 71° ± 9° 0.79±0.09
A-vortex ring * 100°±23° 0.15±0.05 0.20±0.09 74° ± 4° 0.57±0.06
Statistical Significant
over the short duration of the late filling (five late filling phases were reconstructed on
average).
Table 2.3. Inter observer analysis for C, relative L, relative R and orientation of vortex ring
cores
C L R Vortex
Orientation Intraclass correlation (absolute agreement) 0.940 (p<0.001) 0.976 (p<0.001) 0.964 (p<0.001) 0.985 (p<0.001)
Mean difference 0.8 0.002 0.003 0.286
Confidence interval difference
-2.4;4.0 -0.003;0.006 -0.006;0.013 -0.239;0.811
p value difference 0.62 0.42 0.49 0.28
Mean relative unsigned difference
7% 4% 6% 1.5%
Coefficient of variance 11% 9% 13% 3%
In the current study, in agreement with CFD findings [12-17], in the majority of
subjects (twenty-one subjects, 88%), a compact vortex ring core formed distal to the mitral
valve during late diastolic filling. This ring formed at the basal level at the time when the
remnant of the dissipating E- vortex ring core was located more apically, indicating that the
A-vortex ring is a newly formed vortex as a result of the atrial contraction inflow and not
just a continuation of the E-vortex. The A-vortex ring core was asymmetrically shaped in
the anterior-posterior direction with a dilated anterior side, making most of the A-vortex
flow being located close to the left ventricular outflow tract. This supports the postulation
of Kilner et al. [6], about an expected role of the rotating flow beneath the mitral valve
during the A-filling in aiding the redirection of the late diastolic inflow from the left atrium
towards the left ventricular outflow tract, helping in an optimized ejection of blood.
Therefore, with the revealed consistent formation of compact late diastolic vortex ring in vivo, extending the analysis of diastolic vortex formation to the late diastolic filling (instead of currently being limited to early filling) might help providing more understanding of the
hemodynamics of the coupling between diastole and systole and associated pathologies.
This emphasizes the importance of using retrospective cardiac gating when aiming for LV
diastolic vortex flow analysis, where late filling phase can be acquired instead of the
prospective-gating where late filling phase is generally missing. The absence of vortex ring
2
related high heart rate and subsequent limited diastasis duration which might not allow
developing the ventricular pressure gradient required for vortex formation [1].
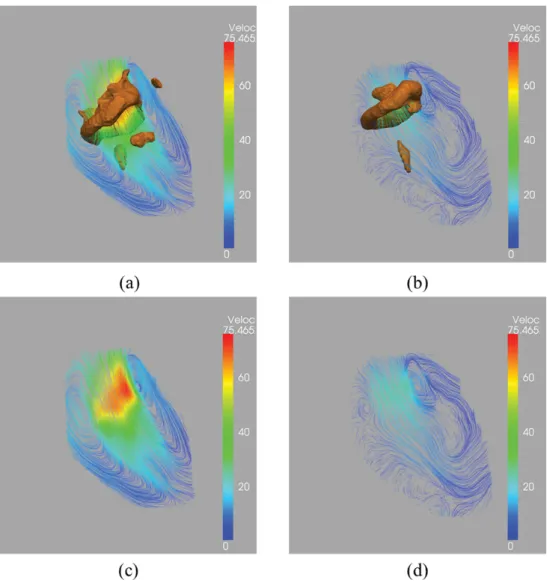
Figure 2.5. Streamline superimposed on vortex cores. Sample Streamline visualization of
cross-sectional view of LV flow during peak early filling (a) peak late filling (b) showing
pair of counter-rotating vortices. Streamlines are color coded (blue to red) based on
velocity magnitude. Same frames were superimposed with 3D vortex ring cores identified
using Lambda2-method and showing good overlap between the 3D Lambda2-detected
vortex cores and the cores of corresponding 2D streamlines’ counter-rotating vortices
2.4.2 Quantitative characterization of 3D diastolic vortex rings
Previous studies have successfully employed flow visualization techniques to
identify LV vortex flow [6, 19-23, 26], quantify vortex volume [24] or evaluate early filling
vortex formation [34]. However, to our knowledge, there have been no in vivo studies providing quantitative 3D characterization of the location and the shape of vortex flow
during both early and late diastolic filling phases.
Defining the true boundary of a vortex is challenging task, especially in 3D space,
as it is highly dependent on the identifier. Most in vivo studies identify a vortex based on visual assessment of the visualized flow [9, 11, 20, 21] which is generally an observer
dependent definition. Instead, vortex cores are generally regarded as a robust and well
localized approximation of a vortex [2, 3, 28, 38] and can provide more objective physical
definition of a vortex. Different methods can be used for vortex core identification [13,
28-30], however, the Lambda2-method is considered the most accepted 3D vortex
identification technique [1]. Vortex core analysis has been used before to detect vortices
inside the heart but mainly for visualization purposes [10, 13, 27, 29, 32, 39]. In this work,
we employ the 3D vortex cores identified using the Lambda2-method to derive quantitative
parameters to characterize normal vortex ring formation during both peak early and peak
late filling. In our experiments, following [32], Lambda2 isovalue threshold (మ) in the range of [1,6]Ɋ (i.e. ۹ ൌ ሾͳǡሿ,with Ɋ as the ɉଶ average of voxels with ɉଶ൏0 ) allowed identification of a separate compact vortex ring core (when detected) in all subjects. The
strong inter- and intra-observer agreements (Table 2.3 and Table 2.4) indicate the
robustness of the method with respect to Lambda2 threshold selection.
Table 2.4. Intra-observer analysis for C, relative L, relative R and orientation of vortex ring
cores
C L R Vortex
Orientation Intraclass correlation (absolute agreement) 0.980 (p < 0.000) 0.985 (p < 0.000)
0.988 (p < 0.000)
0.971 (p < 0.000)
Mean difference 1.7 0.000 0.001 0.46444
Confidence interval difference
-0.1;3.6 -0.003;0.003 -0.004;0.007 -0.279;1.208
p value difference 0.07 0.90 0.58 0.21
Mean relative unsigned difference
3% 2% 3% 1%
2
The vortex ring core is significantly closer to the mitral valve annulus
(longitudinal position) at the late filling peak compared to early filling, which can be
attributed to the lower velocity and shorter length of inflow jet during late filling compared
to early filling. The relatively closer position of the vortex ring core to the LV long-axis
(radial position) at the late filling, can be explained using the confirmed correlation
between shapes of the vortex ring core and the mitral valve opening, where a restricted
opening of the mitral valve during late filling results in a vortex core center closer to the
long-axis compared to full valvular opening at the early filling. Since vortex ring originates
from the inlet jet at the distal tip of the mitral valve (MV) leaÀets [1, 10, 13], vortex ring
forms parallel to the inclined MV orifice [40]. Therefore, in normal subjects, similarly
oriented MV orifice of early and late filling (relative to the ventricle’s long-axis) results in
similarly oriented vortex rings (i.e. similar vortex orientation planes). Consequently,
circumferential location (C), which is calculated using the vortex orientation plane, is
similar as well between vortex rings of both early and late filling. The strong correlation
between the vortex ring shape with the shape of the inflow area at the tip of the opened MV
leaflets confirms the relationship between the mitral valvular opening and shape of formed
vortex ring as reported earlier by CFD studies [4, 13]. To the best of our knowledge, this is
the first in vivo study to quantitatively confirm this correlation.
The relatively small variation between normal subjects in derived parameters
(Table 2.2) indicates good consistency of results. Therefore, the method defines normal
quantitative ranges for diastolic vortex rings and might in future help evaluating whether
changes in valve morphology or ventricular dilatation alters the location and shape of the
formed vortices.
2.4.3 Clinical implications
The suggested LV-normalized vortex parameters might help to provide more
insights about the normal vortex formation and provide normative parameters to compare
the 3D vortex flow between controls and patients. This could help to understand the
hemodynamics of patients with impaired LV relaxation and restrictive filling, where the
E/A ratio is abnormal. In addition, the close correlation found between vortex formation
and the flow at the tip of the opened mitral valve leaflets suggests that patients with
impaired leaflet function, as can be seen in patients with left ventricular dysfunction [41]
which possibly reduces efficiency of intra-cardiac flow. Therefore, further study is
warranted to investigate the effect of mitral valve surgery on vortex formation during LV
filling.
Figure 2.6. Correlation between the shape of the formed vortex ring cores (CI vortex) and
the shape of the inflow area at the level of both the mitral annulus (A) and the tip of the
opened MV leaflets approximated as 1 cm below the annulus (B).
2.4.4 Study limitations
Limitations of this study include a relatively small number of healthy subjects and
lack of comparison with patients. However, an objective detection of possible anomalies in
the vortex flow of patients should be preceded by finding reliable quantitative measures
defining the reference normal vortex flow. The current study was performed in a relatively
young population (age range 9 – 44 years). Global diastolic function parameters, as the E/A
ratio remain relatively Table 2.2 during the second, third and fourth decade of life [42],
which explains why we did not observe age related differences. As diastolic function is
known to decrease later in life [43] future studies are required to compute normal values in
an elderly population. Limitations of 4D Flow CMR include the relatively long scan times
(typically between 8-10 minutes with heart rate 60-80bpm), and the need of averaging the
data over several cardiac cycles. This time-averaging would potentially result in smoothing
the low scale flow structures and does not, generally, account for flow variations due to
heart rate variations. In this study, a relatively low spatial CMR resolution of 2.3×2.3×3-4
mm3 was used. However, it was our aim to evaluate large scale vortex ring cores which are
2
higher resolution of 2.3×2.3×3 mm3 was used, which did not result in significant different
findings from the other subjects. Further methodological and quantitative analysis on the
effect of acquisition resolution may be helpful but was beyond the scope of this work.
Identified Lambda2-based vortex cores could not be used for volumetric measurements
(e.g. vortex volume or size) as applying different Lambda2 isovalue thresholds can result in
different volumes for the same vortex core. Therefore, the vortex parameters derived in this
study were chosen as not to be dependent on vortex volume. 4D Flow data was acquired
using free breathing scans and no motion compensation was applied. Nevertheless, no
motion artifacts were visually observed in the velocity data, and since all subjects
underwent the same scan protocol, potential inter- and intra-subject effects on the
measurements might be assumed to be similar among all subjects.
2.5. Conclusion
In summary, this is the first in vivo study using 4DFlow CMR to confirm previous CFD findings of vortex ring formation during late filling and to provide standardized
parameters that allow quantitative characterization of vortex flow during both early and late
left ventricular filling. The derived quantitative parameters provided consistent
measurements within the studied population and strong correlation was found between the
shape of the formed vortices and the shape of the inflow area at the level of both the mitral
annulus and the tip of the opened MV leaflets. This study provides reference parameters
defining normal vortex flow, which may allow objective quantitative evaluation of vortex
flow in patients with cardiac disease.
Acknowledgements
We thank Pieter van den Boogaard for CMR acquisition and Gerrit Kracht for graphics
design.
2.6. References
1. Kheradvar, A. and G. Pedrizzetti, Vortex formation in the cardiovascular system. 2012, Springer. p. 45-53.
2. Lim, T. and T. Nickels, Vortex rings, in Fluid vortices. 1995, Springer. p. 95-153.
3. Shariff, K. and A. Leonard, Vortex rings. Annual Review of Fluid Mechanics, 1992. 24(1): p. 235-279.
4. Pedrizzetti, G. and F. Domenichini, Nature optimizes the swirling flow in the human left ventricle. Physical review letters, 2005. 95(10): p. 108101.
5. Bellhouse, B., Fluid mechanics of a model mitral valve and left ventricle. Cardiovascular research, 1972. 6(2): p. 199-210.