UNEMPLOYMENT CHANGE AND HOMICIDE: AN EXPLORATION OF THE NATIONAL VIOLENT DEATH REPORTING SYSTEM
Jerrod Allen Nelms
A dissertation submitted to the faculty of the University of North Carolina at Chapel Hill in partial fulfillment of the requirements for the degree of Doctor of Philosophy in
the Gillings School of Global Public Health (Epidemiology).
Chapel Hill 2013
iii Abstract
JERROD NELMS: UNEMPLOYMENT CHANGE AND HOMICIDE: AN EXPLORATION OF THE NATIONAL VIOLENT DEATH REPORTING SYSTEM
(Under the Direction of David B. Richardson)
Two studies were undertaken as part of this project. We used homicide data collected by CDC’s National Violent Death Reporting System (NVDRS), a state-level active surveillance system that provides data on all violent deaths in 16 US states. Data were obtained for 2003-2009. We used the NVDRS, unemployment data from the Bureau of Labor Statistics (BLS), and Current Population Survey (CPS) to estimate associations between unemployment level and homicide through three research aims.
First, we used all NVDRS homicide cases to examine the association between monthly change in unemployment and homicide rates. Information on homicides and population estimates were analyzed by Poisson regression to estimate rate ratios as a function of change in unemployment level over month and quarter in which a homicide event occurred (Aim 1). After adjustment for age, gender, race, median household income, and population density, county-level homicide rates increased an average of 2% (Rate ratio = 1.02; 95% CI: 1.00 – 1.05) per percentage point increase in
iv
We used a case-crossover design to examine the change in risk of experiencing a workplace homicide as unemployment levels changed over a 1-month period (Aim 2). We examined unemployment change data for the month homicide event occurred (case period) and the two months before and after the case period (control periods).
Conditional logistic regression models estimated the unemployment change-workplace homicide association across strata of community and victim-level characteristics.
Third, we assessed heterogeneity in the association by characteristics of the victim and workplace violence type (Aim 3). A 1-percentage point increase in
v
ACKNOWLEDGEMENTS
I am deeply grateful to my loving wife Jamie and daughters Audrey and Lucy, for embracing this challenge with me. I am eternally grateful for their companionship, and for their love as I confronted this process. They have shown the utmost patience and care while I have been working tirelessly to complete this document and the subsequent manuscript(s). I make no mistake in mentioning my family first, because they were, at times, the only thing that kept me from becoming a workplace casualty myself. Again, thank you to my wife to sacrificing countless hours; for taking the kids away to Kentucky while I worked; and for being patient with me as I slowly brought this project to a
conclusion. She should rest assured that I will never undertake such a degree program or commitment again.
I would like to thank my committee members, Drs. David Richardson, Steve Marshall, Carri Casteel, Whitney Robinson, and Mr. Scott Proescholdbell, for their diligence and continued support of me during this process. I am especially grateful to David for his patience and for teaching me how to analyze the NVDRS data using the Poisson and Case-crossover analyses that you (the reader) will learn about throughout this document. I would also like to thank Dr. Andres Villaveces, who, through an
unfortunate oversight, was not included as an official committee for the final dissertation document. He was instrumental in the proposal process and provided ideas that
vi
I appreciate the help of Nancy Colvin, Carmen Woody, and the other Student Services staff in the Department. It is clear that their lives are devoted to progressing the students in the Department of Epidemiology and the School of Public Health. Any time I have had a question or concern, it has been answered openly. I appreciate their patience with me through the Dissertation Committee Selection and finalization process and for giving me clear direction on the dissertation process.
Also, I express gratitude for Dr. Vic Schoenbach for allowing me to be a teaching assistant in EPID 600. The funding received through that semester (Fall 2011) kept me going. The teaching experience I gained from that course will be invaluable in the development of future graduate-level epidemiology courses that I may teach.
Finally, I wish to acknowledge Deb Karch, Lead Behavioral Scientist at CDC/NCIPC/DVP/ESB. Her help in securing the NVDRS data was critical to my success and completion of this document (and, of course, subsequent manuscripts). Without the help and support of all those listed above, I am quite certain that my graduation form UNC and the completion of this document would not have been possible. Thank you all. Please enjoy!
vii
TABLE OF CONTENTS
LIST OF TABLES ... x
LIST OF FIGURES ... xii
LIST OF ABBREVIATIONS ... xiii
Chapter 1: Overview ... 1
I. INTRODUCTION ... 1
Chapter 2: Literature Review ... 2
II. BACKGROUND AND SIGNIFICANCE ... 2
A. Introduction ... 2
B. Community-level stressors and intentional injury ... 2
C. Unemployment as a community stressor ... 4
D. Effects of unemployment on human psychology ... 5
E. The effect of the economy on violent acts ... 7
F. Defining Workplace Violence ... 9
1. Typology of workplace violence ... 11
G. Worker characteristics and workplace homicide ... 15
H. The use of unemployment in epidemiological studies ... 16
1. Population density and the unemployment-homicide association ... 17
I. Economic factors and homicide in the workplace ... 18
J. Gaps in the current literature ... 20
viii
L. Conclusion ... 23
Chapter 3: Specific Aims ... 28
III. STATEMENT OF SPECIFIC AIMS ... 28
Chapter 4: Methods ... 32
IV: METHODS... 32
A. Overview of Methods... 32
B. Study Designs ... 33
C. Study Populations ... 33
D. Data Sources ... 33
1. National Violent Death Reporting System (NVDRS) ... 34
2. Bureau of Labor Statistics – Local Area Unemployment ... 39
3. United States Census Data – Current Population Survey ... 41
F. Statistical Methods ... 47
1. Poisson regression ... 47
2. Case-crossover ... 52
3. Quantification of bias in case-crossover study ... 61
H. Protection of data and quality control ... 63
Chapter 5: Descriptive Analyses ... 79
V. Descriptive Analysis of the NVDRS data set ... 79
A. Variable Completeness – NVDRS data set ... 79
B. Descriptive Analysis of Poisson Data ... 80
Chapter 6: Aim 1 Results (Manuscript 1) ... 90
ix
A. Introduction ... 90
B. Methods ... 92
C. Results ... 95
D. Discussion ... 96
E. Conclusion ... 100
Chapter 7- Results for Aims 2 and 3 (Manuscript 2) ... 106
VII: Case-crossover analysis of unemployment change and workplace homicide using National Violent Death Reporting System data ... 106
A. Introduction ... 106
B. Methods ... 108
C. Results ... 116
D. Discussion ... 118
E. Conclusion ... 123
Chapter 8: Conclusion and Synthesis ... 133
VIII: Conclusions ... 133
A. Summary ... 133
B. Discussion ... 134
C. Future Research Direction ... 142
D. Public Health Implications ... 143
E. Conclusion ... 144
x
LIST OF TABLES
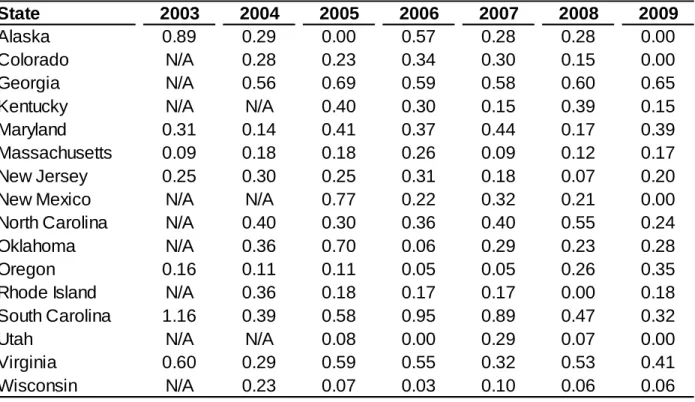
Table 2.1: Workplace shootings by industry………...25 Table 4.1 NVDRS states and years of surveillance………..65 Table 4.2: NVDRS cases by surveillance state………..66 Table 4.3 Variability in 1-month and 3-month unemployment level changes
by state, 2003-2009………....67 Table 4.4: Data elements needed for project completion by aim and
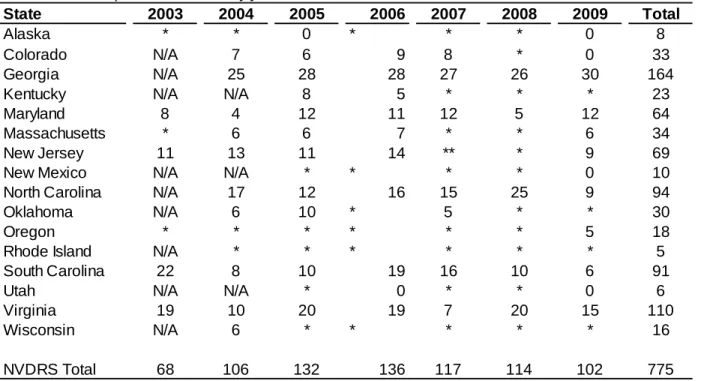
collection method. ………..68 Table 4.5: Analysis variable recodings for analysis data sets……….…69 Table 4.6: NVDRS workplace homicide victims before and after exclusions…..71 Table 4.7: Workplace homicides by year and state……….….72 Table 4.8: Workplace homicide classifications by workplace homicide
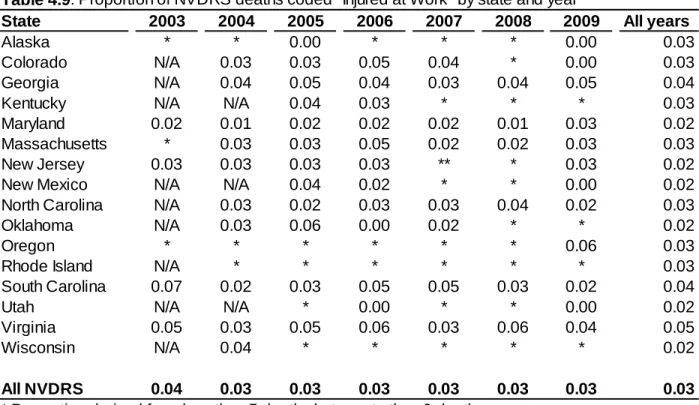
Typology and rater……….73 Table 4.9: Proportion of NVDRS deaths coded “Injured at Work by state
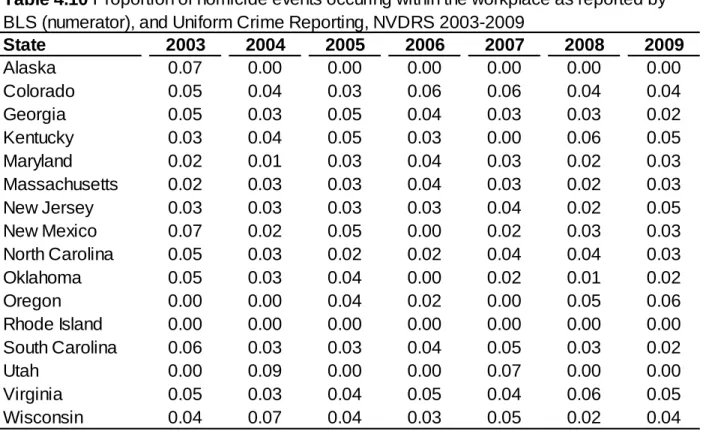
and year………...74 Table 4.10: Proportion of homicide events occurring within the workplace
As reported by BLS (numerator), and Uniform Crime Reporting,
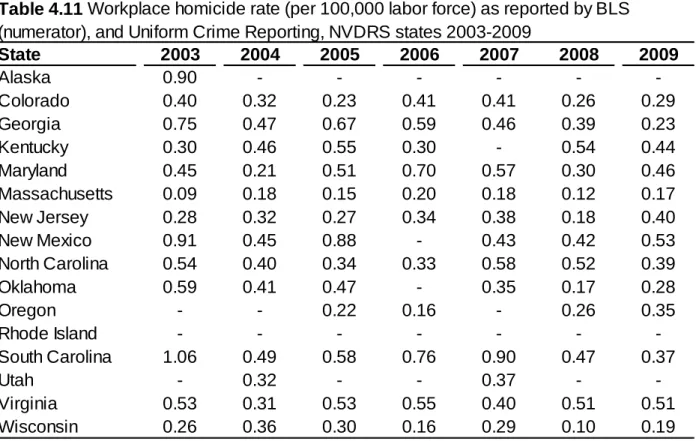
NVDRS 2003-2009………...75 Table 4.11:Workplace homicide rate (per 100,000 labor force) as reported
by BLS (numerator), and Uniform Crime Reporting NVDRS
states 2003-2009……….….76 Table 4.12: Workplace homicide rate (per 100,000 labor force) within
the NVDRS analysis data set, 2003-2009………77 Table 4.13: Differences between rates reported by BLS and Uniform
xi
Table 5.3: Crude homicide rates (per 100,000) by NVDRS state and month of surveillance………..85 Table 5.4: Age-, gender-, and race-stratified crude homicide rates (per 100,000) in NVDRS………86 Table 5.5: Age-specific homicide rates (per 100,000) by race and gender……87 Table 5.6: Crude homicide rates by county-level economic factors………..…..88 Table 5.7: Race- and gender-specific homicide rates by county-level median household income and population density categories………....89 Table 6.1: Variability in 1-month and 3-month unemployment level changes by state, 2003-2009……….…….102 Table 6.2: Homicide rates by unemployment level change within the NVDRS………...103 Table 6.3: Homicide rates by absolute unemployment level in the NVDRS……….104 Table 6.4: Model estimates, unadjusted, and multivariable adjusted rate ratios for fluctuations in unemployment level change………..…105 Table 7.1: Workplace homicides by typology………....125 Table 7.2: “Unadjusted” odds ratios of workplace homicide by 1-month
unemployment level change………127 Table 7.3: Assessment of effect modification and heterogeneity of the odds ratio of unemployment change on homicide in the case-crossover
xii
LIST OF FIGURES
Chart 1: Scatter plot of monthly unemployment rates by monthly
xiii
LIST OF ABBREVIATIONS
AK Alaska
BLS Bureau of Labor Statistics CA California
CDC Center for Disease Control and Prevention CI Confidence Interval
COFI Census of Occupational Fatal Injuries
CO Colorado
CPS Current Population Survey
GA Georgia
KY Kentucky
LRT Likelihood Ratio Test
MD Maryland
MA Massachusetts
NVDRS National Violent Death Reporting System
NJ New Jersey
NM New Mexico
NC North Carolina
OK Oklahoma
OLS Ordinary Least Squares
OR(a) Oregon – used solely in naming the state and for descriptive purposes. OR(b) Odds ratio – used on tables in the case-crossover analysis
xiv RR Rate ratio
SC South Carolina
UT Utah
US United States
VA Virginia
WHO World Health Organization
WI Wisconsin
1
Chapter 1: Overview I. INTRODUCTION
Homicide is the second leading cause of violent death in the United States, behind only suicide. Homicide in the workplace is consistently among the top four causes of work-related fatal events for workers in the United States. Homicide
events can negatively impact neighbors, cities and towns, and workplaces. Homicide has been linked to various aspects of the community in which one lives, including the racial and ethnic composition, household income, population density, and family structure (1-6).
Unemployment has long been considered a community stressor that contributes to the commission of violent acts at all levels of social aggregation
(individual, familial, community, county, etc.) (4-6). However, attention has only been given to unemployment measured at a certain point in time. There is need to explore how a change in the unemployment level over time acts to affect homicide risk at the community-level.
2
Chapter 2: Literature Review
II. BACKGROUND AND SIGNIFICANCE A. Introduction
This dissertation examined the association between county-level unemployment and homicide in the general population and in the workplace. This chapter reviews the literature on community level stressors, particularly unemployment, and the risk of crime, violence, and intentional injury. We explore the literature associated with associations between economic influences (such as unemployment) and the commission of violent acts whether toward oneself or others. We conclude this chapter by identifying gaps in the current understanding of the association between unemployment and homicide.
B. Community-level stressors and intentional injury
The use of community-level variables in the examination of individual outcomes is commonplace in a variety of studies that run the gamut of the social sciences. Higher level factors, such as community characteristics and stressors impact (whether it be positively or adversely) lower level outcomes such as personal achievements and proper healthy practices. The influence of community-level
3
employed in widespread use, especially when the outcome of interest and its observed and unobserved determinants have a hierarchical structure (7).
Many community-level factors have been associated with stress and violence, including county and community poverty levels, median household income, average age of community members, racial composition, and education levels (1-6).
Neighborhood and census blocks that have younger, less educated, and
impoverished populations are generally more likely to have workplaces at high risk for violence (8). The same is true for neighborhoods and block groups with higher percentages of Hispanic and non-US born individuals and families, high single-parent, female-headed household, and homes in which children under the age of 18 are not living with the parents. Alternatively, areas whose populations are wealthier, more educated, and less diverse (containing mostly Caucasians) are much less likely to have workplaces that are at higher risk of violence (8).
Emergencies and natural disasters also introduce stress on the community level, and have been found to be associated with increased risk of intentional injury. Keenen et al, examined the incidence of inflicted traumatic brain injury in children after Hurricane Floyd in North Carolina from 1998 through 2001, and found that inflicted brain injury on children increased in the counties most effected by Hurricane Floyd during the six months following the disaster in comparison to the same region pre-disaster (Rate Ratio 5.1, 95% CI: 2.0 – 59.4). Their findings are suggestive of prompt changes in intentional injury that may occur promptly after a stressful
4
offer information that suggests that communities that are most affected by extreme social situations exhibit the highest rates of psychiatric morbidity, which may lead to the commission of drastic acts such as the infliction of intentional injury (9-11).
C. Unemployment as a community stressor
Unemployment is a well-known and extremely well documented community-level stressor. A common method used by many employers to respond to
fluctuations in market demand and economic stress is to temporarily dismiss or “lay off” workers without pay (12-15). In recent decades, most workers who have been laid off have subsequently been rehired by their original employers (12,16).
However, neither employees nor employers can predict when or if work will resume. In the time between their dismissal and return to work, the employee may contribute to the unemployment level. When layoffs occur, unemployment levels tend to
increase.
From January 2007-2010, as many as 8 million jobs were lost in the United States. During that time 83,301 separate mass layoff events (work dismissals in which at least 50 employees are temporarily dismissed from work) and workplace closings occurred. These layoffs accounted for almost 90% of the total job loss during that time (17). Every US state was affected by this recession, causing sharp fluctuations in local and regional unemployment levels, (18-22). As of May 2012, the national unemployment level had yet to return to the pre-recession levels in 2007 (May 2012 level was 8.2%; before 2007 the yearly average was 4.6%) (23-24).
Unemployment does not occur uniformly among the United States’
5
than Caucasians. Hispanics usually experience unemployment 1.5 times that of other adults, while blacks, especially black men, are known to experience unemployment levels two to three times the rate among non-minorities.
As minority workers constitute a large share of blue-collar workers, and blue collar workers tend to experience layoffs more than white collar workers,
unemployment levels among them are increased when mass, nationwide recessions occur. Furthermore, minority workers remain unemployed for longer periods or choose to relocate. (20-24).
D. Effects of unemployment on human psychology
Employment status, and unemployment in the household or community in which a person lives, play a role in the psychological state of the individual and the family unit. A considerable body of research supports the assumption that
aggressive behavior in a society elevates with increasing levels of unemployment (26-27). This connection is based on the idea that aggression is an immediate reaction to frustration of the pleasure principle (28). Dollard et al. postulated that frustration leads to aggression and, in turn, aggressive behavior can be traced back to a frustration (29-31). Early evidence of frustration with economic stimulants and aggression found significant negative correlations between cotton prices and the lynching of blacks in the south of the United States between 1882 and 1930.
6
The relationship between unemployment and aggression is often described by the parabola function; that is, that at a certain maximum point, the positive
relationship between unemployment and aggression is reversed because those who still hold jobs control their aggressive behaviors so that they do not lose them (33). Substantial support has been found for the assumption that aggressive behavior is more common among people who were laid off (34-35). We posit that aggression is a key component in the causal paths leading to homicide. Aggression spills over into violence, which leads to purposeful killing of others.
7
E. The effect of the economy on violent acts
Unemployment, especially when occurring at high levels, has been
associated with feelings of desperation and even rage (38-39). Such feelings often lead to inter- and intra-personal violence (34-36, 40-41). It is theorized, and
supported in the literature, that the personal financial impact and uncertainty caused by unemployment can affect individuals and families in a way that can trigger a violent act (42-47). Unemployment is also known to be associated with intimate partner violence, especially when partners live in the same household (40, 41; 45, 48). It is also associated with familial homicide (killing of one’s family members or entire family unit) and abuse of children (43, 49, 50).
Many studies have examined fatal violence as being associated with rising unemployment rate (42, 51-67). Homicide, the killing of a human being by another person (68), has also been associated with rising unemployment levels across all administrative units (census tract, county, state, and nation) and among all races and ethnic groups (69-83).
8
suicides per 100,000 person-years lower when economic activity was at its peak, as opposed to when activity was at its lowest point. Studies of unemployment’s effect on suicide warrant attention because the same type of depression-aggression mechanism can trigger these events (84,87,90,94).
Previous studies of homicide and violent acts have focused on the absolute level of unemployment. Studies have found a positive association between
unemployment and homicide, suicide, and other forms of violence against people (38, 74, 77, 79, 82-87). The authors of these studies conclude that it is plausible that homicide rates would increase as unemployment levels fluctuate. However, these studies have only measured unemployment across a gradient of rates and
exclusively in cross-sectional or time-series designs (38). No study has examined the change in unemployment over time as a main exposure. This dissertation project attempts to address this gap by examining unemployment change as the main exposure and, we hypothesize, will address the temporal relationship between the onset of unemployment and homicide as well as magnitude to which varied levels of unemployment affect homicide risk. Studying the magnitude of change will bring valuable insights into the literature that will help define unemployment’s effect on the incidence of homicide and other violent acts.
9
disease, transport accidents, and homicide. In all but one of the eight studies, all-cause mortality rose during an economic crisis and fell to a lower rate once the crisis subsided. All of the six studies that reported data specific to homicide indicated that homicide rates rose during economic crisis and fell during times of prosperity (100).
The authors concluded that psychological factors, such as increased levels of stress or depression, are important indirect causes of the excess mortality observed during periods of economic crisis. Such alterations in the psychological status of individuals in periods of economic crisis may derive from uncertainty about the future, as well as from need for adaptation to many changes in life, including work aspects. This conclusion builds on prior work related to unemployment and general uncertainty and mortality.
Hall et al, studied black homicide victims and suspects, in which they examined unemployment as a conduit to self-hate and homicide. Their results suggest that age, unemployment, and prior felony convictions were significant in the explanation of self-hate, aggression, and homicide. The most robust variable in the study was unemployment, black-on-black homicides were 2.5 times more likely to involve victims who were unemployed at the time of the homicide (34).
F. Defining Workplace Violence
Considerable literature has focused on the effects of unemployment and other economic variables on depression, aggression, crime in general, person-to-person violence, and specifically homicide and suicide. One type of violence that has
10
injury has been addressed in the literature of several academic disciplines, including; medicine (101-106), public health (105-110), health and safety (111-117), labor and human resources (118, 119), business and economics (120-122), criminal justice (123-127), and the social and behavioral sciences, including sociology and
psychology (128-133). Several epidemiological studies have addressed violence and homicide in the workplace in the past two decades (101-103, 105, 134-136).
Homicide is the second leading cause of death on the job for workers in the United States (43). Most of these assaults occur in service settings such as
11
working alone, guarding valuables or property, and dealing with violent people or volatile situations.
In a case-control study of workplace homicide risks, Loomis, et al. found that workplaces having only one worker were at nearly three times the risk of homicide as those with more than one worker (OR = 2.9, 95% CI: 1.2, 7.2). The use of a single nighttime worker in occupations where money is exchanged (e.g. a third shift clerk in a convenience store or gas station, working by themself) resulted in near 400% increase in risk. (OR = 4.9, 95% CI: 2.7, 8.8) (146).
Police officers, corrections officers, and taxi drivers are victimized at the highest rates (138).Approximately 41 percent of all workplace homicides occur in the retail and leisure/hospitality industries (24% in retail, 17% in leisure/hospitality). Most workplace homicides take place in lower wage earning industries, where money is exchanged, where service often takes place into the evening and morning hours, and most often, where workers are alone or separated for lengths of time (1-4) (as with the hotel and transportation industries) (146). The literature suggests that the occurrence of homicide in the workplace is an opportunistic event that occurs at the culmination of a set of component causes, including, but not limited or restricted to, high or rising unemployment and joblessness (1-4, 94-99, 134-136).
1. Typology of workplace violence
12
of workplace violence (1-5), an increasing number of researchers are beginning to examine the impact and harm caused by repeated psychological violence, such as sexual harassment, bullying and mobbing (a phenomenon of systemic hostile
communication directed at one individual by a group of individuals resulting in social isolation of the targeted individual) (55-58). Psychological violence, especially
repeated psychological violence can result in retaliatory actions against the
perpetrator, such as murder or assault, or even the infliction of harm on one’s self, from the shame or emotional toll of being repeatedly abused (74, 84 130-132). The emergence of bullying-related suicide has come to the forefront via television news broadcasts and special programming, electronic media, and print. It is currently being addressed in the literature (30, 59, 61, 128)
In March of 1995, California OSHA released a landmark document that established guidelines for workplace security. Within that document, they defined three specific types of workplace violence. Each “typology of workplace violence” describes the relationship between the perpetrator and the target of workplace violence. Initially, only the first three types of workplace violence were defined in the Cal/OSHA (139). Later, a fourth type was added by the FBI. The resulting four types are detailed below:
Type 1 - No relationship to workplace: Type 1 workplace violence is
13
Type 2 - Customer/client/patient: Type 2 encompasses violence directed at employees by individuals legitimately using services of the workplace (e.g.,
customers, clients, patients, students, inmates). Type 2 violence often occurs in healthcare and social services, where the patient is the perpetrated of the violence.
Type 3 - Co-Worker: This type includes violence against coworkers, supervisors, or managers by a present or former employee. An example of this would be an attack on a supervisor or co-worker as a result of a dispute that may or may not be directly related to the job itself.
Type 4 - Personal: This type of workplace violence is defined by violent acts perpetrated by someone who is not an employee, but has a personal relationship with an employee. This type can refer to domestic violence situations and is usually perpetrated by an acquaintance or family member while the employee is at work (139, 140).
Some of the same unemployment-related contextual factors that lead to homicide and suicide in the general population have also been seen to predict homicide in the workplace. All four types of workplace homicide have been found to be associated with economic cycles and unemployment. Workplaces at higher risk for type 1 and type 2 workplace homicide such as bars and nightclubs, convenience stores, pawn brokers, and liquor and jewelry stores, and hotels are all at greater risk of with greater unemployment (3, 8, 54, 103, 132, 134-135,). Many of these
14
incomplete family units, all of which are factors that can exacerbate the
unemployment-homicide association. Mobile business units such as taxis are also commonly utilized in these types of areas, and most often are operated by
individuals who live within high-risk zones. Taxis are at extremely high risk for types 1 and 2 workplace homicide (141). A number of risk factors are known to influence the occurrence of types 1 and 2 workplace violence. They include: contact with the public; exchange of money; delivery or passengers, goods, or services; working alone or in small numbers; working late at night or during early morning hours; and working in high-crime areas (2, 103).
Type 3 workplace violence and homicide are more common in industries that employ a larger number of workers. Such industries include manufacturing,
construction, small business, office settings, and other white collar occupations. Type 3 workplace violence can also be triggered by unemployment. When an individual who is already under stress receives news that their job has abruptly ended, or, in some cases, that another individual has received a promotion or bonus in their stead, aggression can result. Most often, in the extreme case of job loss, workplace homicide can result (52-55, 61, 71-74). This is the very essence of type 3 workplace homicide.
15
workplace setting. Hate crimes, and gang-related violence are much more rare in the workplace. No known association has been made between their occurrence and unemployment or other commonly known economic risk factors (46).
G. Worker characteristics and workplace homicide
Recent analyses of national and state surveillance data report differing rates of workplace homicide between genders, with men having homicide rates that are 3.1 to 5.8 times higher than women (111, 149). However, because women comprise a lower percentage of the workforce than do men, homicide makes up a larger percentage of the total work-related injury deaths among women. Approximately 10% to 30% of all male work-related fatal injury deaths are the result of homicide, while 40% to 57% of female work-related deaths are due to homicide (111, 143). Therefore, females are more likely to be murdered on the job than their male counterparts, making workplace homicide the second leading cause of death for female workers. As a result of higher homicide rates, female workers also
experience a higher relative risk of dying due to intentional workplace injury compared to unintentional injuries (131, 144). These observed differences in occupational homicide by gender reflect variations in employment patterns by gender as well as hazards by industry.
non-16
Hispanic Caucasian workers. This may be due to the occupational choices made by certain groups (e.g. taxi drivers from one nationality, gas station and market
owner/operators from another). Asian, Native Hawaiian, or Pacific Islanders accounted for over half of the workplace homicide victims, with a rate of 1.83 per 100,000, followed by black workers and Hispanic or Latino workers (6).
Older workers are generally at a higher risk for workplace homicide, especially workers aged 65 and older (111). Reported age-specific work-related homicide rates ranged from 0.4 to 0.9 per 100,000 employed until age 65 when the rates increase to 1.7 to 1.9 per 100,000. Younger workers (those aged 17 years and younger) also appear to have elevated rates (147). Workplaces with only male employees (OR = 3.1, 95% CI: 1.5, 6.5) or with black or Asian employees were also more likely to be killed at work (147).
H. The use of unemployment in epidemiological studies
Unemployment, when measured at an aggregate level as opposed to a description of the employment status of an individual, typically is a measure of the joblessness in a given geographic area, expressed as a percentage. Many studies of the effect of economic conditions on homicide, suicide, and crime have considered the unemployment level in the community and have described these associations for groups defined by demographic factors (34, 35, 50, 52, 67).
Despite its extensive use as a regressor and a covariate, the absolute
17
exposure is even more rare (89). Some studies have examined economic factors such as the change in GDP (65, 96), structural damage to property (broken windows), household income levels (67), and the number of welfare and/or single mother homes within a Block Group or other well-defined geographic region (35, 71-74, 76, 136) as the main explanatory variable. However, none have examined unemployment or unemployment change. This study will examine the change in unemployment over time as the main exposure in an epidemiological study of homicide.
1. Population density and the unemployment-homicide association Population density has been known to modify the association between unemployment level and homicide (65, 67, 136). Several studies have stratified unemployment and homicide rates by population density (persons per square mile/kilometer) and have found it to be highly correlated with urban living, higher percentages of minorities, familial instability, and below average household income, all of which have been associated with higher levels of unemployment and higher homicide rates. Typically, Block Groups and counties that are more densely
populated have higher rates of homicide, especially low-income areas with younger populations of minority racial and ethnic groups. They are more susceptible to street crime and gang activity and constitute a more racially diverse portion of the
18
I. Economic factors and homicide in the workplace
Two notable studies examined economic factors and homicide in the
workplace or the susceptibility of a workplace to homicide. The first study by Ta et al included unemployment as part of a theoretical construct used in the prediction of homicide (8). In that work, Ta et al, examined the socioeconomic factors associated with the presence of workplaces belonging to industries reported to be at high risk for workplace homicide. In this study, the proportion of high risk workplaces was computed following spatial linkage of individual workplaces to 2000 U.S. Census Block Groups (n = 3,925). The study used exploratory factor analysis to summarize thirty census-derived socioeconomic variables into three distinct groups, namely poverty/deprivation, human/economic capital, and transience/instability. Associations between said variables and the propensity of a Block Group to contain those
workplaces at higher risk for worker homicide were examined.
The study found that high-risk workplaces were more likely to appear in Block Groups with more poverty/deprivation or transience/instability and less
human/economic capital. Each of the three summary social factors was associated with the proportion of workplaces in high-risk industries. Employment, in this case, was grouped into the poverty/deprivation factor. The unadjusted odds of having some, compared to none, proportion of high risk workplaces was greater for Block Groups with above median levels of poverty/deprivation (OR = 1.52, 95% CI: 1.28, 1.80). Contrastingly, above-median levels of human/ economic capital was
19
held in the adjusted model with only slight derivation (136).
Though this study does not pertain directly to the association between unemployment and workplace homicide, it does use unemployment as part of a construct used to model the association. The finding of an association between higher poverty and high-risk workplaces being within a Block Group suggests two possibilities: 1) the possibility that unemployment could affect the occurrence of homicide in the workplace, and 2) the possibility that poverty and income could serve as covariates when modeling the unemployment-workplace homicide association.
In a separate study, a significant relationship between unemployment level and workplace homicide was also reported (51). The study used data on
occupational assaults from the BLS Census of Fatal Occupational Injuries to calculate the correlation between unemployment rates and occupational homicide rates. Monthly unemployment rates for the regions were correlated with the monthly occupational homicide rates for a four-year analysis period including all year from 1997 to 2000.
The study found a significant correlation coefficient of .258 (P <.0001) and concluded that a relationship exists between unemployment and occupational homicides. Increases and decreases in unemployment rates were positively correlated to increases and decreases in the occupational homicide rates.
The scatter diagram in Chart 1 from Janicak, 2003 depicts the relationship between the monthly occupational homicide rates and the unemployment rates. An
20
indicated that the South Region experienced the highest rate workplace homicide rate, with .059 deaths per 100,000 employed persons and the Midwest Region experienced the lowest rate, with .033 deaths per 100,000 employed persons. The overall average monthly workplace homicide rate for the United States was .041 deaths per 100,000 persons employed during those years. The monthly average occupational homicide rates ranged from a high of .078 deaths per 100,000
employed persons in the South Region occurring in July to a low of .020 deaths per 100,000 employed persons in the Midwest Region for the month of June. This graphical representation of the data in Chart 1 exemplifies the type of work that has been done thus far with the unemployment-homicide association in that it plots the unemployment level at one point in time against a rate at the same point in time. These types of studies do not establish a temporal relationship between
unemployment and homicide.
J. Gaps in the current literature
Prior studies have examined the association between unemployment and homicide or suicide in the general population. However, the effect that changes in economic circumstance, especially rapid changes in unemployment, may have on workplace homicide risk is less understood. Open questions include the effect of sudden transient changes in the level of unemployment, such as those that result from mass layoffs, may have on homicide rates or any other violent acts.
21
employees are prone to feelings of desperation. An interesting observation is that these responses tend to increase as the length of unemployment increases; this may suggest that the sudden transient increases in unemployment may be less important as predictors of homicide than long term unemployment. On the other hand, if the level of unemployment is unusually elevated, as can be the case in times of a severe economic recession then individuals are often unable to perceive or encounter other means by which to provide for themselves and/or their dependents. As unemployment rises and recessions lengthen, questions remain about whether prompt changes in unemployment level impacts homicide rates.
In light of the recent global recession (which occurred from December 2007 – June 2009 , in which 83,000 mass layoff events (those where at least 50 employees as dismissed) and nearly eight million jobs were lost across the United States, it is plausible to hypothesize that drastic and sudden changes in unemployment rates and their widespread occurrence could precipitate the commission of more violent acts on at the regional and national levels. Again, the previous literature supports the likelihood of this result. However, no studies have examined county-level
22
unemployment that occurred in one month, or over the course of a quarter? We address the temporal relationship between unemployment and homicide through both study designs implemented in this dissertation project. The time-series analysis examines the resulting rate change in the general population, while the
case-crossover analysis reveals the change in workplace homicide risk that may occur as a result of the same change in unemployment.
K. Conceptualization of the unemployment-homicide association We developed a conceptual model of the unemployment-homicide association based on our review of the literature. Our interpretation is found in Figure 2.1. The temporal sequence is divided into underlying individual and
community characteristics that may lead one to commit homicide themself, or may lead to increased homicide rates in a community.
23
one’s personal response to psychological morbidity (e.g. isolated robbery, homicide, familial abuse, or violence against an intimate partner) or from a similar response to similar feels that may result from living in an incohesive, disrupted community. Violence and crime were considered temporal antecedents to homicide and workplace homicide.
We further posit that infrastructure within a community can decay as a result of economic depravity and instability (e.g. high or sharply rising unemployment). Examples of said decay are property value loss, home abandonment, degradation of community reputation, decreases in police surveillance, and worsening of roadway, sidewalk, and recreational area conditions. This decay can cause shifts in
community composition and crime levels that could result in increased crime and violence when stressors such as (in our case) high and rising unemployment are introduced.
L. Conclusion
The literature pertaining to unemployment and violence (including workplace violence) includes publications in several academic disciplines. It is well known that unemployment on county, state, and national scales is a risk factor for homicide and other violent acts. Unemployment and other economic factors have been studied extensively and have been determined to play a dynamic role in the stability of individuals, families, and societies. Unemployment has been found to be associated with violent acts and homicide when measured at a single point in time and
24
No previous study has evaluated the association between homicide and fluctuations in local unemployment rates that result from mass layoffs and workplace closings. Studying the magnitude of change brings valuable insight into the literature that will help define unemployment’s effect on the incidence of homicide and other violent acts. This dissertation project attempts to address these gaps by examining unemployment change as the main exposure. We will address the temporal
25 Table 2.1: Workplace shootings by industry
Industry Percentage
Retail Trade 24
Leisure and Hospitality 17
Government 14
Transportation/Warehousing 11
Other Services 6
Financial Activities 6
Professional/Business Services 5
Manufacturing 4
Agriculture 4
Wholesale Trade 3
Construction 2
2
7
28
Chapter 3: Specific Aims
III. STATEMENT OF SPECIFIC AIMS
This project examines the association between changes in monthly and quarterly unemployment levels and the risk of homicide within the NVDRS reporting region from 2003-2009. We examine the association between unemployment and homicide in the general population, as well as the association with homicide that occurs at work.
Homicide data were obtained for sixteen states (AK, CO, GA, KY, MA, MD, NC, NJ, NM, OK, OR, RI, SC, UT, VA, WI) from the National Violent Death
Reporting System (NVDRS) for the years 2003-2009. County-level unemployment levels were obtained from the Bureau of Labor Statistics (BLS) and were used as the main exposure variable in the analyses. We examined the association between changes in county-level unemployment level and homicides outside of the workplace that occurred among adult non-institutionalized men and women residing in the sixteen NVDRS states over period of 2003-2009 (Aim 1). We also examined the association between county-level unemployment level and rates of homicide
29
population density, and poverty within county populations were gathered from the U.S. Census Bureau, BLS, and from victim records within the NVDRS.
The project addresses the following specific aims:
Aim 1: Examine the association between monthly change in county-level unemployment levels and change in homicide rates.
This was done using the NVDRS data for all individual homicide victims, US Census population estimates, and BLS unemployment information to examine the relationship between homicide rates (per 100,000 population) and changes in unemployment among people residing in the states covered by the NVDRS during the period 2003-2009.This analysis was performed using the entire NVDRS victim population, regardless of whether or not the homicide act occurred within or outside of the workplace.
We use Poisson regression to calculate homicide rates and stratified by whether or not the individual killed was at work. Homicide rates were compared using the rate ratio effect measure. Homicide rates were compared among racial and ethnic groups, between sexes, among age groups, across states and years, and among community-level median household income and population density.
30
age, and population groups differently. We explored effect modification by population density, as has been the case in other studies (55, 57, 134-136).
Aim 2: Estimate the association between unemployment change and homicide at the workplace level
A case-crossover analysis was conducted to investigate whether homicide risk was influenced by change in the county unemployment.
In the case-crossover design control periods are selected at different points in time within a referent window. This is a method for studying the effects of transient exposures on acute events; in this research, it was applied to the study of
unemployment change on workplace homicide (149).
Control periods were defined as time periods close in time to a case event and were used in examining the unemployment change-workplace homicide
association. Time-invariant covariates such as victim-level age, race, and sex, are assumed to be constant within each risk because of the length of the period of observation; therefore, they do not have a confounding effect within their given risk set so far as this assumption is held.
31
Aim 3: Assess effect modification of the odds ratio for the unemployment- homicide association among potentially time-varying victim- and county-level covariates for homicide in the workplace.
For this aim, we assessed effect modification by county-level population density and median household income and heterogeneity of the unemployment-homicide association within victim subgroups and event types. Models were compared using the same conditional logistic regression methods that were employed in Aim 2 and the same covariates that were used in Aims 1 and 2. However, this research aim also compared odds ratios among workplace homicide types.
The information we gain through this aim informs as to whether or not there is any exacerbation of the odds ratio due to the presence of one or more county-level effect modifiers and if there is a difference in the unemployment change-workplace homicide association among population subgroups and event types. We hypothesize that there will be modification due to county-level population density. We further hypothesize that the unemployment change-workplace homicide association will differ among workplace homicide types, specifically as it pertains to Type 1 workplace violence. This hypothesis is based on the correlation between
unemployment and crime in the general population. Our expectation is that the odds of experiencing a workplace homicide event will be higher among workplaces that are located within areas that may have experienced exceptionally high rates of unemployment change during the study period.
32
Chapter 4: Methods IV: METHODS
A. Overview of Methods
We used the National Violent Death Reporting System (NVDRS) data from 2003-2009 for our analyses of the association between unemployment level and homicide. First, we used all NVDRS homicide cases (within and outside of the workplace) to examine homicide rates in relation to changes in county
unemployment level (Aim 1).
Second, we examined the change in risk of experiencing a homicide in the workplace through a case-crossover study design (Aim 2). We gathered
unemployment change data for the month in which the homicide event occurred (hazard period) and the months directly before and after the hazard period (control periods). We used conditional logistic regression to model the unemployment change-workplace homicide association. As part of our case-crossover design, we assessed modification of the unemployment change-workplace homicide association by community-level characteristics (population density and median household
33
B. Study Designs
This project used two study designs to accomplish its three research aims. A time-series analysis was used to examine the association between monthly change in county-level unemployment levels and change in homicide rates (Aim 1). A case-crossover study design was used to: (a) estimate the odds ratio for a workplace to experience a homicide occurrence as unemployment rates fluctuate across time; and, (b) assess effect modification and heterogeneity of the odds ratio for the unemployment- homicide association among potentially time-varying victim- and county-level covariates for homicide in the workplace.
C. Study Populations
The study population is comprised of all people residing within the NVDRS reporting area from 2003 through 2009 (Figure 4.1). The study area includes sixteen states (AK, CO, GA, KY, MA, MD, NC, NJ, NM, OK, OR, RI, SC, UT, VA, WI). Aim 1 examines homicide rates using records for all homicide victims within the NVDRS. Aims 2 and 3 incorporate the workplace homicide occurrences within the NVDRS to examine the change in risk associated with a change in the county-level
unemployment level.
D. Data Sources
34
1. National Violent Death Reporting System (NVDRS)
The NVDRS is an initiative through CDC whose goals are to: collect and analyze timely, high-quality data for monitoring the magnitude and characteristic of violent deaths at the national, state, and local levels; to ensure that violent death data are routinely and expeditiously disseminated to public health officials, law enforcement officials, policy makers, and the public; to track and facilitate the use of NVDRS data for researching, developing, implementing, and evaluating strategies, programs, and policies designed to prevent violent deaths and injuries at the
national, state, and local levels; and to build and strengthen partnerships with organizations and communities at the national, state, and local levels to ensure that data collected are used to prevent violent deaths and injuries. NVDRS is a state-level active surveillance system that provides data on all violent deaths in funded states, including all suicides, homicides, deaths from legal intervention, deaths of undetermined intent, and unintentional firearm fatalities.
The NVDRS reports all victims and alleged perpetrators (suspects) associated with a given incident. NVDRS collects and links data from death
35
court records, and firearm trace data from the Bureau of Alcohol, Tobacco and Firearms.
The system defines a death due to violence as “a death resulting from
intentional use of physical force or power against oneself, another person, or against a group or community”, which is the World Health Organization (WHO) definition of violence. The case definition includes suicides, homicides, deaths from legal
intervention, deaths from undetermined intent, and unintentional firearm fatalities. For the purposes of this project, homicide is defined as death resulting from
intentional use of physical force or power against another person or a group of other individuals. The determination as to whether an event is deemed a homicide,
suicide, or other death is made based on a determination by the CME or a classification of death found on law enforcement records.
The NVDRS database includes demographic data for both victims and suspects, victim to suspect relationships, personal victim characteristics such as pregnancy, former and current military service, and homelessness, data on the injury event (e.g. date, time, and place of injury) and the death (e.g. time, place, and cause of death), weapon type, toxicology and wound location findings, and the
36
elements that would serve to identify the circumstances surrounding a homicide event.
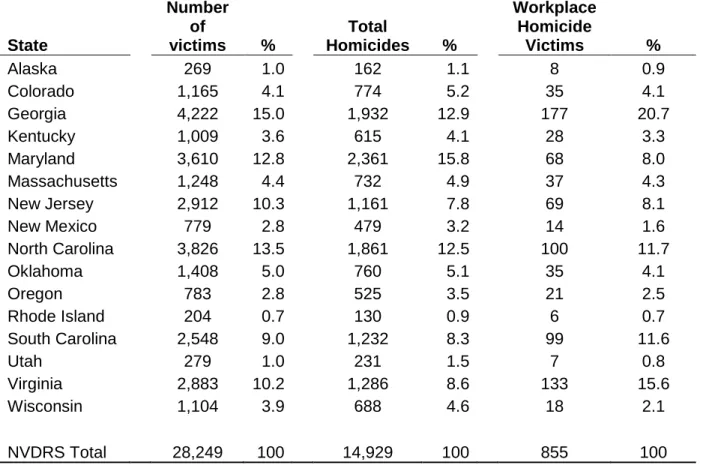
Victim records in the NVDRS are organized individually as observations in the data set. In this project’s data set, one record represented one person who was a victim of a homicide in the NVDRS states during the years 2003-2009. Observations were assigned victim and incident identification numbers to count the total victims within a state and determine how many victims were in a specific crime (e.g. one person may be victim number 3 in one homicide event). A total of 28,249 victim records were available in the initial data set we received from CDC. Approximately 3% of these homicide victims were injured while the individual was at work (855 records).
A homicide is considered to have occurred “at work” when the victim(s) are at work or working when the event takes place. The designation is taken from the “Injured at Work” item on the death certificate which is completed for all injury victims with the exception of those less than 14 years of age. Workplace homicides can occur at the person’s place of work or off-site during the course of work-related activities. In the NVDRS database, workplace homicides are coded dichotomously as at work and not at work.
To compile the “Injured at Work” variable, states are directed to follow
37
and/or medical examiner records, in that order. Completion rates for this variable are high (from any single data source (known for 94.9% of victims) and even higher (known for 97.6% of victims) given the multiple data sources. It is assumed that all states follow the priority/primacy rules as directed, and that each state employs a uniform method for ascertaining the location of the event. According to CDC, in the current system, primacy rules in abstraction and entry of data are applied uniformly across all participating states.
Table 4.1 provides a list of the NVDRS states used in this dissertation, with starting year of surveillance. NVDRS data from the state of California are excluded from the analyses. CDC excludes California data from all data releases for
epidemiological studies because these data have only been collected sporadically in a few counties. Table 4.2 provides an enumeration of homicide events and victims by state in the original data set received from NVDRS.
The NVDRS was initiated in 2003. Since states began to participate in the NVDRS at different times, data do not exist for all years across all states. We do not believe that the staggered start time will affect this analysis of the unemployment-homicide association because the NVDRS data set being used still captures a variety of magnitudes in the unemployment shift such as those that occurred during the global recession of 2007 - 2009. The data set used in this dissertation project includes homicides that occurred through December 31, 2009.
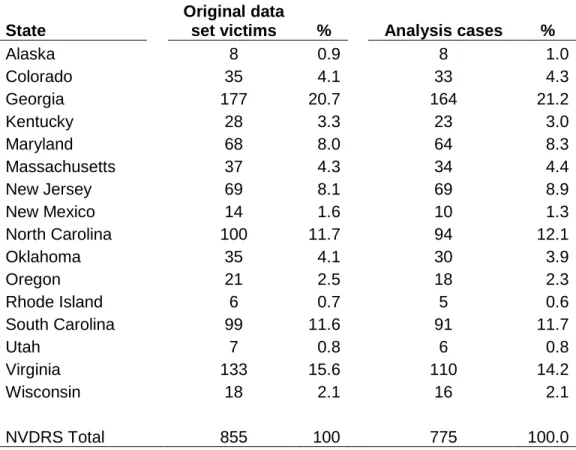
Construction of the analysis data sets for this project first required the
38
received by the NVDRS into a more workable list of homicide victims that contained only complete observations. In order to do this, deletions of a relative few incomplete observations was necessary. The process of cleaning the data set in this way is found below.
A total of 201 incidents were deleted because their incident dates fell outside of the designated study period. Because an incident date, and state and county FIPS codes were essential to merge data and apply exposure and covariate information, observations from the original NVDRS database were excluded from analysis data sets if those values were not present. As a result of missing FIPS codes and incident dates, a total of 323 victims (1.1% of the original data set) were excluded from the final analysis data set. These observations are described in detail in the remaining paragraphs of this subsection.
A total of 1,833 victim observations were initially missing incident dates. To prevent the loss of these incidents, date of death or date pronounced dead for each victim was used as the incident date if no date was recorded. Using these two death dates resulted in only 31 missing observations due to date. By using the death date as a proxy for the incident date, we make the assumption that the victim died on the same day, on the next day, or at least during the same month as the incident. For example, 99% of all homicides in North Carolina result within 30 days of their
39
from the data set. Therefore, 473 observations that did not originally have FIPS were preserved and included in the tentative analysis data set because their records included city and place codes for the site of the incident. These remaining
observations were individually examined in order to attempt to assign county codes. Any observation for which city and place codes were not able to produce county FIPS codes were eliminated from the base analysis data set. This further inspection resulted in the elimination of 43 additional victims.
An additional 48 observations were excluded because of missing age, or an improbable age value (e.g. 140 years old). The final base enumeration of victims for the Poisson analysis data set was 27,926.
2. Bureau of Labor Statistics – Local Area Unemployment
The main exposure for both studies is the change in the county-level unemployment over a given period of time. Unemployment rates are calculated based on data obtained from the Current Population Survey (explained in detail below) which surveys households for information pertaining to the previous month at least by 12th day of the following month. The week when the household survey is given is referred to as the reference week.
40
as the “unemployment level” for this project) is defined as the ratio of unemployed persons to the civilian, noninstitutional labor force expressed as a percent.
The BLS documents changes in unemployment levels as percentages taken to one decimal place. Seasonally-adjusted unemployment rates and rate changes (calculated using unemployment insurance claims) are recorded in publically available BLS databases and contain unemployment data for each state, county, metropolitan areas, and most smaller cities and towns. BLS estimates are
considered the gold standard for unemployment measurements.
State and local unemployment data were obtained from the Bureau of Labor Statistics (BLS) Local Area Unemployment database for each county within the NVDRS states (154). These data include monthly measures of the unemployment level (often referred to as the “unemployment rate”), and change from the previous month and quarter from the month measured within a given county on the month being measured.
These unemployment change measurements were merged to the NVDRS data file, by state and county FIPS codes as well as month and year of the homicide incident and constitute the exposure variables of each observation in the final
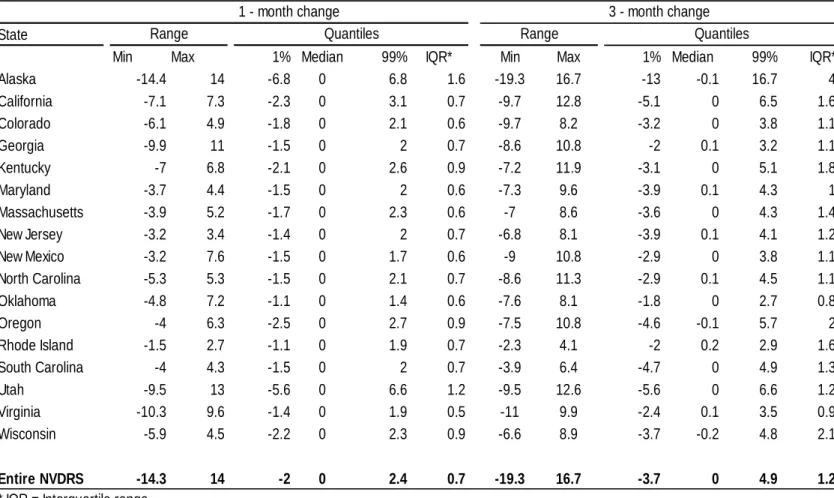
41
4.3 details variability present in unemployment change measurements for all NVDRS states.
The use of 1-month and 3-month unemployment level changes as the
exposure variables allows for an investigation of the hypothesis that homicide rates increase based on the length of unemployment “latency” periods.
3. United States Census Data – Current Population Survey
The United States Census is constitutionally mandated to collect population data on the United States households every ten years. Census counts are
considered the “gold standard” for population enumeration. The Current Population Survey (CPS) is a jointly sponsored effort by the U.S. Census Bureau and the BLS that acts as the primary source of labor force statistics for the population of the United Sates.
The CPS is the basis for several important national economic statistics, including the national unemployment level and other economic indicators related to employment and earnings. The CPS is administered by the Census Bureau using a probability selected sample of approximately 60,000 occupied households among 824 independent sample areas across the nation. The CPS includes households from all 50 states and the District of Columbia. Households are surveyed for four consecutive months, are excluded from the survey for eight months, and then return for four additional months before leaving the sample permanently.
42
are expressed in terms of the coefficient of variation, which is a relative measure of the sampling error that is calculated by dividing the sampling error by the expected value of a given characteristic measured by the survey.
The CPS is a strictly a sample of addresses. The U.S. Census is not able to know who occupies the sample households or even whether the household is occupied or eligible for interview prior to the first contact by a field representative.
The CPS survey methodology is designed to ensure a high degree of sample continuity on a month-to-month basis (as well as over the sample year) while
allowing for constant replenishment of the sample without excessive burden to respondents. Surveys are conducted during the calendar week that includes the 19th of a given month. The questions given to respondents refer to activities given during the prior week, hence the reference to the 12th day of the month in the previous section. Each month during the interview week, field representatives and computer assisted telephone interviewers make attempts to contact and interview responsible persons living in each sample unit selected to complete a CPS
interview. Households remain in sample for eight months. Therefore, each month, one-eighth enter the sample and one-eighth leave. An introductory letter containing a description of the CPS, offering a guarantee of confidentiality under the Privacy Act, and announcing the upcoming visit by a CPS field representative is sent to each sample household prior to its 1st and 5th months.
43
disqualified from the CPS for three reasons. First, addresses that have been converted to permanent businesses, condemned, or demolished, or are outside of the boundaries of the sample area for which it was selected will be classified as Type C, and upon a full supervisory review of the circumstances surrounding the case, will be eliminated from the sample. Type C households are not eligible for interviews in subsequent months because the condition of the household is considered permanent.
Households that are intended for occupancy but are not occupied by an eligible individual(s) are classified as Type B ineligible units. Reasons for such ineligibility may include vacancy of the housing unit or occupancy of the unit by individuals who are not eligible for the survey (e.g. persons whose usual or permanent addresses are elsewhere, or who are enlisted in the Armed Forces). Type B units are eligible for inclusion in future months and are assigned to field representatives in subsequent sampling periods.
Finally, a household falls within Type A ineligibility if no useable data were collected. These households have been determined eligible by the field
44
All Type A classifications undergo a full supervisory review before a final decision is made. CPS representatives make every effort to keep Type A cases to a minimum.
The field representative has the option of conducting subsequent interviews over the telephone, at the approval of the respondent. CPS estimates that 85% of interviews in the second, third, and fourth months are conducted in this manner. Fifth month interviews are used to reestablish rapport with sample households as said interviews occur after an eight month dormancy by the household in the unit.
The response rate for the CPS is generally between 91-92%. Generally, between 4.5 and 5.5% refuse to be surveyed, while 2.5 – 3% of the sample is unable to be contacted. Nonresponse has historically been found to be highest in March. Prior to publication, a geographic adjustment for nonresponse is made at the household level.
The CPS is subject to data loss due to noninterview and nonresponse. To compensate for data loss, the weights of noninterviewing households are distributed among interviewed households. CPS uses three imputation methods to address noninterview and nonresponse issues. Before applying imputation methods CPS data managers merge daily date files and sort the results by state so that missing values are allocated by geographic regions. This ensures that missing values for geographically grouped sampling units receive values from their appropriated regions.
45
“Refused” responses. CPS edits demographic variables first, followed by labor force data and any other missing variables. All of the various edits performed to data lines are undertaken in a logical sequence, in accordance with the needs of subsequent edits, household edits and codes being addresses first, followed by demographic edits and codes.
The three types of imputation performed are as follows: First, relational imputation infers missing values from the other characteristics on the person’s record or within their household. Second, longitudinal methods are used to impute most of the missing labor force data. If a question is left blank and the interview is taking place in any of the interviewee’s subsequent months, the question is assigned the last month’s entry.
Finally, “hot deck” allocation assigns missing values from a record with similar characteristics. Hot decks are defined by variables such as age, race, and sex. Other characteristics used in hot decks vary and depend on the nature of the unanswered question(s). All CPS items that require imputation have an associated hot deck. Initial values for the hot decks are the ending values from the preceding month. As a record passes through the editing/imputation process, it either donates or receives a value from the hot deck.
46
1985, most sample persons with the same state have had the same probability of selection. Through a series of estimation steps, the selection probabilities are
adjusted for noninterviewers and survey undercoverage. Data from previous months are incorporated into the estimates through the composite estimation procedure.
As part of the CPS, the U.S. Census Bureau provides annual county-level population estimates that represent projected population counts as of July 1st of that year. These estimates are available for each state within the United States and some of the surrounding territories. They were used in the computation of stratified homicide rates in the Poisson analysis and also in the calculation of county-level population density for both the Poisson and case-crossover analyses. Estimates were obtained for the entire county-level population and stratified by race, sex, age, and/or Hispanic origin for each county within the NVDRS.
Specifically to this project, we obtained CPS estimates of socioeconomic indicators that could serve as confounding variables or effect modifiers in both study designs including: county-level median household income, and percent and number of persons living in poverty.
47 F. Statistical Methods
1. Poisson regression
We constructed a count data set that could be analyzed using Poisson regression to compute homicide rates and rate ratios. We obtained population estimates for each county and state within the NVDRS from 2003-2009. Each county-level population estimate was stratified by year, month, age, race, sex, but also included an enumeration for the total population. Homicide victim counts were tallied and merged into the stratified data set. Rates were then computed for each year/month/age/sex/race combination by dividing the number of cases in a given stratum by the total stratified population. Poisson regression was performed to average rates across unemployment level change strata.
The Poisson analysis uses the number of persons killed by homicide as the numerator. The denominator in Aim 1 is the number of individuals in a given age, race, and gender combination within the county in the victim’s county of residence. The denominator is specific to the year and month of occurrence. For ease of interpretation, we report the rate per 100,000 person-years .
48
Population estimates from the U.S. Census were merged for each
age/sex/race/month/year combination. This created stratified data that were used to compute a rate for every state/county/year/month/age/sex/race.
Two types of problematic observations presented themselves as the Poisson data set was being assembled. First, simple descriptive statistics found that there were 19 observations where a case count was recorded, but the population figure from the U.S. Census for that county was zero. These counties were rural and lacked much racial and ethnic diversity; thus it is possible that the population of certain groups within those counties could have been as little as one small family (approximately 2-5 people). In order to prevent the loss of any complete cases (those with incidence dates and victim ages), we imputed a 1 into the population count for these areas. It is well understood that these observations could be influential to the any rates that are stratified by race and gender. A sensitivity analysis will be performed to evaluate the influence of inclusion of these observations.
Second, there was the problem of homicide victims with missing population counts. These victims were all killed in four rural Alaskan counties where no population numbers were available through the Current Population Survey.