THE EFFECT OF A RURAL HOSPITAL CLOSURE ON THE FINANCIAL PERFORMANCE OF NEARBY RURAL HOSPITALS
Aditi Adhikari
Undergraduate Honors Thesis Department of Public Policy
University of North Carolina at Chapel Hill April 15, 2020
Approved:
______________________________________________ Dr. Maryann Feldman (Chair)
ABSTRACT
In 2019, 19 hospitals closed in rural America due to financial insolvency, the largest number of rural hospital closures since 2005. Existing literature on rural hospital finance focuses only on the financial distress of individual hospitals over time. This paper aims to explore the changes in a rural hospital’s financial viability following the closure of its nearest neighbor, examining whether there is a spillover effect of poor financial performance. Specifically, the paper explores the effect of a nearby closure on the profitability, liquidity, revenues, cost, utilization and overall financial distress (as measured by the Financial Distress Index) of the surviving hospital of interest. A generalized linear model is used to evaluate 2,039 unique hospitals from the years 2011-2018 (n=14,134 hospital-years). An ordered logit model is used to evaluate changes in FDI for a subsample of 1,950 unique hospitals from the years 2014-2018 (n=8,524 hospital-years). Major findings include: (1) nearby closure tends to result in increased outpatient revenues for the hospital of interest, (2) total margins are not significantly affected by a nearby closure, (3) Critical Access Hospital (CAH) status is not protective against overall financial distress in the wake of a nearby closure, (4) state Medicaid expansion status is correlated with improved financial health for all rural hospitals across revenue, cost, and utilization metrics. Policymakers are urged to adopt policies that decrease the burden of
TABLE OF CONTENTS
ABSTRACT ... 2
TABLE OF CONTENTS ... 3
TABLE OF FIGURES AND TABLES ... 5
ACKNOWLEDGEMENTS ... 7
CHAPTER ONE – INTRODUCTION AND SIGNIFICANCE ... 8
Background ... 8
Current State of Rural Hospitals ... 8
Repercussions of Rural Hospital Closure on Rural Communities ... 9
Rural Hospital Designations ... 12
Description of Rural Hospital Designations... 12
Historical Context of Rural Hospital Designations ... 15
Key Question ... 16
Policy Significance ... 18
Chapter Roadmap ... 19
CHAPTER TWO – LITERATURE REVIEW ... 20
Geographic Considerations of the Rural Hospital Closure Crisis ... 20
Legislation Affecting Rural Hospitals ... 22
History of Federal Legislation Affecting Rural Hospital Designations ... 22
Repercussions of the Patient Protection and Affordable Care Act ... 24
Financial Metrics of Interest... 25
The Financial Distress Index... 25
22 Rural Hospital Financial Performance Indicators ... 27
Specific Financial Characteristics of Interest ... 28
CHAPTER THREE – RESEARCH DESIGN ... 31
Dependent Variable ... 31
Five Key Financial Metrics ... 31
1 Financial Distress Index... 34
Independent Variable ... 34
Data Availability and Limitations ... 36
Defining the Sample and Subsample ... 37
Description of the Data ... 41
Determining the Correct Regression Models ... 44
Methods ... 45
CHAPTER FOUR – RESULTS AND ANALYSIS ... 47
Effect of Closure on Financial Metrics ... 47
Total Margin ... 48
Salaries to Net Patient Revenues ... 49
Acute Average Daily Census Beds ... 51
Days Cash on Hand ... 52
Effect of Closure on Financial Distress Index ... 53
Validity and Limitations of the Analysis ... 55
Internal Validity of the Analysis ... 55
External Validity of the Analysis ... 57
CHAPTER FIVE – RECOMMENDATIONS AND CONCLUSION ... 58
Policy Recommendations ... 59
Federal Legislation ... 59
State Legislation ... 61
Recommendations for Further Research ... 63
REFERENCES... 65
APPENDIX A ... 70
Acronym Definitions ... 70
APPENDIX B ... 71
2013 Rural Urban Continuum Codes ... 71
2010 RUCA Codes... 71
APPENDIX C ... 72
Calculating the Financial Distress Index ... 72
Calculating the Dependent Variables ... 73
APPENDIX D ... 74
APPENDIX E ... 76
TABLE OF FIGURES AND TABLES
FIGURE 1.1: Location of Short-Term, Rural, Acute Care US
Hospitals by Size of the Rural Area 2012-13………9
TABLE 2.1: History of Major Federal Legislative Adjustments to Rural Hospital Designations………22
FIGURE 2.1: Medicaid Expansion Status by State in 2019………...………….…24
FIGURE 2.2: Unadjusted Hospitals Closure Rates by State Medicaid Expansion Status, 2008-16……….……25
TABLE 3.1: 22 Financial Metrics for Measuring CAH Financial Health and Five Metrics Used ………...………...32
TABLE 3.2: Operationalization of Key Covariates……….…………..35
FIGURE 3.1: Exclusion Flowchart for Determining Final Sample………39
TABLE 3.3: T-Test of Observations Included and Excluded from Main Sample……….…...40
TABLE 3.4: T-Test of Observations Included and Excluded from Subsample…...……...………40
TABLE 3.5: Descriptive Statistics of Financial Metric Outcome Variables...…..…...…42
TABLE 3.6: Tabulation of Financial Distress Index for Hospital-Years in Subsample……..…....42
TABLE 3.7: Descriptive Statistics of Independent Variables, Main Sample…………...…………..42
TABLE 3.8: Descriptive Statistics of Independent Variables, Subsample..………...43
TABLE 3.9: Inclusion of Hospitals in the Subsample for 2014-2018……….………..43
TABLE 3.10: Regression Models Used for Each Outcome Variable……….………44
FIGURE 4.1: Predicted Financial Outcomes in the Years Following Closure of Neighbor...….47
TABLE 4.2: Marginal Effects of Key Explanatory Variables on Total Margin……….…………..48
TABLE 4.3: Marginal Effects of Key Explanatory Variables on Salaries to Net Patient Revenues………..50
TABLE 4.5: Marginal Effects of Key Explanatory Variables on Acute Average Daily Beds…...52
TABLE 4.6: Marginal Effects of Key Explanatory Variables on Days Cash on Hand…………..53
FIGURE 4.2: Predicted Changes in Risk Category in Years Following Closure of Neighbor……54
TABLE 4.7: T-Test of CAH vs. Non-CAH FDI Across Years Following Nearby Closure….……54
TABLE D.1: Matrix of Collinearity for Large Analytical Sample (n=14,134)...74
TABLE D.2: Matrix of Collinearity for Subsample (n=8,524)………...74
TABLE E.1: Total Margin Regression Model Specification...76
TABLE E.2: Salary to Net Patient Revenues Regression Model Specification...77
TABLE E.3: Days Cash on Hand Regression Model Specification...77
TABLE E.4: Acute Average Daily Census Beds Regression Model Specification...78
TABLE E.5: Outpatient Revenue to Total Revenue Regression Model Specification...78
TABLE E.6: FDI/Risk Category Regression Model Specification...78
ACKNOWLEDGEMENTS
First and foremost, thank you to my advisors, Dr. Maryann Feldman and Dr. Evan Johnson, for their unwavering guidance and support during this project. Thank you also to Dr. Dan Gitterman and the Department of Public Policy for not only introducing me to an amazing academic field, but also several amazing peers with whom I will hopefully stay in touch for the rest of my life. I would also like to extend a very heartfelt thank you to Dr. Donna Gilleskie, without whom I would not have determined the proper models and econometric methods required for the successful completion of this project. The lessons learnt from her and the Department of Economics were essential in building this study.
I would like to also thank Dr. Holmes, the Flex Monitoring Team, the NC Rural Health Research Program, and the National Rural Health Association, for giving me the tools and background knowledge necessary to execute this study.
Throughout my time at Carolina, I have been heavily supported both professionally and personally by the Morehead Cain Foundation and Honors Carolina. I would like to thank them for their ongoing generosity and care.
CHAPTER ONE – INTRODUCTION AND SIGNIFICANCE
Background
Current State of Rural Hospitals
One hundred and twenty-eight rural hospitals have shut their doors since 2010, leaving counties without access to essential health services (NC Rural Health Research Program, 2020). In 2018, the National Rural Health Association estimated that an additional 673 rural hospitals were vulnerable to closure, potentially leading to a loss of 11.7 million patient health encounters annually, as well as a $227 billion loss to GDP over 10 years. In the summer of 2018, the New York Times reported on the closure of Twin Rivers Regional Hospital, a 116-bed hospital in southwestern Missouri that saw 400 baby deliveries and 22,000 emergency visits each year. The closure left Dunklin County, Missouri, with no hospital for its 31,000 residents. There were no functioning obstetrics units for hundreds of miles, leaving the region prone to poor maternal health and high rates of infant mortality (Healy 2018). This story repeats itself in numerous areas of the United States, where maternal wards, emergency departments, and entire hospitals are closing their doors at alarming rates. 2019 saw 19 closures, the highest number of rural hospital closures since the NC Rural Health Research Program started tracking closures in 2005, and by the end of February, 2020 has already seen 4 additional closures.
A map of rural acute care facilities is shown below, in Figure 1.1. Rural hospitals are sparse in the Western region of the United States, and rural hospital landscape in the Midwestern and Southern regions is largely comprised of small and isolated rural hospitals (Freeman et al., 2015). In these regions in particular, the closure of a small or isolated rural hospital can have a great impact on the surrounding communities. Due to high costs and low patient volume, small and isolated rural hospitals are more susceptible to closure than large rural hospitals. Though small and isolated hospitals provide essential services to an area with limited resources, their patient volume can be too low to drive the revenue necessary to remain financially soluble. In such communities, a closure can leave already under-resourced communities with even less reliable access to medical care, as the next nearest hospital may be far away.
FIGURE 1.1: Location of Short-Term, Rural, Acute Care US Hospitals by Size of the Rural Area 2012-13 (Freeman et al. 2015)
Source: Freeman et al., 2015
Repercussions of Rural Hospital Closure on Rural Communities
Nursing Facility (SNF) closures revealed that the closure of either free-standing or hospital based SNFs resulted in an increased rate of re-hospitalization within 30 days of discharge. To be
precise, researchers found that the closure of 882 SNFs resulted in an additional 12,000-18,000 re-hospitalizations within 30 days of discharge (Rahman, Zinn, and Mor, 2013). These effects were found to be largely concentrated in high-need patients and patients with overall poor health, both of which are common in rural areas. In communities with a hospital at high risk of financial distress, 20% of patients are in fair or poor health, compared to 15% of patients living in a community without a hospital at high risk of financial distress. Communities with a hospital at high risk of financial distress also have significantly higher rates of obesity, smoking, and unemployment, and have significantly lower rates of high school graduation (Thomas, Pink, and Reiter, 2019b). Thus, hospitals at high risk of financial distress are already serving sicker
communities, meaning the effects of their closure are felt acutely by already vulnerable communities.
Indeed, a 2019 study demonstrated that in the years leading up to closure, rural hospitals saw an annual 8.3% decrease in the supply of general surgeons. In the years following a rural hospital closure, a similar 8.2% annual decrease in primary care physicians was also significant for the period 1997-2016 (Germack, Kandrack, and Martsolf, 2019). The study focused on non-federal physicians, and found that following a closure, not only did counties retain fewer primary care physicians, but also fewer obstetrician-gynecologists. Thus, the closure of a rural hospital significantly limits local access to essential healthcare services such as routine surgical
procedures, primary care checkups and appointments, and maternal and reproductive healthcare. Because of the poor services associated with rural hospitals that are struggling
concerns. When a patient bypasses a hospital, they choose to seek services at a hospital other than the hospital located closest to their residential ZIP code. A 2019 analysis of the rural inpatient care-seeking practices of 15 states showed that rural hospitals safe significant levels of bypass. CAHs, small hospitals, hospitals without obstetric services, pediatric services, or general surgical services more likely to be bypassed by rural residents than other hospitals when seeking inpatient care (Malone and Holmes, 2019). Thus, the financial decline of a rural hospital appears to have a compounding effects – hospitals are not well-funded enough to provide varied services, and therefore get bypassed by patients, which causes hospitals to see decreases in revenue, which limits the services they are able to provide, and so on and so forth.
Rural residents note that a hospital closure results in increased barriers to receiving diagnostic tests and scans, and decreased access to emergency care (Hart, Pirani, and Rosenblatt, 1991; Thomas et al., 2015). Ambulance services from the nearest hospital are spread over a larger geographic area, leading to longer emergency response times and poorer overall community health. These effects are disproportionately felt in rural communities of color;
abandoned hospitals are located in communities with significantly higher percentages of Black or Non-White residents compared to hospitals that have not been not abandoned.
Rural hospital closures have also clear impacts on community economic health. Often, rural hospitals are the largest employers in their communities, and the loss of rural hospital jobs has a multiplier effect on the surrounding community. One study estimates that for every 100 hospital jobs lost in a rural community, an additional 35 jobs are lost in the surrounding community (Eilrich, Doeksen, and St. Clair, 2015).
for two years following a hospital closure. These effects are not concentrated directly around the hospital; a decrease in per capita income of 4% annually and an increase in unemployment of 1.6 percentage points were seen within a 15-mile radius of a hospital closure, showing that a single closure can have widespread geographic impacts (Holmes et al., 2006). A typical rural hospital has 320 full-time equivalent employees, but hospitals serving larger rural areas may have over 500 full-time equivalent employees (Freeman et al., 2015). Thus, their closure has a significant impact on the availability of jobs in the community.
Rural Hospital Designations
Description of Rural Hospital Designations
There is great variation in hospital size and reimbursement schedules among rural hospitals, and the closure of different types of hospitals could have different effects on the surrounding communities.
Several types of rural health providers constitute the rural health landscape in 2020, each of which follows a different reimbursement plan through the Center for Medicare and Medicaid Services (CMS). The associated acronyms for these designations and other important terms can be found in Appendix A.
The most common type of rural hospital is the Critical Access Hospital, which comprise 61% of all rural hospitals (Thomas, Pink, and Reiter, 2019a). Critical Access Hospitals (CAHs) must have 25 or fewer acute care beds, be located less than 35 miles away from another hospital (or 15 miles in mountainous areas), maintain acute care inpatient stays at below 96 hours, and provide 24/7 emergency services (Balanced Budget Act of 1997). They receive 101%
access to specific grants and resources, and have flexible staffing and billing requirements. 7.3% of Critical Access Hospitals were at high risk of financial distress in 2019, slightly lower than the national total of 9.2% (Thomas, Pink, and Reiter, 2019a). These hospitals were established in 1997 by the Balanced Budget Act of 1997, and proved to be an effective program for improving rural hospital efficiency in the years after its establishment (Wilson et al., 2012). Today, they are the most representative designation of rural hospital, given their ubiquitous nature and typical bed and market size.
The national total is skewed upwards due to high closure rates among Medicare Dependent Hospitals (MDH) and Prospective Payment Systems hospitals (PPS). MDHs are similar to CAHs, but only represent 8% of all rural hospitals, since over 60% of their inpatient claims must be reimbursable through Medicare (Centers for Medicare and Medicaid Services, 2019). The Centers for Medicare and Medicaid Services (CMS) reimburses MDHs at a hospital-specific rate. 18.2% of MDHs are predicted to be at high risk of financial distress, almost double the national amount. Though the government provides extra support to these hospitals, they are not representative of a typical rural hospital due to their scarcity and high proportion of Medicare claims.
unpredictable case mix, making prospective payment less effective. PPS hospitals are also typically located too close to other acute providers, for this is often the reason they are denied other designations, and therefore may be experiencing high rates of closure as a result of market mechanisms that enforce minimum quality standards (Holmes et al., 2006). The high rates of financial distress in PPS hospitals are not representative of the typical rural hospital.
Sole Community Hospitals (SCHs) represent 17% of all rural hospitals. By definition, they are the only acute care provider within a 35-mile radius, with the next nearest hospital defined as being a ‘like hospital’. These hospitals serve the most remote populations in the United States, and are eligible for annual reimbursement adjustments based on volume, as well as a high level of flexibility in their reimbursement rates (Centers for Medicare and Medicaid Services, 2019). Though the closure of an SCH would likely have a large impact on the health outcomes and economic strength of the surrounding community, due to their remote nature, they are not representative of a typical rural community or rural provider market.
The present study will include data on all rural hospitals, but will make a point of examining the differences between CAHs and other hospitals. CAHs represent the majority of rural hospitals, and are modal among rural hospitals in terms of number of acute beds.
Furthermore, any policy change that targets CAHs will have sweeping ramifications for rural America through just one policy adjustment, making them an attractive target for future policy reform. Understanding how the performance of CAHs compares to other rural hospitals may shed light on the effectiveness of the CAH program with regards to maintaining rural hospital financial viability.
Historical Context of Rural Hospital Designations
In the 1980s, rural hospitals also struggled to stay financially viable, largely due to population decline from urbanization and the high cost burden of treatment (Mayer, Kohlenberg, and Sieferman, 1987). During a string of hospital closures throughout the 1980s, the United States incorporated into its Code of Federal Regulations new rural hospital designations aimed at combatting rural hospital closures. These included RRCs, MDHs, SCHs, and the now
Though other pieces of federal legislation have introduced minor changes to the CAH program since 1997, by far the most influential piece of legislation was the Patient Protection and Affordable Care Act of 2010 (ACA). The ACA allowed CAHs to participate in the 340B drug pricing program, which increased CAH access to reduced-cost pharmaceutical products. Additionally, research has shown that state-level Medicaid expansion under the ACA has a positive effect on rural hospital viability. Importantly, there are significantly higher rates of hospital closure in non-expansion states compared to expansion states due to the higher cost burden of uncompensated care (Patient Protection and Affordable Care Act, 2010; Lindrooth et al., 2018).
The most recent piece of legislation to impact rural health was the federal Agriculture Improvement Act of 2018, commonly known as the 2018 Farm Bill, which contained three sections addressing the opioid crisis, telemedicine, and hospital debt refinancing. In particular, section 6103 expanded loan eligibility to include rural hospital debt, increasing access to capital for rural communities who are struggling to keep hospitals open (Agricultural Improvement Act of 2018). However, as this bill did not pass until late 2018, its effects have yet to be studied and will not influence this analysis.
A more thorough list of major federal adjustments to the CAH program and other rural hospital programs is available in Table 2.1.
Key Question
Rural patients are also more prone to chronic illness, life-threatening emergencies, and longer recovery times, all of which increase the cost burden on rural hospitals. Financial insolvency is leading to an accelerating rate of closure among rural hospitals, forcing policy makers to ask how we can effectively support rural hospital finance (Kaufman et al., 2016).
The literature on rural health finance has identified a number of strong predictors of rural hospital closure. For example, a 2016 study found that decreasing total margin, decreasing net patient revenue, and increasing service area poverty rate are among the top 5 predictors of rural hospital closure by standard effect size (Kaufman, Pink, and Holmes, 2016). However, the current body of literature has focused exclusively on individual hospitals, looking at how a hospital’s finances predict its own likelihood of closure in the next two years, without
consideration for the effect of closure on other rural hospitals. This study aims to determine the effect of one hospital closure on nearby hospital financial solvency, thus moving towards identifying whether there is a ‘ripple effect’ of rural hospital financial distress. The current literature does not take this effect – or the lack thereof – into account.
closure, while the financial metrics will provide more insight on the specific financial dimensions affected by the closure.
Policy Significance
Identifying specific areas of financial vulnerability as well as overall trends will allow policymakers to be both precise and accurate in the policies they create to address the rural hospital closure crisis. When the Balanced Budget Act of 1997 was passed, it was known that rural hospitals were closing due to low margins and high Medicare cost burdens (Balanced Budget Act of 1997). As a result, the proposed solution was to create a special hospital
designation that could receive Medicare reimbursements at 101% of cost, thus increasing overall revenues, increasing margins, and addressing the disproportionate burden of Medicare claims in rural areas.
The present analysis hopes to shed similar insight, but looks beyond a single hospital’s financial solvency to identify whether policymakers should also be considering a ripple effect of rural hospital closure on nearby providers. When a nearby hospital closes, it is expected that patients will begin to use the facilities of the next-nearest hospital, thus raising both costs and revenues of that next-nearest hospital. The proportion of costs to revenues would likely vary based on the case mix, leading to different financial outcomes for hospitals following the closure of their neighbor. It remains unclear how this sudden movement of patients affects nearby providers both financially and operationally.
order to support rural hospitals, policies that target other facets of hospital quality may be more successful than policies that target hospital finance.
Chapter Roadmap
Chapter 2 will present a literature review. There is a large body of work done on identifying the main financial factors that lead to hospital closure, which will be explored and analyzed in this section. There is little to no work done on analyzing the effect of a hospital closure on other hospitals, particularly in rural settings. This paper aims to start filling that gap.
Chapter 3 will outline the methods used for this analysis. The analysis will look at the effects of a hospital closure on six financial metrics that represent profitability, liquidity, capital structure, revenue, cost, and utilization, and a holistic Financial Distress Index that captures overall financial performance. Financial performance data will be supplied by the Flex Monitoring Team, and was constructed from Medicare Cost Report data from CMS. The Financial Distress Index (FDI) was constructed by the Flex Monitoring Team from a variety of data sources. A description of how the FDI was constructed can be found in Appendix C. Explanatory variables will be collected from the American Community Survey and the Robert Wood Johnson County Health Rankings dataset, both of which are publicly available. A regression analysis with hospital and county-time fixed effects will be used, with subgroup analysis based on distance from closure. This analysis only uses quantitative methods.
CHAPTER TWO – LITERATURE REVIEW
A large portion of the literature on rural hospital finance, and Critical Access Hospital finance in particular, has come from the North Carolina Rural Health Research Program, funded by the Federal Office of Rural Health Policy (FORHP) within the US Department of Health and Human Services (DHHS). Though much work has been done on rural health in general, the majority of the literature focuses on health outcomes for rural populations, rather than the financial performance and vulnerability of the institutions providing care to those populations. Even fewer resources have been dedicated to examining the relationships between rural health providers. As such, it is still unknown whether the relationships between hospital-based providers should even be considered when studying rural health in America.
In this chapter, a general overview of the rural hospital closure crisis will be given, as well as in-depth analysis of a few key papers and a comprehensive background of the legislative changes that have affected rural hospital financial and operational performance. The effects of rural hospital closure and the subsequent policy importance of this issue are highlighted in
chapter 1, and will not be elaborated upon here, as they did not directly inform the formulation of the key question or methodology of the present analysis.
Geographic Considerations of the Rural Hospital Closure Crisis
in 2005 (North Carolina Rural Health Research Program, 2016; North Carolina Rural Health Research Program, 2020).
Closure of the vulnerable hospitals is expected to result in a loss of over 100,00 jobs and a loss of $277 billion in GDP over 10 years. Researchers note, however, that these adverse effects would not be evenly distributed across different geographies and populations. Rural hospitals are largely located in the Midwest and Texas, with fewer in the West and Northeast regions (North Carolina Rural Health Research Program, 2016). The highest rates of closure are seen in the Appalachian region, the Southern Delta region, and the South Atlantic.
Legislation Affecting Rural Hospitals
History of Federal Legislation Affecting Rural Hospital Designations
Major federal legislation with provisions affecting rural hospitals are listed in Table 2.1, below. State and federal level changes over time are accounted for in this present study in the regression model. However, understanding the history of rural hospital designations and the legislation supporting them provides policy context for future lawmakers who may make changes to reimbursement programs based on the present study.
TABLE 2.1: History of Major Federal Legislative Adjustments to Rural Hospital Designations
Act Year Effect on Rural Hospitals
1983 Code of Federal
Regulations 1983
S. 405.476: Created the Sole Community Hospital designation to support small rural hospitals serving Medicare beneficiaries
S. 412.96: Created Rural Referral Center designation to support large, specialized rural hospitals serving
Medicare beneficiaries
S. 412.108: Created Medicare Dependent Hospital designation to support rural hospitals with an abnormally high percentage of Medicare claims
Balanced Budget Act
(BBA of 1997) 1997
S. 4201: Created the CAH designation and established the Rural Health Network, permitting swing beds, awarding grants, and defining reimbursement provisions for CAHs
Medicare, Medicaid, and SCHIP Balanced Budget
Refinement Act
1999
S. 403: Applied the 96-hour inpatient stay rule; allowed closed hospitals to reapply for CAH status; corrected adverse payment consequences created by the BBA of 1997 related to laboratory testing reimbursements and outpatient reimbursements
Medicare Medicaid, and SCHIP Benefits Improvement and Protection
Act
2000
S. 201-6: Improved reimbursement plans and rates for CAH emergency room and ambulance claims; exempted CAH swing beds from SNFs; created new provisions for other rural hospital designations
Medicare Prescription Drug, Improvement, and Modernization Act
2003
Medicare Improvements for
Patients and Providers Act 2008
S. 148: Expanded the 101% reimbursement to include clinical laboratory services; created new grant
opportunities for CAHs American Recovery and
Reinvestment Act 2009
S. 4102: Created new incentives and grants for rural hospitals to integrate health technology equipment into their facilities
Patient Protection and Affordable Care Act
(ACA)
2010
S. 3128: Expanded the 304B Drug Pricing Program to include CAHs; alleviated provider shortages by
expanding Area Health Education Centers and investing in the National Health Service Corps; Other long-term repercussions of the ACA are outlined below, in the next subsection of this chapter.
Bipartisan Budget Act 2013 S. 1101-1110: reimbursements in order to lower the government deficit Mandated cuts to Medicare Agriculture Improvement
Act
(2018 Farm Bill) 2018
S. 6103: expanded loan eligibility to include rural hospital debt
S. 6301: Expanded funding for telemedicine rollout and substance abuse and mental health treatment
Bipartisan Budget Act 2018 S. 50204: payment program through 2022 Extended the Medicare Dependent Hospital Source: Various
Since the first rural hospital closure crisis in the 1980s and 1990s, a number of major federal bills have shaped the rural health provider landscape we see in the late 2010s.
Throughout the 2000s and 2010s, congress passed legislation that attempted to improve the financial conditions of rural providers, by increasing the allowable size of a CAH in 2003 to expanding the 304B drug pricing program and investing in rural health providers in 2010.
However, many of these policies have unclear effects on the financial viability of rural hospitals. Indeed, despite adjustments to federal programs assisting rural hospitals, rural
that Medicaid expansion through the ACA is an effective way to financially support rural hospitals. These studies are further explored in the following subsection.
Repercussions of the Patient Protection and Affordable Care Act
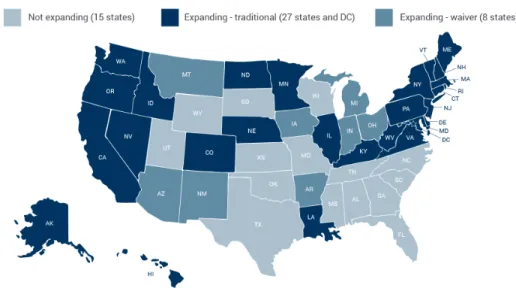
Though the Patient Protection and Affordable Care Act (ACA) was originally intended to apply to all states, Supreme Court intervention resulted in the law only being allowed at a state level. From the period of 2012-2020, states have decided to expand Medicaid services under the ACA at different years. To date, 37 states including the District of Columbia have chosen to expand Medicaid. These states are largely concentrated in the West and Northeast, with the South notably abstaining from implementing expansion (Kaiser Family Foundation, 2020), as shown in Figure 2.1:
FIGURE 2.1: Medicaid Expansion Status by State in 2019
Source: Medicaid and CHIP Payment and Access Commission, 2019
significantly higher proportion of rural hospital closures (p<0.01). A visual summary of the findings is below, in Figure 2.2:
FIGURE 2.2: Unadjusted Rural Hospital Closure Rates by State Medicaid Expansion Status, 2008-16
Source: Lindrooth et al., 2018
The study found that the effect was strong in CAHs, as CAHs were the least likely to close after Medicaid expansion (p<0.01). Thus, the findings in this paper suggest the importance of not only Medicare reimbursement, but also Medicaid reimbursement on the financial stability of rural hospitals and CAHs in particular.
Financial Metrics of Interest
The Financial Distress Index
One of the most prominent papers on rural hospital finance was published in 2017 by the North Carolina Rural Health Research Program. This study develops a generalizable Financial Distress Index (FDI) based on hospital-specific characteristics, including financial
characteristics of each rural hospital and its associated service area (Holmes, Kaufman, and Pink 2017). The FDI was the first of its kind to provide a holistic account of a rural hospital’s
financial performance, and has been in development since before 2011 (Holmes and Pink, 2011). The FDI pays specific attention to the challenges faced by rural hospitals that may be missed in other predictors such as the Altman Z-Score—which researchers have not advised for use in hospital settings (Langabeer, 2006)—or predictors based on financial and operational measures alone—which have not been shown to be accurate a majority of the time in non-profit settings (Tuckman and Chang, 1991). The FDI is unique in that it accounts for government
reimbursement mechanisms, market size and share, ownership, and size of the hospital in order to calculate a θ value to categorize the hospital as being at high, mid-high, mid-low, or low risk of experiencing financial distress within the next two years. A thorough summary of the FDI calculation methodology can be found in Appendix C.
The FDI has been shown to accurately predict financial distress after two years. Within two years after initial risk categories were assigned, 0.1% of low-risk and mid-low risk hospitals, 1.1% of mid-high risk hospitals, and 5.9% of high-risk hospitals all ceased inpatient services, rendering them closed by the definition given by the Office of the Inspector General: “A facility that stopped providing general, short-term, acute inpatient care [….] We did not consider a hospital closed if it: merged with, or was sold to, another hospital but the physical plant
closure. Regardless, all hospitals that closed between 2005-2015 were classified as experiencing high risk of financial distress one to two years prior to closure (Kaufman, Pink, and Holmes, 2016). Knowing that the United States macroeconomic environment was substantially different in 2007 than in 2008 or 2009 due to the Great Recession, these results demonstrate robustness of the FDI across time and macroeconomic conditions.
However, the FDI also has limitations to consider. Characteristics such as provider shortages, staff skill level, and changes in state or federal policy are not included in the model. As a result, sweeping policies such as the Patient Protection and Affordable Care Act (ACA) that have been shown to have significant effects on rural hospital financial performance (Lindrooth et al., 2018) are not factored directly into the FDI. However, if we are to assume that these factors do not change over time for any given hospital, then the use of panel data analysis in the present study should address those gaps.
22 Rural Hospital Financial Performance Indicators
Prior to creating the FDI, the Flex Monitoring Team identified and tracked 22 financial metrics specific to rural hospitals since 2005. This was the first attempt to standardize and
measure rural hospital performance, and was developed alongside rural hospital CEOs and CFOs in order to assure internal and external validity of the chosen metrics and measurement methods (Pink et al., 2006). The metrics spans the following six dimensions:
1. Profitability – measure the ability to generate the financial return required to replace assets, meet increases in service demands, and compensate investors (in the case of a for-profit organization).
4. Revenue – measure the amount and mix of different sources of revenue 5. Cost – measure the amount and mix of different types of costs
6. Utilization – measure the extent to which fixed assets (beds) are fully occupied
These metrics were compiled after extensive review of a shortlist of 37 potential financial performance metrics, which were then evaluated along the criteria of feasibility/observability, importance, and usefulness. The initial review resulted in a total of 20 metrics that were then included in the annual CAH Financial Indicators Report, which was released to 1,092 CAH CEOs in 2005 for review and feedback. In the research group’s 2006 paper, only these 20 performance indicators are listed. Since then, two more indicators have been added for a total of 22 (Flex Monitoring Team, 2019). A complete list of these metrics can be found in Table 3.1.
All financial metrics originated from Medicare Cost Report data, and the chosen metrics underwent pilot tests and accuracy assurances. A smaller group of rural hospital CFOs chosen by a third party reviewed the data before they were sent out to the CEOs. Having underwent
thorough review from varied stakeholders, the metrics being used in the present study have high internal and external validity.
Specific Financial Characteristics of Interest
to other rural hospitals, but also not heavily reliant on Medicare recipients (otherwise they would be an MDH) or the only hospital in their community (otherwise they would be a SCH). As such, they are by nature small hospitals experiencing some degree of market competition from other nearby hospitals, and are subject to both private and public pressures from federal government reimbursement provisions and private insurance companies. When these characteristics are accounted for, their financial performance is relatively stable compared to other similar rural hospitals (Holmes, Pink, and Friedman, 2013).
The evidence from this study also shows that removing the CAH designation would leave rural hospitals in even more perilous financial situations than they are currently experiencing, since CAHs did perform significantly better than PPS hospitals. The removal of the CAH program and special reimbursement provisions is estimated to increase the proportion of CAHs with negative margins from 28% to 44% (Holmes, Pink, and Friedman, 2013). Thus, the current CAH reimbursement provisions are essential to ensuring the financial health of rural hospitals, though they are still not enough to make the ubiquitous CAHs reliably financially secure.
Thus, it will be important to consider these specific metrics or proxies of these metrics in the present analysis.
In addition to the aforementioned metrics, earlier studies have shown that Negative Fund Balance, Large Decline in Fund Balance, Negative Cash Flow Margin, and Negative Operating Margin for Three Years are also all important predictors of hospital financial distress (Holmes and Pink, 2011). Many of these metrics are incorporated into aggregate metrics such as Total Margin or Days Cash on Hand. These are included as dependent variables in the present analysis, and a comprehensive summary of the calculations for these variables is available in Appendix C.
CHAPTER THREE – RESEARCH DESIGN
This analysis looks at the financial performance of a rural hospital in the years following a nearby hospital closure. The analysis will look at specific financial metrics representing
profitability, liquidity, revenue, cost, and utilization, and will examine a Financial Distress Index that captures overall financial health and risk of future closure for a subset of hospitals.
Dependent Variable
The dependent variable (Y) will measure financial performance of rural hospitals located near the closure. The dependent variables are continuous and will capture specific changes in financial health that may occur over time. There are six total dependent variables in this study: five specific financial metrics that each represent a different dimension of financial performance, and one holistic Financial Distress Index (FDI).
Five Key Financial Metrics
are underlined in Table 3.1, which shows all 22 metrics identified by the Flex Monitoring Team and how they align with each of the financial dimensions (Flex Monitoring Team, 2019).
Capital structure was the one financial dimension excluded from this study. The theory that movement of patients following the wake of a nearby closure is what drives changes in financial viability does not hold for capital structure. That is to say, the movement of patients does not theoretically explain changes in a hospital’s capital structure, equity financing, debt service coverage, or other business investment decisions. Furthermore, hospitals that choose to utilize financial vehicles such as equity financing or debt are fundamentally different from those who choose not to utilize these financial vehicles. In the dataset used, thousands of hospital-year observations did not report capital structure metrics. It is unclear whether these missing values indicate that they accepted zero dollars in equity financing, invested zero dollars in capital that year, or simply did not report data. For these reasons, capital structure was excluded from the present analysis, while metrics for profitability, revenue, cost, liquidity, and utilization were ultimately included in the analysis.
TABLE 3.1: 22 Financial Metrics for Measuring CAH Financial Health and Five Metrics Used
Profitability Total Margin Cash Flow Margin Return on Equity
Cost Salaries to Net Patient Revenue Average Age of Plant
FTEs per Adjusted Occupied Bed Average Salary per FTE
Revenue Outpatient Revenues to Total Revenues Patient Deductions
Medicare Inpatient Payer Mix Medicare Outpatient Cost to Charge Medicare Revenue per Day
Utilization Average Daily Census Swing SNF Beds Average Daily Census Acute Beds
Liquidity Current Ratio Days Cash on Hand
Days Revenue in Gross Accounts Receivable
Capital Structure Equity Financing Debt Service Coverage
Long-Term Debt to Capitalization Source: Flex Monitoring Team, 2019
Total Margin captures the profitability dimension and provides an idea of the overall profitability and financial health of the hospital. Days Cash on Hand captures the liquidity dimension and reflects the hospital’s financial resiliency through its ability to cover unexpected costs, should they arise. Outpatient Revenues to Total Revenues captures the revenue dimension and represents the inpatient/outpatient reimbursement mix at the hospital, which represent different revenue streams since inpatient and outpatient claims can vary in claim size and
reimbursement rate. Salaries to Net Patient Revenue captures the cost dimension and shows how the hospital’s non-reimbursable labor costs compare to its main source of revenue. Lastly,
Average Daily Census Acute Beds captures the utilization dimension and shows how the hospital uses its available acute beds on a daily basis. The methodology for calculating these variables, as well as the FDI, is available in Appendix C.
1 Financial Distress Index
The North Carolina Rural Health Research Program developed a Financial Distress Index (FDI) that captures the overall financial health of rural hospitals (Kaufman, Holmes, and Pink, 2016). The FDI categorizes hospitals into high, medium-high, medium-low, and low risk of financial distress in the next two years based on 12 predictors across four financial events: unprofitability, equity decline, insolvency and closure. Furthermore, it takes into consideration financial performance, organizational characteristics, market characteristics, and government reimbursement. Hospitals may move between different risk categories in any given fiscal year. A summary of the FDI calculation methodology can be found in Appendix C.
FDI categorizations are readily available for most rural hospitals in the years 2014-2018 through the North Carolina Rural Health Research Program at the University of North Carolina at Chapel Hill. The FDI provides a measure of overall financial health that goes beyond the specific five financial metrics included in the first part of the analysis. Larger trends in rural hospital financial health will be captured when analyzing the effect of a nearby closure on a hospital’s FDI. Comparing the results of this analysis will add robustness to the previous results, or reveal areas for further research.
Independent Variable
The independent variable (X) is the years since a nearby hospital closure. This is a discrete variable. This variable was constructed by determining the straight-line distance to the hospital’s nearest neighbor in a given year. When the distance to the nearest neighbor increased in the next year, the change was registered as a nearby closure.
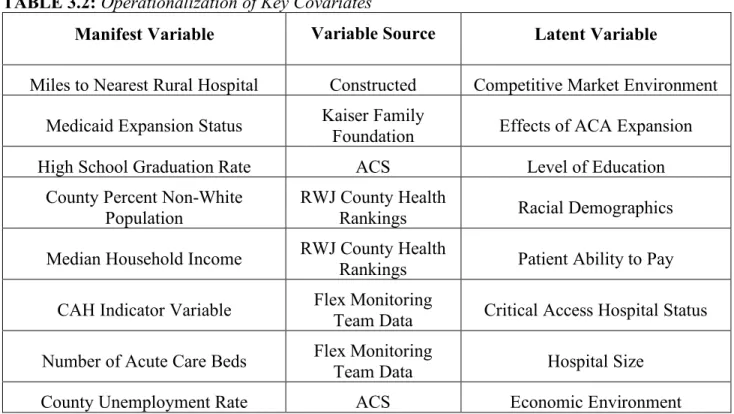
chapter regarding sample and subsample selection. There will also be eight covariates included in this analysis, as underlying factors relevant to the population and the location of the hospital are likely to influence the financial health of the hospital. A list of observable covariates, as well as their sources and the latent variable they operationalize, is provided below in Table 3.2.
TABLE 3.2: Operationalization of Key Covariates
Manifest Variable Variable Source Latent Variable
Miles to Nearest Rural Hospital Constructed Competitive Market Environment Medicaid Expansion Status Kaiser Family Foundation Effects of ACA Expansion
High School Graduation Rate ACS Level of Education
County Percent Non-White Population
RWJ County Health
Rankings Racial Demographics
Median Household Income RWJ County Health Rankings Patient Ability to Pay CAH Indicator Variable Flex Monitoring Team Data Critical Access Hospital Status Number of Acute Care Beds Flex Monitoring Team Data Hospital Size
County Unemployment Rate ACS Economic Environment
Medicaid expansion status, miles to the nearest hospital, CAH status, number of acute beds, county unemployment rate, and median household income are available for each year in the panel from 2011-2018. County percent non-white population and high school graduation rate are not expected to have changed significantly during the period of 2011-2018, and so only county-level data from the midpoint year of 2015 are used for those covariates in this analysis.
Data Availability and Limitations
The hospital-level dataset used in this analysis is provided by the NC Rural Health Research Program, and documents 22 key financial metrics for rural hospitals. These metrics are calculated from Medicare Cost Report Data from the Centers for Medicare and Medicaid
Services. The Robert Wood Johnson Foundation’s County Health Rankings data for 2011-2018 and the American Community Survey were also used for county-level data. Information on state-level Medicaid expansion under the ACA is from the Kaiser Family Foundation. Data through the NC Rural Health Research Program is free but not readily made public, though the
methodology to calculate the financial metrics and the FDI from the Medicare Cost Report data, which is free and open to the public, is publicly available.
The financial metric data contains panel data, with identifying information across time for both individual hospitals and their associated counties. The unit of analysis is hospital-years, to see whether the financial performance (measured by the financial indicators) of hospitals changes in the years following a neighbor’s closure. CAH status will be used to conduct subgroup analysis for each regression.
the ACA at varying times of the year, occasionally in accordance with calendar years, but often in accordance with their own capabilities and financial years. County Health Rankings data and USDA data both use calendar years. Hospital closures occur at no consistent time of year. The financial metric data counts fiscal year end dates in days since January 1, 1960. Thus, this challenge can be partially mitigated by also converting known Medicaid expansion
implementation dates into days since January 1, 1960, before merging the datasets. Exact dates for hospital closures are not known, and are assumed to happen at the turn of a calendar year, allowing closures to align with annual county-level demographic and income data.
There is no primary data collection involved in this study. The analysis focuses on secondary data analysis of data sources that are largely free and available to the public.
Defining the Sample and Subsample
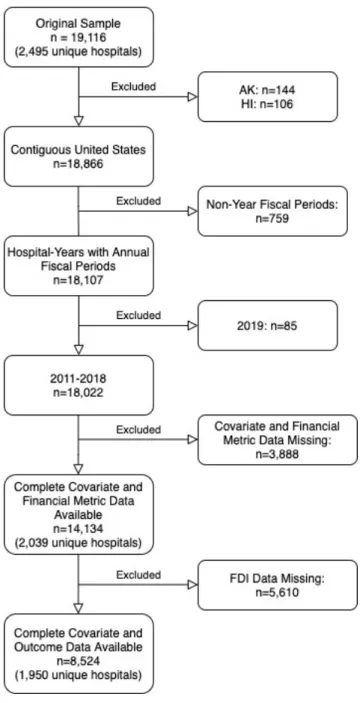
The main analytical sample only includes rural hospitals either (1) located in non-metro areas according to the 2013 Rural-Urban Continuum Codes OR (2) located in a Rural-Urban Commuting Area (RUCA) greater than or equal to 4 OR (3) designated as a Critical Access Hospital. A description of the rural-urban categorizations can be found in Appendix B. A flowchart of exclusion criteria can be found in Figure 3.1.
Hospitals located in Puerto Rico, the District of Columbia, Hawaii, and Alaska were excluded. Hospital-years for 2019 were excluded due to inconsistent availability of data in 2019. Hospital-years with fiscal years within one week of 365 days were included, while irregular hospital-years were excluded. Shannon County, South Dakota underwent a name change in 2015 to Oglala Lakota County (FIPS=46113). Bedford City, Virginia (FIPS=51515), was also
over the research period. These discrepancies contributed to inconsistent and incomplete covariate data for each hospital-year. Any other observations with missing covariate data were excluded as well, for a main analytical sample of 14,134 hospital-year observations. Table 3.5
provides a summary statistic of each outcome variable.
A subset of the main sample was used to analyze the effects of a nearby closure on the overall FDI over time. A smaller subset of the main sample was used because of incomplete data reporting. Of the 14,134 hospital-year observations in the main analytical sample, 5,610 reported missing FDI outcomes. Consequently, 8,524 observations were included in the subsample. The Flex Monitoring Team began incorporating FDI categories into its dataset starting in 2014, which coincides with the first wave of ACA expansion by states. Thus, many of the missing hospital-year observations occurred in 2011-2013. Table 3.9 compares the number of
observations included in the subsample compared to the main sample in the years 2014-2018 only.
This sample selection methodology retained some hospitals that were located in majority-metro counties, but these hospitals are included in the sample because they fall into a non-majority-metro area of an otherwise populated county, have received CAH designation, or are located in a rural RUCA code.
FIGURE 3.1. Exclusion Flowchart for Determining Sample and Subsample. n denotes hospital-years.
Data included in the sample were less likely to be a CAHs, but more likely to have higher median household incomes, higher unemployment rates, higher graduation rates, higher
TABLE 3.3. T-Test of Observations Included and Excluded from Main Sample
Covariate Analytical Sample Mean (SD)
(n=14,134) Excluded Obs. Mean (SD) (n=3,888) p-value Years Since Closure of Nearest
Neighbor 0.054 (0.00) 0.046 (.01) 0.35
Median Household Income
(000s) 44.6 (0.08) 43.4 (0.15) ***0.00
Unemployment Rate 0.062 (0.00) 0.056 (0.00) ***0.00
High School Graduation Rate 0.836 (0.00) 0.807 (0.00) ***0.00
Percent Nonwhite Population 0.201 (0.00) 0.214 (0.00) ***0.00
Miles to the Nearest Hospital 19.8 (0.09) 22.6 (0.20) ***0.00
ACA Expansion Status 0.314 (0.00) 0.255 (0.01) ***0.00
CAH Status 0.546 (0.00) 0.663 (0.01) ***0.00
Number of Acute Beds 49.0 (0.41) 38.3 (0.73) ***0.00
Thus, the excluded observations include many small, isolated, and CAH hospitals that are located in more remote areas, as indicated by the significantly greater mean miles to nearest hospital and the significantly smaller mean number of beds in the excluded group. It is
concerning that the excluded observations do not appear to be random. However, the hospitals that were excluded are not representative of the typical rural hospital, and the number of excluded observations is relatively small.
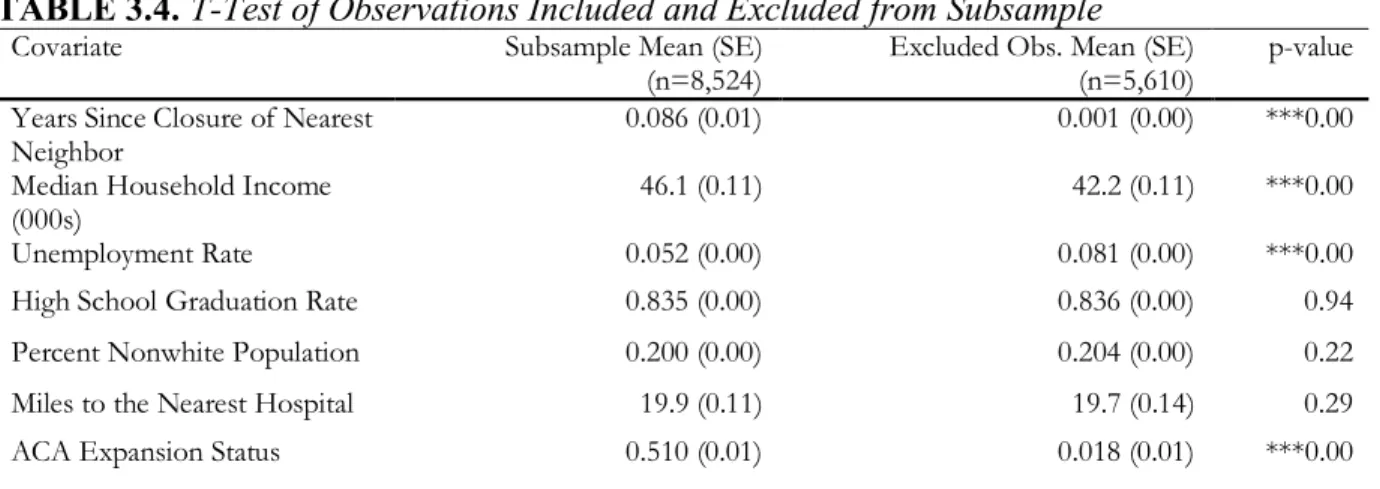
The subsample will be used to conduct analysis on the effect of a nearby closure on the FDI of the hospital of interest. A comparison of the data included and excluded from the subsample is available in Table 3.4.
TABLE 3.4. T-Test of Observations Included and Excluded from Subsample
Covariate Subsample Mean (SE)
(n=8,524) Excluded Obs. Mean (SE) (n=5,610) p-value Years Since Closure of Nearest
Neighbor 0.086 (0.01) 0.001 (0.00) ***0.00
Median Household Income
(000s) 46.1 (0.11) 42.2 (0.11) ***0.00
Unemployment Rate 0.052 (0.00) 0.081 (0.00) ***0.00
High School Graduation Rate 0.835 (0.00) 0.836 (0.00) 0.94
Percent Nonwhite Population 0.200 (0.00) 0.204 (0.00) 0.22
Miles to the Nearest Hospital 19.9 (0.11) 19.7 (0.14) 0.29
CAH Status 0.555 (0.01) 0.532 (0.01) ***0.01
Number of Acute Beds 48.3 (0.41) 50.1 (0.73) **0.03
Hospital-years included in the subsample were more likely to have experienced a nearby closure, to have higher median household incomes, lower unemployment rates, be located in Medicaid expansion status, be a CAH, and have fewer beds than those that were not. The first states to adopt Medicaid expansion under the ACA did so in 2014, which coincides with first year that FDI was assigned to hospitals by the Flex Monitoring Team. Thus, many of the hospital-year observations excluded from the subsample occur before 2014, explaining the significantly higher likelihood that an observation included in the sample is located in a Medicaid expansion state. Additionally, the United States experience vast economic growth in the period of 2011-2018, with greater growth in 2014-2018 than in 2011-2018. Knowing that observations from 2011-2013 are excluded from the subsample, it is expected that the subsample would have higher median household income and lower unemployment rates than the main sample. Table 3.9 compares the number of hospital years in the subsample to the main sample in the years 2014-2018, and shows that for those years, most hospitals were categorized into an FDI risk category.
Description of the Data
Consensus Beds appear to both be gamma-distributed, with high densities towards the left of the distribution and low densities towards the right. FDI is a fairly uniformly distributed ordinal categorical variable. Descriptive characteristics for the financial metric variables can be found below, in Table 3.5. The distribution of FDI across the subsample can be found in Table 3.6, also below.
TABLE 3.5. Descriptive Statistics of Financial Metric Outcome Variables
Variable Obs Mean Std.Dev. Min Max
Total Margin 14,134 0.022 0.107 -0.976 0.732
Salaries to Net Patient Revenues 14,134 0.437 0.105 0 1
Days Cash on Hand 14,134 115.9 141.0 0 996.8
Outpatient Revenue to Total Revenues 14,134 0.715 0.121 0.01 1
Acute Average Daily Census Beds 14,134 16.8 26.9 0.003 312.3
TABLE 3.6. Tabulation of Financial Distress Index for Hospital-Years in Subsample
Risk Category Freq. Percent
Low 2,634 30.90
Mid-Low 3,756 44.06
Mid-High 1,412 16.56
High 722 8.47
Total 8,524 100.0
The independent variables in the analysis are Number of Acute Care Beds, CAH Status, County High School Graduation Rate, County Percent Non-White Population, Miles to Nearest Rural Hospital, Medicaid Expansion Status, County Unemployment Rate, County Median Household Income, and Years Since Nearest Hospital Closure. All independent variables are continuous except for CAH Status (binary), Number of Acute Care Beds (discrete), and
Medicaid Expansion Status (binary). Table 3.7 summarizes the descriptive statistics for the main sample (n=14,134).
TABLE 3.7. Descriptive Statistics of Independent Variables, Main Sample
Variable Obs Mean Std.Dev. Min Max
Number of Acute Beds 14,134 49.0 49.2 0 527
(CAH=1)
County HS Graduation Rate 14,134 0.836 0.092 0.2 1
County Percent Nonwhite Population 14,134 0.201 0.182 0.018 0.968
Miles to the Nearest Hospital 14,134 19.7 10.8 0 114.5
Medicaid Expansion Status
(Expanded=1) 14,134 0.312 0.463 0 1
County Unemployment Rate 14,134 0.064 0.027 0.011 0.289
County Median Household Income
(000s) 14,134 44.6 9.53 20.5 112.1
Years Since Closure of Nearest
Neighbor 14,134 0.054 0.409 0 6
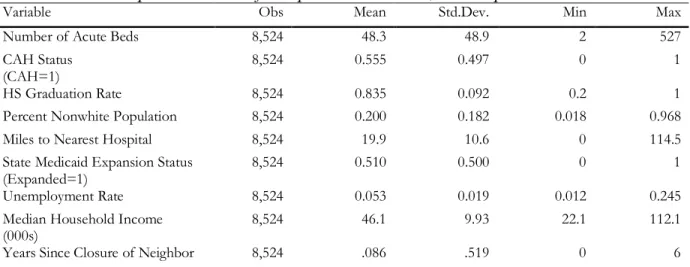
Table 3.8 summarizes the explanatory variables for the subsample (n=8,524). The Flex Monitoring Team started assigning risk categories to hospitals starting in 2014 rather than 2011, so a large amount of the missing data is for hospital-year observations occurring between 2011-2013. Table 3.9 gives a better picture of the representativeness of the subsample by comparing the number of hospital-years in the subsample to the number of hospital-years in the main sample for the years 2014-2018 only.
TABLE 3.8. Descriptive Statistics of Independent Variables, Subsample
Variable Obs Mean Std.Dev. Min Max
Number of Acute Beds 8,524 48.3 48.9 2 527
CAH Status
(CAH=1) 8,524 0.555 0.497 0 1
HS Graduation Rate 8,524 0.835 0.092 0.2 1
Percent Nonwhite Population 8,524 0.200 0.182 0.018 0.968
Miles to Nearest Hospital 8,524 19.9 10.6 0 114.5
State Medicaid Expansion Status
(Expanded=1) 8,524 0.510 0.500 0 1
Unemployment Rate 8,524 0.053 0.019 0.012 0.245
Median Household Income
(000s) 8,524 46.1 9.93 22.1 112.1
Years Since Closure of Neighbor 8,524 .086 .519 0 6
TABLE 3.9. Inclusion of Hospitals in the Subsample for 2014-2018
Variable 2014 2015 2016 2017 2018
Hospital-Years in
Subsample 1,751 1,720 1,697 1,682 1,674
Hospital Years in Main
Sample 1,813 1,779 1,750 1,739 1,714
The subsample only contains data from the years 2014-2018 because of the lack of FDI data prior to 2014. However, in 2014-2018, nearly all hospitals in the main sample were assigned FDI categories and were included in the subsample, demonstrating that although the subsample is not representative of the years 2011-2018, it is representative of the years 2014-2018.
Determining the Correct Regression Models
Several models were explored for each dependent variable. For all regressions, panel data was specified and cluster robust standard errors were used.
Fit of the model to the data was determined using the Akaike Information Criterion (AIC) and the Bayes Information Criterion (BIC). Table 3.10 lists the regression model ultimately used for each outcome variable in this analysis. All regressions were done using cluster standard errors and a panel data specification.
TABLE 3.10. Regression Models Used for Each Outcome Variable
Outcome Variable Regression Model Used
Total Margin Generalized Linear Model with log link
function and gaussian distribution family Salaries to Net Patient Revenues Generalized Linear Model with log link
function and gamma distribution family Days Cash on Hand Generalized Linear Model with log link function and gamma distribution family Outpatient Revenue to Total Revenues Generalized Linear Model with log link function and gamma distribution family Acute Average Daily Census Beds Generalized Linear Model with log link function and gamma distribution family
FDI/Risk Category Ordered Logit Model
each outcome variable, both gaussian and gamma distributions were considered, and the model with the lowest AIC and BIC was chosen.
FDI, as a ordinal categorical variable, required the use of an ordered logit model. Nonbinary and Poisson distributions were also considered, but the AIC and BIC levels indicated that the ordered logit model was a better fit for FDI.
Tables outlining the model specification process, including all associated AICs and BICs for each model and each dependent variable, can be found in Appendix E.
Methods
This analysis will use a generalized linear model for the continuous variables. The statistical model will include hospital fixed effects based on annual hospital-level and county-level data. An example of the final formula is provided below:
𝛽"represents the correlation between the years since a nearby hospital closure and the change in a given financial indicator of the hospital of interest. The independent variable, Χ", is years since nearby hospital closure. 𝛽$through 𝛽%represent the covariate relationship between the control variables and the given financial indicator. k=9 because there is one independent variable of interest and 8 additional covariates, as listed in Table 3.2. 𝛾(and 𝛿*+ represent the hospital and county-time fixed effects, respectively. Hospital fixed effects capture differences between hospitals that do not change over time and are not observed in the data (e.g. number of beds, quality of service, skill of employees, etc.). County-time fixed effects capture those changes that would be the same for every hospital in a given county at a given time, but vary across counties and across time (e.g. economic growth, Medicaid expansion, county-wide programs, state-level legislative or political effects, etc). 𝜀*(+ captures the error in the model. The generalized linear
model does not necessarily assume that the error is normally distributed, nor does it assume that the function
𝑌
*(+ is a linear function. During the model specification process, variousCHAPTER FOUR – RESULTS AND ANALYSIS
Effect of Closure on Financial Metrics
CAH status and years since the closure of the nearest neighbor affected each dependent variable differently. Figure 4.1 demonstrates the predicted outcome for each of the five financial metrics in the years following the closure of the nearest rural neighbor. Graphs of the marginal effects of each year following the closure of the nearest rural neighbor can be found in Appendix F.
Total Margin
Figure 4.1 demonstrates that total margin tends to decrease in the years following the closure of a rural hospital’s nearest neighbor. However, this trend is not statistically significant across years or across CAH designation. CAH designation does, however, have a significant positive effect on the total margin that a hospital experiences prior to a nearby closure (p<0.05), a gap that appears to close in the years following a nearby closure. When controlling for county unemployment rate, high school graduation rate, median household income, and hospital size, we see that the remaining explanatory variables do not have a practical marginal effect on total margin. Though distance to the nearest hospital appears to have significant effects (p<0.01), the effect size is essentially zero. From Table 4.2, we see that increasing the distance to the nearest hospital increases the total margin of the hospital of interest by 0.03% on average. The effect sizes appear to be small due to the nature of the total margin dependent variable, which itself has a mean in this sample of 0.022, or a 2.2% profit margin.
CAH status and State Medicaid Expansion Status appear to have more substantive effects on total margin, though it seems the effect of CAH status diminishes with time. A hospital with CAH status has a total margin of 0.81 percentage points higher than a comparable hospital without CAH status (p<0.05), and a hospital in a Medicaid expansion state has a total margin of 0.95 higher still (p<.05).
TABLE 4.2. Marginal Effects of Key Explanatory Variables on Total Margin
dy/dx Std.Err. p-value [95%Conf. Interval] Years Since Closure of Neighbor -0.0032 0.0036 0.380 -0.0103 0.0039
Miles to Nearest Hospital*** 0.0003 0.0001 0.002 0.0000 0.0000 CAH Status** 0.0081 0.0040 0.046 -0.0001 0.0160 State Medicaid Expansion Status** 0.0095 0.0041 0.022 -0.0014 0.0177
Salaries to Net Patient Revenues
The Salaries to Net Patient Revenues metric gives an idea of the hospital’s cost structure by showing what portion of costs incurred by the hospital are non-reimbursable. Decreasing the ratio of salaries to net patient revenues means either salaries have decreased on average, or patient revenues have risen on average. From Table 4.3, it is clear that the ratio of salaries to net patient revenues decrease in the wake of a nearby closure. This trend may emerge because in times of financial difficulty—as suggested by the decreasing total margin trend seen in Figure 4.1—hospitals may task-shift away from higher-paid specialists in favor of lower-paid
generalists, decreasing the professional medical capacity of their hospitals as a result. CAHs are not significantly different from other rural hospitals, suggesting that their non-reimbursable cost structures are similar. However, As seen in Table 4.2, CAHs do often have higher margins, suggesting that if they have the same costs as other hospitals, they must have higher revenues on average, all else equal.
Years since closure of neighbor, miles to nearest hospital, and state Medicaid expansion status all significantly affect the ratio of salaries to net patient revenues. For each additional year since closure, we see that the ratio decreases significantly (p<0.01), at -0.5 percentage points per year, on average. This means that in the years following a nearby closure, rural hospitals see some combination of either increased revenues or decreased non-reimbursable costs.
Furthermore, this trend continues in each year following closure, and does not differ between CAHs and rural hospitals.
CAH status (p<0.01) and state Medicaid expansion status (p<0.01) also have small marginal effects, but no practical significance.
results for outpatient revenues are further explored, it is unclear whether hospitals are task-shifting away from specialty providers, downsizing personnel, or experiencing increased revenues as patients begin seeking outpatient services at the next nearest hospital when the hospital in their community closes.
TABLE 4.3. Marginal Effects of Key Explanatory Variables on Salaries to Net Patient Revenues
Outpatient Revenue to Total Revenue
Figure 4.1 and Table 4.4 both show that CAHs see a significantly greater portion of outpatient revenues compared to other rural hospitals (p<0.01). The marginal effect of CAH status on this particular outcome is 3.9 percentage points, demonstrating that CAHs rely more heavily on outpatient claim reimbursement as a source of revenue than other rural hospitals. Additionally, following a nearby hospital closure, the proportion of outpatient revenues continues to rise for both CAHs and other rural hospitals by 1.1 percentage points on average each year (p<0.01). State Medicaid expansion status also has an effect size of 3.2 percentage points (p<0.01). As seen previously in the effect of distance to the nearest hospital on total margins, distance also does not have an effect on the ratio of outpatient revenue to total revenue.
Together, these results show that in the years following a nearby closure, the proportion of outpatients treated in the hospital of interest increases. These findings align with the previous finding that the ratio of salaries to net patient revenues decreases in the wake of a closure. It appears that some portion of that effect is due to increased revenues, specifically from outpatient claims. Though these patients are contributing to both total revenues and the portion of
dy/dx Std.Err. p-value [95%Conf. Interval] Years Since Closure of Neighbor*** -0.0050 0.0019 0.008 -0.0087 -0.0013
Miles to Nearest Hospital*** 0.0005 0.0001 0.000 0.0003 0.0007 CAH Status 0.0003 0.0040 0.922 -0.0055 0.0061 State Medicaid Expansion Status*** -0.0005 0.0000 0.001 -0.0005 0.0004