Effects of Food Availability and Administration of Orexigenic and Anorectic Agents on Elevated Ethanol Drinking Associated with Drinking in the Dark Procedures
Angela Maria Lyons
A thesis submitted to the faculty of the University of North Carolina at Chapel Hill in partial fulfillment of the requirements for the degree of Master of Arts in the Department of Psychology (Behavioral Neuroscience).
Chapel Hill 2008
ABSTRACT
Angela M. Sparrow: Effects of Food Availability and Administration of Orexigenic and Anorectic Agents on Elevated Ethanol Drinking Associated with Drinking in the Dark
Procedures
(Under the direction of Dr. Todd E. Thiele)
Drinking in the dark (DID) procedures have recently been developed to induce high levels of ethanol drinking in C57BL/6J mice, which result in blood ethanol
concentrations reaching levels that have measurable affects on physiology and/or behavior. The present study determined if increased ethanol drinking associated with DID procedures may be motivated by caloric need rather than by the post-ingestive pharmacological effects of ethanol. To this end, a) the effects of food deprivation on ethanol consumption during DID procedures was assessed, or b) mice were given intraperitoneal injection of the orexigenic peptide ghrelin or the anorectic protein leptin before DID procedures. Neither food deprivation nor administration of orexigenic or anorectic compounds significantly altered ethanol drinking with DID procedures. The present observations are inconsistent with the hypothesis that C57BL/6J mice
iv
ACKNOWLEDGEMENTS
TABLE OF CONTENTS
LIST OF TABLES... . . ...vii
LIST OF FIGURES...viii
LIST OF ABBREVIATIONS...ix
Chapter I. INTRODUCTION...1
What is Binge Drinking...1
Animal Models of Binge Drinking...2
The Caloric Need Hypothesis...3
II. METHODS... .5
Animals...5
Experiment 1: Effects of Food Deprivation on Ethanol Intake Associated with DID Procedures... .5
Experiment 2: Effects of Ghrelin Injection on Ethanol Intake Associated with DID Procedures and Basal Food Consumption...6
Experiment 3: Effects of Leptin Injection on Ethanol Intake Associated with DID Procedures and Basal Food Consumption...8
Experiment 4: Hourly Measures of Food Intake and Saccharin Consumption... .9
Data Analysis... .9
vi
Experiment 1: Effects of Food Deprivation on Ethanol Intake
Associated with DID Procedures...10
Experiment 2: Effects of Ghrelin Injection on Ethanol Intake
Associated with DID Procedures and Basal Food Consumption...11
Experiment 3: Effects of Leptin Injection on Ethanol Intake
Associated with DID Procedures and Basal Food Consumption...11
Experiment 4: Hourly Measures of Food Intake and Saccharin
LIST OF TABLES
Table
1. Ethanol consumption (g/kg/2-hour) on days 1-3
viii
LIST OF FIGURES Figure
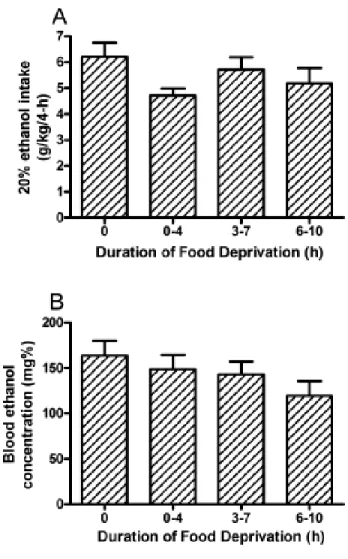
1. Consumption of 20% ethanol by C57BL/6J mice and associated blood ethanol concentrations during the
4-hour test day of Experiment 1………..18 2. Consumption of 20% ethanol by C57BL/6J mice and
associated blood ethanol concentrations during the
4-hour test day of Experiment 2………..19 3. Consumption of 20% ethanol by C57BL/6J mice and
associated blood ethanol concentrations during the
LIST OF ABBREVIATIONS ANOVA Analysis of variance
BEC Blood ethanol concentration CRF1 Corticotropin-releasing factor 1
DID Drinking in the dark
g/kg Gram per kilogram
i.p. Intraperitoneal
mg% Milligram percent mg/kg Milligram per kilogram ml/kg Milliliter per kilogram
v/v Volume per volume
CHAPTER 1 INTRODUCTION What is binge drinking?
Bing drinking has been defined by the National Institute on Alcohol Abuse and Alcoholism (NIAAA, 2004) as a pattern of alcohol drinking that produces blood alcohol concentrations (BACs) or 0.08 gram percent or above. This would
correspond to about 5 alcoholic beverages for males and 4 alcoholic beverages for females over a 2-hour period. Binge drinking is also different from “risky” drinking, which is consuming enough alcohol to produce BACs between 0.05 and 0.08 gram percent and a drinking “bender”, which is 2 or more days or heavy drinking (NIAAA, 2004). Binge drinking has become an important subject for researchers to study because it is a country-wide problem and in addition, the number of binge drinking episodes in U.S. adults has steadily increased over the years (Naimi et al., 2003). Many risks are associated with binge drinking such as an increased risk of injury and increased violent and aggressive behavior (Brewer et al., 2005). Binge drinking in adults causes impaired judgment and increases risky behaviors such as driving while intoxicated (Flowers et al., 2008). In addition, binge drinking can produce long-term health consequences such as an increased risk of developing metabolic
developing alcohol dependence in individuals that binge drink early in life (Miller et al., 2007; Hingson et al., 2006; Hingson et al., 2005). For all of these reasons, it is important that researchers study binge drinking and find ways to decrease the instances of binge drinking among U.S. adults.
Animal models of binge drinking
3
moderate amounts of ethanol, suggesting that CRF1 receptor signaling specifically modulates high ethanol intake (Sparta et al., 2008).
The caloric need hypothesis
As DID procedures involve providing C57BL/6J mice with access to ethanol towards the beginning of the dark cycle, increased ethanol drinking may be related to the high level of nocturnal ingestive behavior that is characteristic of mice (Ho and Chin, 1988; Tabarin et al., 2007). In fact, the highest levels of food intake in mice were found to occur during the first 4 hours of their 12 hour dark cycle (Tabarin et al., 2007), a window of time in which mice are given access to ethanol using DID procedures (Kamdar et al., 2007; Rhodes et al., 2005; Rhodes et al., 2007). Since ethanol contains calories, this raises the possibility that increased ethanol drinking associated with DID procedures results from presenting ethanol during a time of high caloric need, rather than an increased motivation to drink ethanol for its post-ingestive pharmacological effects.
related to increased caloric need, an orexigenic peptide such as ghrelin should further augment ethanol intake. In Experiment 3, we determined if the protein leptin would influence ethanol intake when given before DID procedures. Leptin is
synthesized in adipose tissue and reduces food intake when administered
CHAPTER 2 METHODS Animals
Male C57BL/6J mice (Jackson Laboratory, Bar Harbor ME) were used in all experiments. Mice were 6-8 weeks old when they arrived from the vendor and weighed between 25-30 g at the onset of the experiments. Mice were single housed in
polypropylene cages with corncob bedding. Standard rodent chow (Teklad, Madison, WI) and water were available at all times except where noted. The vivarium rooms were maintained at an ambient temperature of 22º C with a reverse 12-hour/12-hour light-dark cycle. Lights came on at 9:00 P.M. and went off at 9:00 A.M. Mice were acclimated to the environment for at least 10 days before the start of experiments. All experimental procedures were approved by the University of North Carolina Animal Care and Use Committee (IACUC) and were in compliance with the NIH Guide for Care and Use of Laboratory Animals.
Experiment 1: Effects of Food Deprivation on Ethanol Intake Associated with
DID Procedures
solution remained on the homecage for 2-hours during the training sessions (days 1 to 3) and for 4-hours on the test day (day 4). For each of the 4-days during DID procedures, 1 group of mice had ad libitum access to food (no food deprivation), the second group of mice had food removed from their cages 3-hours before the
beginning of the dark cycle, the third group of mice had food removed from their cages at the beginning of the dark cycle, and the fourth group of mice had food removed from their cages beginning 3-hours into the dark cycle. For all food deprived groups, food was returned 7-hours into the dark cycle. With this
arrangement, mice were food deprived for 0, 6 to 8, 3 to 5, or 0 to 2 hours during DID procedures on days 1 to 3 and 0, 6 to 10, 3 to 7, or 0 to 4 hours during DID procedures on day 4. Immediately following the 4-hours of ethanol access on day 4, tail blood samples (6 µl) were collected from all mice to determine BECs with an alcohol analyzer (Analox Instruments, Lunenburg, MA). On each day of study, ethanol consumption and body weight measures were recorded and the amount of ethanol consumed was calculated as g of ethanol consumed per kg of body weight (g ⁄ kg).
Experiment 2: Effects of Ghrelin Injection on Ethanol Intake Associated with DID
Procedures and Basal Food Consumption
7
intake. To habituate mice to i.p. injections, all mice received an i.p. injection of 0.9% saline (5 ml/kg) for two days prior to the start of the experiment and immediately before ethanol access on days 1-3. Mice were then distributed into 3-groups (n = 10/group) matched for average ethanol consumption that occurred over the first 3-days of the experiment (that is, the mice were distributed so that the baseline level of ethanol consumption was approximately equal between the groups). On the fourth day, mice were given an i.p. injection of one of three doses (0, 10, or 30 g/kg) of mouse ghrelin (Phoenix Pharmaceuticals, Inc., Burlingame, CA) mixed in 0.9% saline immediately before application of the ethanol bottle. The 30 g/kg dose of ghrelin has been shown to significantly increase 4-hour food intake by mice (Chen et al., 2004). Tail blood (6 µl) was collected from all mice immediately following the 4-hour test session to determine BECs. Ethanol consumption and body weight measures were recorded and the
amount of ethanol consumed was calculated as g of ethanol consumed per kg of body weight (g/kg).
Experiment 3: Effects of Leptin Injection on Ethanol Intake Associated with
DID Procedures and Basal Food Consumption
The procedures were similar to those in Experiment 2. Because leptin reduces food intake, food was removed from mice cages just before i.p. injections to avoid any confounds associated with altered ethanol drinking secondary to changes in food intake. Just before the beginning of the dark cycle, mice received an i.p. injection of 15mM HCl mixed with 7.5mM NaOH in saline (16 ml/kg, the vehicle used for leptin) for 2-days prior to the start of the experiment and on days 1-3 of the experiment to habituate them to the injection procedures. Mice were then distributed into 2-groups (n = 10/group) matched for average ethanol consumption that occurred over the first 3-days of the experiment. On the fourth day, mice were given an i.p. injection of vehicle or mouse leptin (20 µg/g mixed in 0.9% saline containing 15mM HCl and 7.5mM NaOH; Calbiochem, San Diego, CA) immediately before lights out. We chose to given leptin at the beginning of the dark phase rather than just before ethanol access because the actions of this dose of leptin on food last for up to 24-hours (Prpic et al., 2003). Ethanol bottles were placed on the cages 3-hours into the dark cycle as per the DID schedule. Tail blood sample (6 µl) was collected from all mice immediately following the 4-hour test session to determine BECs. Ethanol consumption and body weight measures were recorded and the amount of ethanol consumed was
calculated as g of ethanol consumed per kg of body weight (g/kg).
9
habituation injections (i.p.) of the leptin vehicle at the beginning of the dark cycle. Mice were then given an i.p. injection of vehicle or mouse leptin (20 µg/g) immediately before lights out and food consumption was measured starting 3-hours into the dark cycle and continued for 4-hours. Food consumption was calculated as g/4-hours. Experiment 4: Hourly Measures of Food Intake and Saccharin Consumption
Naïve C57BL/6J mice (n = 7) were used to assess the consummatory patterns of food (caloric substance) or a 0.05% (w/v) saccharin solution (non-caloric
substance). After habituation to the environment (2-weeks), food consumption was measured hourly starting 1-hour before the beginning of the dark cycle and continuing until 11-hours into the dark cycle (thus, 4-hours before and after the normal DID testing period). Food consumption was calculated as g consumed for each hourly measure. After food measures were complete, the same mice were given 4-days of two bottle choice access to water and a 0.05% saccharin solution to habituate them to the novel tastant. Following the habituation period, hourly measures of saccharin solution were assessed beginning 1-hour before the beginning of the dark cycle until 11-hour into the dark cycle. Saccharin consumption was calculated as g consumed per kg of body weight (g/kg) for each hourly measure.
Data Analysis
CHAPTER 3 RESULTS
Experiment 1: Effects of Food Deprivation on Ethanol Intake Associated with
DID Procedures
Ethanol consumption during the 2-hour access on days 1-3 of Experiment 1 are presented in top portion of Table 1. ANOVAs revealed no significant group differences in ethanol consumption during days 1-3. Ethanol consumption and blood ethanol concentration data from the 4-hour test day of Experiment 1 are presented in Figs. 1A and 1B, respectively. One-way ANOVAs performed on these data revealed no
significant effect of food deprivation on ethanol consumption [F(3, 36) = 1.77, p = 0.17] or blood ethanol concentrations [F(3, 36) = 1.44, p = 0.25]. There was a significant correlation between the amount of ethanol consumed and blood ethanol levels [R = 0.69, p < 0.001].
Experiment 2: Effects of Ghrelin Injection on Ethanol Intake Associated with
DID Procedures and Basal Food Consumption
Ethanol consumption during the 2-hour access on days 1-3 of Experiment 2 are presented in middle portion of Table 1. ANOVAs revealed no significant group
11
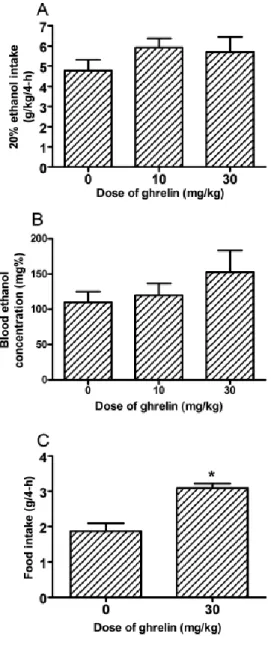
[F(2, 22) = 1.06, p = 0.36] or blood ethanol levels [F(2, 22) = 1.10, p = 0.35]. There was a significant correlation between the amount of ethanol consumed and blood ethanol concentrations [R = 0.604, p = 0.001]. The effects of ghrelin on food consumption are presented in Fig. 3C. Administration of the 30 mg/kg dose of ghrelin significantly increased 4-h food consumption [F(1, 16) = 21.30, p < 0.001], verifying that this dose of ghrelin was physiologically active in C57BL/6J mice.
Experiment 3: Effects of Leptin Injection on Ethanol Intake Associated with
DID Procedures and Basal Food Consumption
Ethanol consumption during the 2-hour access on days 1-3 of Experiment 3 are presented in bottom portion of Table 1. ANOVAs revealed no significant group
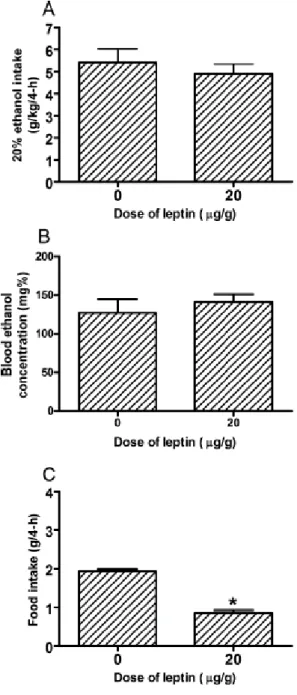
differences in ethanol consumption during days 1-3. Ethanol consumption and blood ethanol concentration data from the 4-hour test day of Experiment 3 are presented in Figs. 3A and 3B, respectively. One-way ANOVAs performed on these data revealed that the 20 µg/g dose of leptin did not significantly alter ethanol consumption [F(1, 18) = 0.45, p = 0.51] or blood ethanol levels [F(1, 18) = 0.46, p = 0.50]. There was a significant correlation between the amount of ethanol consumed on day 4 and blood ethanol concentrations [R = 0.55, p = 0.01]. The effects of leptin on food consumption are presented in Fig. 3C. Importantly, administration of 20 µg/g dose of leptin
significantly decreased 4-hour food consumption [F(1, 8) = 107.88, p < 0.001], verifying that this dose of leptin was physiologically active in C57BL/6J mice.
Experiment 4: Hourly Measures of Food Intake and Saccharin Consumption
The hourly consumption measures for food and 0.05% saccharin from
data reveal that C57BL/6J mice showed highest levels of food intake during the period of the dark cycle during which ethanol is administered with DID procedures (Fig. 4A). Similarly, 0.05% saccharin solution consumption reached its peak levels during the time period used with DID procedures (Fig. 4B). To analyze these data, we averaged the data into three, 4-hour blocks of time which corresponded to the 4-hour period before the time of DID procedures, the 4-hour period during the time of DID procedures, and the 4-hour period after the time of DID procedures. A repeated measures ANOVA performed on food intake data revealed a significant effect of time block [F(1, 6) = 987.95, p < 0.001]. Post hoc tests showed that food intake was
significantly higher during the block of time corresponding to DID manipulations relative to either the 4-hour block of time before or after this period. Similarly, a repeated
CHAPTER 4 DISCUSSION
drinking promoted by DID procedures are unlikely motivated by caloric need, but rather by other factors such as the pharmacological post-ingestive effects of ethanol.
Interestingly, during the period of time that C57BL/6J mice received ethanol with DID procedures, they exhibited their highest levels of food intake when measures were collected from 4-hours before to 4-hours after the period of time used with DID
procedure (Fig. 4A). At first glance, this observation appears to be consistent with the hypothesis that high levels of ethanol intake might be related to caloric need.
However, we also observed that C57BL/6J mice showed high levels of saccharin solution consumption during this same period of time (Fig. 4B). Since saccharin is a non-caloric compound with reinforcing properties, increased consumption of saccharin cannot be related to increased caloric need. An alternative explanation is that
C57BL/6J mice exhibit an increased motivation to consume reinforcing stimuli (such as food, sweet flavors, and ethanol) during the time of day that DID procedures are performed, and increased motivation to consume these reinforcing stimuli is independent of the reinforcer’s caloric content.
The present observation that ghrelin did not alter ethanol consumption in
C57BL/6J mice is consistent with a recent report showing that hypothalamic infusion of ghrelin increased food intake but did not alter ethanol drinking in Sprague-Dawley rats (Schneider et al., 2007). Interestingly, plasma ghrelin levels were found to be elevated in alcoholics relative to normal individuals (Kraus et al., 2005) and plasma ghrelin levels were positively correlated with self-reports of craving in alcoholics (Addolorato et al., 2006). These observations suggest that while ghrelin may modulate
15
the ingestion of ethanol. Similarly, the present work with leptin is consistent with the observation that repeated daily injections of leptin failed to alter ethanol drinking in rats, although leptin did appear to augment deprivation-induced increases of ethanol
drinking (Kiefer et al., 2001). However, disruption of leptin signaling in mutant mice was associated with reduced ethanol intake (Blednov et al., 2004). Circulating levels of leptin have also been found to be elevated in alcoholics, and are correlated with subjective reports of craving in alcoholics (Kiefer et al., 2005; Nicolas et al., 2001). Thus, as with ghrelin, while leptin may be involved with craving in human alcoholics, its role in modulating ethanol consumption in animal models remains unclear.
In the present report, we observed BECs in C57BL/6J mice that ranged from approximately 100 to 150 mg%. These levels of BECs are consistent with previous reports that have used DID procedures (Kamdar et al., 2007; Rhodes et al., 2005; Rhodes et al., 2007). Because C57BL/6J mice exhibit signs of behavioral intoxication with BECs in this range (Rhodes et al., 2007), DID procedures appear to provide a valid animal model of drinking to the point of physiological intoxication, and may be useful for identifying targets that may be protective against binge-like ethanol drinking (Kamdar et al., 2007; Moore et al., 2007; Sparta et al., 2008). The present results further strengthen the usefulness of this model by showing that elevated drinking with DID procedures is unlikely related to caloric need.
17
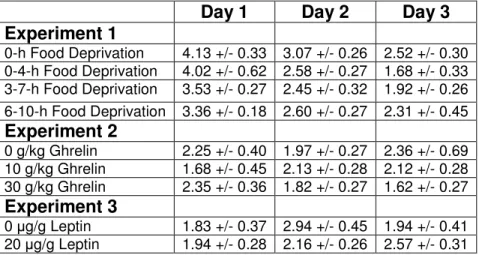
Table 1: Ethanol consumption (g/kg/2-hour) on days 1-3 (mean + SEM) of Experiments 1-3.
Day 1 Day 2 Day 3 Experiment 1
0-h Food Deprivation 4.13 +/- 0.33 3.07 +/- 0.26 2.52 +/- 0.30 0-4-h Food Deprivation 4.02 +/- 0.62 2.58 +/- 0.27 1.68 +/- 0.33 3-7-h Food Deprivation 3.53 +/- 0.27 2.45 +/- 0.32 1.92 +/- 0.26 6-10-h Food Deprivation 3.36 +/- 0.18 2.60 +/- 0.27 2.31 +/- 0.45 Experiment 2
0 g/kg Ghrelin 2.25 +/- 0.40 1.97 +/- 0.27 2.36 +/- 0.69 10 g/kg Ghrelin 1.68 +/- 0.45 2.13 +/- 0.28 2.12 +/- 0.28 30 g/kg Ghrelin 2.35 +/- 0.36 1.82 +/- 0.27 1.62 +/- 0.27 Experiment 3
19
Figure 2: Consumption of 20% (v/v) ethanol by C57BL/6J mice (A) and associated blood ethanol concentrations (B) during the 4-hour test day of Experiment 2.
Immediately before ethanol access, food was removed from the cages and mice were given an intraperitoneal (i.p.) injection of mouse ghrelin (0, 10, 30 mg/kg). Ghrelin did not significantly alter ethanol consumption or blood ethanol
Figure 3: Consumption of 20% (v/v) ethanol by C57BL/6J mice (A) and associated blood ethanol concentrations (B) during the 4-hour test day of Experiment 3.
Immediately before lights out, food was removed from the cages and mice were given an i.p. injection of mouse leptin (0, 20 µg/g). Leptin did not alter ethanol
consumption or blood ethanol concentrations. A 20 µg/g dose of leptin did
21
REFERENCES
Addolorato G, Capristo E, Leggio L, Ferrulli A, Abenavoli L, Malandrino N, Farnetti S, Domenicali M, D'Angelo C, Vonghia L, Mirijello A, Cardone S, Gasbarrini G (2006) Relationship between ghrelin levels, alcohol craving, and nutritional status in current alcoholic patients. Alcohol Clin Exp Res 30: 1933-1937. Blednov YA, Walker D, Harris RA (2004) Blockade of the leptin-sensitive pathway
markedly reduces alcohol consumption in mice. Alcohol Clin Exp Res 28: 1683-1692.
Brewer RD, Swahn MH (2005) Binge drinking and violence. JAMA 294: 616-618. Chen HY, Trumbauer ME, Chen AS, Weingarth DT, Adams JR, Frazier EG, Shen Z,
Marsh DJ, Feighner SD, Guan XM, Ye Z, Nargund RP, Smith RG, Van der Ploeg LH, Howard AD, MacNeil DJ, Qian S (2004) Orexigenic action of peripheral ghrelin is mediated by neuropeptide Y and agouti-related protein.
Endocrinology 145: 2607-2612.
Fan AZ, Russell M, Naimi T, Li Y, Liao Y, Jiles R, Mokdad AH (2008) Patterns of alcohol consumption and metabolic syndrome. J Clin Endocrinol Metab (In Press).
Flowers NT, Naimi TS, Brewer RD, Elder RW, Shults RA, Jiles R (2008) Patterns of alcohol consumption and alcohol-impaired driving in the United States.
Alcohol Clin Exp Res 32: 639-644.
Halaas JL, Gajiwala KS, Maffei M, Cohen SL, Chait BT, Rabinowitz D, Lallone RL, Burley SK, Friedman JM (1995) Weight-reducing effects of the plasma protein encoded by the obese gene. Science 269: 543-546.
Hingson RW, Heeren T, Winter MR (2006) Age of alcohol-dependence onset: associations with severity of dependence and seeking treatment. Pediatrics
118:e755-763.
Hingson R, Heeren T, Winter M, Wechsler H (2005) Magnitude of alcohol-related mortality and morbidity among U.S. college students ages 18-24: changes from 1998 to 2001. Annu Rev Public Health 26:259-279.
Ho A, Chin A (1988) Circadian feeding and drinking patterns of genetically obese mice fed solid chow diet. Physiol Behav 43: 651-656.
23
Kiefer F, Jahn H, Otte C, Demiralay C, Wolf K, Wiedemann K (2005) Increasing leptin precedes craving and relapse during pharmacological abstinence maintenance treatment of alcoholism. J Psychiatr Res 39: 545-551. Kiefer F, Jahn H, Wolf K, Kampf P, Knaudt K, Wiedemann K (2001) Free-choice
alcohol consumption in mice after application of the appetite regulating peptide leptin. Alcohol Clin Exp Res 25: 787-789.
Kraus T, Schanze A, Groschl M, Bayerlein K, Hillemacher T, Reulbach U, Kornhuber J, Bleich S (2005) Ghrelin levels are increased in alcoholism. Alcohol Clin Exp Res 29: 2154-2157.
Miller JW, Naimi TS, Brewer RD, Jones SE (2007) Binge drinking and associated health risk behaviors among high school students. Pediatrics 119:76-85. Moore EM, Serio KM, Goldfarb KJ, Stepanovska S, Linsenbardt DN, Boehm SL, 2nd
(2007) GABAergic modulation of binge-like ethanol intake in C57BL/6J mice.
Pharmacol Biochem Behav 88: 105-113.
Naimi TS, Brewer RD, Mokdad A, Denny C, Serdula MK, Marks JS (2003) Binge drinking among US adults. JAMA 289: 70-75.
Nicolas JM, Fernandez-Sola J, Fatjo F, Casamitjana R, Bataller R, Sacanella E, Tobias E, Badia E, Estruch R (2001) Increased circulating leptin levels in chronic alcoholism. Alcohol Clin Exp Res 25: 83-88.
Okoro CA, Brewer RD, Naimi TS, Moriarty DG, Giles WH, Mokdad AH (2004) Binge drinking and health-related quality of life: do popular perceptions match reality? Am J Prev Med 26: 230-233.
Prpic V, Watson PM, Frampton IC, Sabol MA, Jezek GE, Gettys TW (2003)
Differential mechanisms and development of leptin resistance in A/J versus C57BL/6J mice during diet-induced obesity. Endocrinology 144: 1155-1163. Rhodes JS, Best K, Belknap JK, Finn DA, Crabbe JC (2005) Evaluation of a simple
model of ethanol drinking to intoxication in C57BL/6J mice. Physiol Behav 84: 53-63.
Rhodes JS, Ford MM, Yu CH, Brown LL, Finn DA, Garland T, Jr., Crabbe JC (2007) Mouse inbred strain differences in ethanol drinking to intoxication. Genes Brain Behav 6: 1-18.
Schneider ER, Rada P, Darby RD, Leibowitz SF, Hoebel BG (2007) Orexigenic peptides and alcohol intake: differential effects of orexin, galanin, and ghrelin.
Spanagel R (2000) Recent animal models of alcoholism. Alcohol Res Health 24: 124-131.
Sparta DR, Sparrow AM, Lowery EG, Fee JR, Knapp DJ, Thiele TE (2008) Blockade of the Corticotropin Releasing Factor (CRF) Type 1 Receptor Attenuates Elevated Ethanol Drinking Associated with Drinking in the Dark Procedures.
Alcohol Clin Exp Res 32: 259-265.
Tabarin A, Diz-Chaves Y, Consoli D, Monsaingeon M, Bale TL, Culler MD, Datta R, Drago F, Vale WW, Koob GF, Zorrilla EP, Contarino A (2007) Role of the corticotropin-releasing factor receptor type 2 in the control of food intake in mice: a meal pattern analysis. Eur J Neurosci 26: 2303-2314.
Wang L, Saint-Pierre DH, Tache Y (2002) Peripheral ghrelin selectively increases Fos expression in neuropeptide Y - synthesizing neurons in mouse