Though the annual production of rural general surgeons in the United States remained consistent from 1981 to 2008 at approximately 1050 general surgeons per year, population growth led to a 25 percent decrease in the number of general surgeons per 100,000 people between 1981 and 2005 (Sheldon, 2009). The decline in general surgeons in rural areas has
been even more severe (Sheldon, 2009). In 2009, 828 hospital service areas had no general surgeons, and more than 4.5 million people had no access to a general surgeon where they lived (ACS, 2011). This means that millions of people in the United States are suffering from the
effects of a shrinking general surgical workforce.
General surgeons comprise an essential portion of the rural health workforce and often provide services that are both medically and financially necessary to support rural hospitals (D. C. Lynge, E. H. Larson, M. J. Thompson, R. A. Rosenblatt, & G. Hart, 2008). General surgeons perform a variety of medical procedures ranging from exploratory procedures to various
endoscopies and biopsies to assisting physicians with emergency procedures when complications arise (King et al., 2009). In rural areas, general surgeons often also perform necessary specialty procedures (Heneghan et al., 2005). A general surgeon is vital to ensure both the quality of and the financial viability of rural hospitals, especially critical access hospitals, which depend financially on their general surgery departments to remain open (Doty et al., 2008; Ricketts, 2005). One general surgeon with an inpatient practice can contribute as much as $1.54 to $2 million to the economic life of a community (Sheldon, 2009).
immediate and important benefits to policymakers and experts. Analyzing the relationship between a general surgeon’s characteristics and his or her choice to move will help predict future mobility of the workforce and provide helpful insight as to which general surgeons recruitment policies should target.
RESEARCH QUESTIONS
This study will analyze the characteristics of rural general surgeons who have moved primary practice locations between the years 2006 and 2011, and address the following research questions:
1. What are the overall trends in urban-rural migration among rural general surgeons in the United States?
REVIEW OF RELEVANT LITERATURE
What is “rural”?
One of the key challenges in addressing rural health workforce needs is how “rural” is defined. Studies often use different definitions and parameters for defining rural regions or counties. The two most common definitions of rurality are those developed by the U.S. Bureau of the Census and the U.S. Office of Management and Budget (OMB) (Ricketts, Johnson-Webb, & Randolph, 1999). The U.S. Census Bureau defines urban regions as “urbanized areas with 50,000 or more people and urban clusters with at least 2,500 but fewer than 50,000 people” and then defines rural as “encompassing all population, housing and territory not included within an urban area” (US Census Bureau, 2010).
Rural Health in the United States
Approximately 56 million people reside in rural regions of the United States (Population Reference Bureau, 2000), yet 65 percent of rural counties lack an adequate supply of health professionals (Association; Probst, Moore, Glover, & Samuels, 2004). Health professionals, including physicians and surgeons, tend to cluster in urban areas. The unequal distribution of physicians is the most cited example of rural-urban distribution problems among groups of health professionals (Larson et al., 2003). This is due, in part, to a trend toward physician specialization (Rosenblatt & Moscovice, 1982). Specialty practices often can only be supported in more densely populated areas (Dorsey, Jarjoura, & Rutecki, 2003; Rosenblatt, Cherkin, & Schneeweiss, 1982). Specialization and other pressures making work in metropolitan regions more desirable have led to the ratio of physicians to population in urban counties to be 136 percent higher than the ratio in rural areas (Larson et al., 2003).
After 1980, growth in U.S. physician training programs slowed and federal funding for surgical as well as most specialty trainingwas capped. These cutbacks in the “pipeline” to surgical practice are being felt as life expectancy increases and the population grows while the supply of surgeons remains the same (Gaul, Poley, Ricketts, Walker, & Groves, 2010). Policymakers and analysts have cited a broken “pipeline” as one of the key challenges in
General Surgery in the United States
General surgeons are a critical component of the United States’ health workforce. Approximately 29,095 general surgeons currently practice in the United States, and the annual input into the supply of general surgeons in the United States has remained constant since 1981 (Sheldon, 2009). In 1981, 1047 general surgeons were certified by the American Board of Surgery, while in 2008, 1032 surgeons became certified. Yet, the general surgeon-to-population ratio has decreased from 6.93 general surgeons per 100,000 in 1974 to 5 general surgeons per 100,000 in 2008 (Sheldon, 2009). The general surgeon to population ratio, however, varies among metropolitan and rural areas (Gaul et al., 2010; D. C. Lynge, E. H. Larson, M. J.
Thompson, R. A. Rosenblatt, & L. G. Hart, 2008; M. J. Thompson, D. C. Lynge, E. H. Larson, P. Tachawachira, & L. G. Hart, 2005). Large rural areas and urban areas have higher ratios of general surgeons per population than the standard recommendation for general surgeon supply – 6 general surgeons per 100,000 population. Specifically, Thompson and colleagues found that the ratio of general surgeons per 100,000 in large rural areas was 7.71, while the ratio in
small/isolated rural areas - towns with populations between 2,500 and 10,000 – was 4.67 (M. J. Thompson, D. C. Lynge, E. H. Larson, P. Tachawachira, & G. Hart, 2005).
A study by the American College of Surgeons’ Health Policy Research Institute shows that general surgeons are in short supply, especially in small communities, and that as many as 1300 are needed to close the gap between current supply and demand (Gaul et al., 2010). Places with more resources and better living conditions, which are often urban areas, have an easier time attracting and retaining surgeons. Areas with fewer resources and weaker local economies may find it more difficult to retain surgeons, much less attract new ones (Gaul et al., 2010). Thompson and colleagues observed that only 20.8 percent of general surgeons practice outside of nonmetropolitan areas (M.J. Thompson et al., 2005).
On the whole, the research shows a rapidly increasing geographic maldistribution of general surgeons with a stable shortage in the overall supply. In 2009, 1,765 counties had a general surgeon to population ratio lower than the Solucient’s 2004 recommended ratio - 6 general surgeons per 100,000 population. Of these, 1,138 counties had no surgeons at all (Gaul et al., 2010). Fewer graduating residents and general surgeons are choosing to practice in rural areas, which - coupled with an aging general surgery workforce - exacerbates maldistribution within the country (Goodman, 2004; "National Resident Matching Program Internet Website," 2006; J. J. Stevermer, Supattanasiri, & Williamson, 2001; M.J. Thompson et al., 2005).
Financial Contributions of General Surgeons to Healthcare Systems
services as “vital to the financial viability of hospitals.” Twelve percent stated that without its surgical program, their hospital would be forced to close (Doty et al., 2008). A quantitative analysis of the 2007 Merritt Hawkins report showed that a general surgeon was worth
approximately $1.95 million in annual net revenue to a hospital (Cofer & Burns, 2008). Doeksen estimated in 2008 that an average surgeon with an inpatient clinic in a small, rural community contributes between $1.54 and $2 million to the economic vitality of that community (Sheldon, 2009).
Both qualitative and quantitative data support that surgical services are a significant revenue source for hospitals. Data from the study of hospital administrators, while convincing, should be interpreted with caution owing to the low response rate to the survey (48%) and the potential bias toward the importance of surgical services by those who did respond. The quantitative data, especially those in the Merritt Hawkins report, are heavily skewed in favor of hospitals with fewer than 100 beds because 61 percent of survey respondents were chief financial officers of these smaller hospitals(Hawkins, 2013).
Characteristics of the General Surgery Workforce
Lynge et al., 2008). Furthermore, in small/isolated rural areas, more than 50 percent of the
general surgeons were over the age of fifty (M.J. Thompson et al., 2005).
The number of female general surgeons in the U.S. is increasing; in 1981, only 1.4 percent of the general surgery workforce was female compared to 13.4 percent of the workforce in 2005 (D.C. Lynge et al., 2008). In a survey of rural surgeons in Missouri in 2000, only two were women (J.J. Stevermer et al., 2001). This particular survey, however, with only 19 eligible respondents, is not a conclusive representation of women in the general surgery workforce. Not enough recent literature exists with regard to the female sector of the general surgery workforce, but if female surgeons do prefer urban practice locations, then rural areas will miss out on a promising, growing portion of the general surgery workforce.
Several other factors also affect a general surgeon’s choice to practice in a rural or urban location. Jarman and colleagues found that attending a non-urban high school or college, having a spouse who grew up in non-urban area, or having hobbies of hunting birds or large game were all significant factors in a surgeon’s choice to practice rurally. They also found that 79 percent of rural surgeons completed a rural clerkship during residency compared to only 37 percent of urban surgeons (Jarman et al., 2009). It is unknown whether these rural clerkships were effective in making residents choose a rural location or whether those in rural clerkships had previous preference for rural areas. On the other hand, certain factors may cause rural surgeons to consider leaving for more urban practices. Rural general surgeons more often report feelings of professional isolation (51.7%) and less frequently report adequate coverage for vacation time (48.9%) and acceptable call schedules (42.6%) (Heneghan et al., 2005).
or region. Most of the studies also received low response rates (< 50%) and reported significant potential for bias in their results. The study for Jarman et. al. is limited by the geographic diversity of its respondents, who were all from Wisconsin residency programs. While residents across the country may have similar patterns for practice location, the study possibly depicts results unique to that region. Similarly, the study by Heneghan and colleagues received a disproportionate number of surveys from rural general surgeons compared to urban ones. The chance for survey bias is also high owing to the mixed methods in conducting surveys (some via telephone and others via written mail). Though several limitations make it difficult to
characterize the general surgery workforce as a whole, the data can effectively show trends among large groups of general surgeons and help to model future workforce supply.
Movement of Physicians in the United States
The diffusion of physicians within the United States recently has been studied to help predict future supply of physicians in particular regions of the country. Between 1981 and 1991, 33 percent of physicians changed the county in which they practiced (Ricketts & Randolph, 2008). In the same study, 36 percent of physicians changed their practice county between 1991 and 2001. And, of the physicians that moved during these periods, more moved from a county with a higher physician-to-population ratio to a county with a lower ratio – seemingly moving to areas of lower competition (Ricketts & Randolph, 2008).
moving distance of 146 miles (Ricketts, 2013). Most physicians (72.7%) moved from urban areas to other urban areas and more moved from urban to rural areas (10.4%) than from rural to urban areas (9.4%) (Ricketts, 2013).
Why do physicians move?
Physicians have various reasons for leaving or moving to rural or urban locations (Ames et al., 2011; Goodman, 2004; Jarman et al., 2009; D.C. Lynge et al., 2008; Maiga, Poley, Kasper, Lesesne, & Ricketts, 2010). The factors that influence the migration of surgeons overlap
considerably with the factors that influence physicians generally and include income, quality of life, administrative hassles, work schedule and adequacy of support services (Maiga et al., 2010). Surgeons moving to rural areas tend to emphasize that their move produces improvements in income and fewer administrative hassles rather than any improvements in work schedule. Furthermore, surgeons moving to rural areas placed less emphasis on personal factors and more on professional and financial factors while those moving to urban areas placed less emphasis on financial factors and more on professional and personal factors (Maiga et al., 2010).
METHODS
To analyze the movement of rural general surgeons in the United States, I completed a descriptive statistical analysis using Excel. My initial analysis of the dataset is based heavily upon the analysis used in Ricketts’ 2013 study of physician migration (Ricketts, 2013).
I used a dataset compiled by Dr. Thomas Ricketts that combined individual level data from the AMA Physician Masterfile for beginning of years 2006 and 2011. The dataset
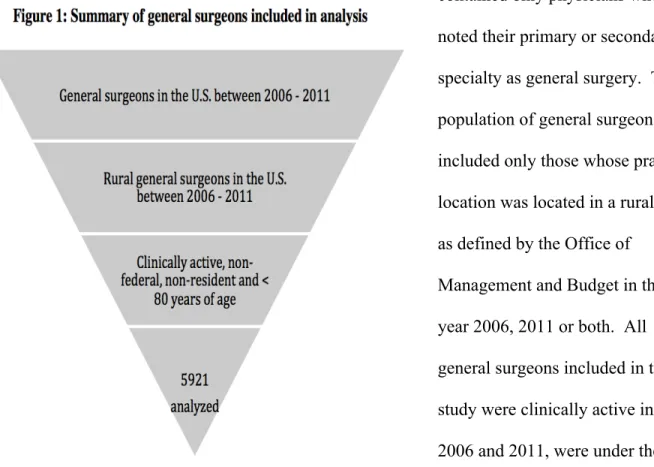
contained only physicians who noted their primary or secondary specialty as general surgery. This population of general surgeons included only those whose practice location was located in a rural area as defined by the Office of
My initial analysis classified general surgeons as either “movers” or “non-movers” and then analyzed the proportion of movers migrating from urban locations to rural locations and vice versa. A general surgeon was designated a “mover” if the modified FIPS code for his or her primary practice location changed between 2006 and 2011. Similarly, a “non-mover” had the same modified FIPS code during both years. The definition of rural as given by the Office of Management and Budget was used to classify the metropolitan status of general surgeons’ practice locations in 2006 and 2011. For the purpose of my analysis, all metropolitan locations
were coded as “1.” Cases that had a “1” identifier in 2006 but not in 2011 were classified as movers from an urban location to a rural location. Those that lacked the “1” identifier in 2006 but had it in year 2011 were classified as movers from a rural location to an urban one. My classification of movement resulted in three main types of movement: rural-to-rural, rural-to-urban, and urban-to-rural. Figure 2 shows the types of movement that will be analyzed.
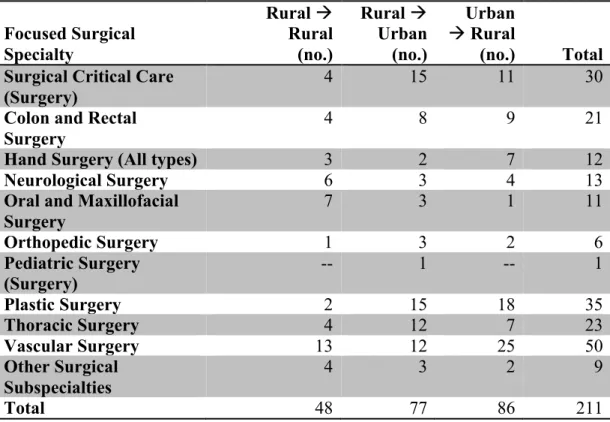
I then examined the relationship between surgical sub-specialization and movement. I defined surgical sub-specialization as a general surgeon who changes their primary specialty from general surgery (GS) in 2006 to a more specific area of surgery - such as neurosurgery or plastic surgery – in 2011. I filtered the dataset to only include those who identified their primary specialty as GS in 2006 and then as a more focused surgical specialty in 2011. This resulted in a dataset of 211 general surgeons. I created an Excel pivot table displaying the sub-specialization in relation to the three types of movement to discover the number of general surgeons who move into or out of a rural area when sub-specializing in surgery.
After this initial analysis of the data, I conducted a multivariate analysis in the form of a logistic regression to determine the relationship between a rural general surgeon’s specific characteristics and their likelihood to relocate to another county. The logistic regression
included variables for gender, age, surgical sub-specialization and specialty change. The gender, surgical sub-specialization and specialty change variables were manipulated to be binary 0-1 variables. The results of the multivariable logistic regression were compared to raw singular correlations conducted in Excel to determine consistency and reliability of the results.
Limitations
RESULTS
Description of Sample
The analysis dataset included 5,921 general surgeons, excluding residents, general surgeons over the age of 80 and surgeons not clinically active in either 2006 or 2011. All identified their primary or secondary specialty as general surgery and reported living in a non-metropolitan area in 2006, 2011 or both years.
Number of Movers
Of the 5,921 rural general surgeons analyzed, 2,550 (43.1%) moved from one county to another within the five-year period. Among the 2,550 movers, 1,553 (26.2%) moved from one state to another between 2006 and 2011. Interstate moves accounted for more than half of all moves. Interstate movement resulted in a net loss in the number of general surgeons from both the Midwest and Northeast regions, while the West and South both gained general surgeons. Figure 1 illustrates the net flows of rural general surgeons between states over the five-year
period.
Figure 1: Net flows of rural general surgeons between U.S. states, 2006 -‐ 2011
= +19 to +28 = +10 to +18 = +1 to +9 = -‐10 to 0 = -‐11 to -‐24
States in green experienced a net inflow of general surgeons, and those in yellow or red experienced a net outflow.
More general surgeons moved from an urban area to a rural one during the five-year period than from a rural area to an urban one. About half of all rural general surgeons who relocated moved into a rural area. 1,226 (20.7%) general surgeons made an urban-to-rural move between 2006 and 2011 while 757 (12.8%) moved in the opposite rural-to-urban direction. Figure 2 details the movement of rural general surgeons between metropolitan and
non-metropolitan areas.
Rural General Surgeon Characteristics
The average age of all rural general surgeons from 2006 to 2011 was 52.5 years. The average age of those who relocated during this time period was slightly lower at 48.2 years. Furthermore, a greater percentage of movers were female (15.5%) than in the overall population of general surgeons. Table 1 below provides the population characteristics of the dataset.
Rural
4695 general surgeons
Urban
757 general surgeons
Urban
1226 general surgeons
Rural
5164 general surgeons
2006 2011
Table 1: Characteristics of Rural General Surgeons, 2006 - 2011
Total Number Moved
Percent Moved Total in file, 2006 – 2011
Average age Percent female
Average distance moved
5,921 52.5 yr. 10.8% -- 2,550 48.2 yr. 15.5% 559.9 mi. 43.1% -- -- --
Surgical Specialization and Relocation
5,135 general surgeons cited their primary specialty as general surgery (GS) in 2006. In 2011, 211 of these general surgeons indicated a subspecialty in a more focused area of surgery, such as pediatric surgery or neurosurgery. Table 2 details the types of surgical specialization within the three types of relocation.
Table 2: Type of surgical sub-specialization among general surgeons, 2006-2011 *
Focused Surgical Specialty
Rural !
Rural (no.)
Rural !
Urban (no.)
Urban
!Rural
(no.) Total Surgical Critical Care
(Surgery)
4 15 11 30
Colon and Rectal Surgery
4 8 9 21
Hand Surgery (All types) 3 2 7 12 Neurological Surgery 6 3 4 13 Oral and Maxillofacial
Surgery
7 3 1 11
Orthopedic Surgery 1 3 2 6 Pediatric Surgery
(Surgery) -- 1 -- 1
Plastic Surgery 2 15 18 35 Thoracic Surgery 4 12 7 23 Vascular Surgery 13 12 25 50 Other Surgical
Subspecialties
4 3 2 9
Total 48 77 86 211
There were also other general surgeons who switched to other non-surgical specialties or switched to general surgery from a different specialty. Among the general surgeons who did indicate a surgical subspecialty in 2011, 48 stayed in a rural area, 86 moved in the urban-to-rural direction and 77 moved in the rural-to-urban direction.
Predictors of Relocation
The analysis, Table 3, of moving general surgeons and their characteristics shows that both gender and age are strong predictors of movement (both odds ratios are greater than 1 and do not include 1 in the confidence interval). Female rural general surgeons are approximately 1.5 times as likely as their male counterparts to relocate to another county. Those who sub-specialized in a more focused area of surgery were 1.2 times more likely to move to a different county. Lastly, rural general surgeons who switched their indicated primary specialty between 2006 and 2011 were nearly 3 times more likely to move than their counterparts who remained in general surgery practices.
Table 3: Regression analysis of rural general surgeons who moved and their characteristics, 2006 – 2011
Odds
Ratio Err. Std. Z P > z
95% Confidence Interval Female Age Specialty Change 1.523 0.949 2.711 0.139 0.002 0.269 4.59 -20.28 10.07 0.000 0.000 0.000 1.272 0.944 2.232 1.822 0.954 3.292
Number of observations 5,921. X2 = 762.97.
Prob > X2 = 0.0000.
DISCUSSION
Number of Movers
Rural general surgeons, like other surgeons and physicians, mirror the trends of
movement in the overall U.S. population. Rural general surgeons are slightly more mobile than the overall general surgical workforce. A higher percentage (43.1%) of rural general surgeons relocate their primary practice location than the total general surgical workforce (35.3%) (Ricketts, 2010). The earlier work of Ricketts (2010) on the net movement of established
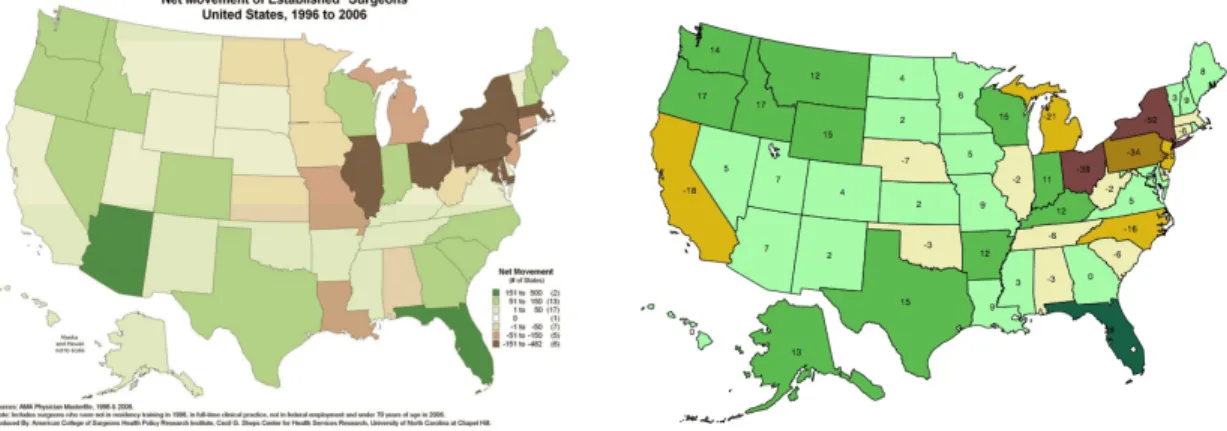
surgeons closely resembles the net movement of rural general surgeons between 2006 and 2011. Both populations moved away from the Northeast and Midwest and into the West and South. Figure 4 compares the net movement of rural general surgeons from 2006 to 2011 to the net movement of all established surgeons between 1996 and 2006.
Net Movement of Established Surgeons, Net Movement of Rural General Surgeons, 1996 to 2006 (Ricketts) 2006 to 2011
to an urban one. The data also support an emerging trend of urban general surgeons relocating to rural areas, which may depict successful diffusion of general surgeons to areas with less
competition. On the other hand, general surgeons may be disproportionately relocating to rural areas with already concentrated medical services. An important limitation of this study is that the data do not incorporate the size, physician-to-population ratio, or income level for the relocation counties. Previous works show that these specific characteristics influence a
surgeon’s choice of where to relocate (Ricketts, 2010). Because county characteristics were not analyzed, this study cannot conclude that the urban-to-rural or rural-to-rural movement is significantly influenced by the characteristics of the relocation county. However, the strong tendency for rural relocation among general surgeons in the dataset may support a future trend of increased general surgeon migration to these desirable rural areas – likely on the outskirts of major cities or in newly created suburbs – for their new primary practice location.
Rural General Surgeon Characteristics
This study confirms previous qualitative and quantitative data about the characteristics of rural general surgeons. A large percentage of the dataset was male (89.2%) and many were over the age of fifty, with an average age of 52.5 years. The aging population of rural general
surgeons is of particular concern to subject matter experts and policymakers. The rural general surgical workforce is rapidly nearing retirement, making it critical to develop effective
Predictably, the average age among movers is slightly younger (48.2 years) than the average age among the rural general surgical workforce. Younger general surgeons are also slightly more likely to move than their older counterparts, making them a prime target population for rural recruitment. Currently, the Affordable Care Act (ACA) provides new payment
incentives for general surgeons who practice in health professional shortage areas (HPSAs). Policymakers and experts are currently engaging in dialogue about developing a new index of surgical underservice to improve policies so that they encompass not just areas underserved in primary care but also areas that are surgically underserved. The data from this study reveal overall trends in practice relocation and rural general surgeons’ characteristics that may guide policymakers and experts on the creation of this index of surgical underservice.
In 2005, 13.4 percent of the general surgical workforce was female (D.C. Lynge et al., 2008). This study shows that the current percentage of females in the rural general surgical workforce is slightly lower at 10.8 percent. The data also confirm a previously identified trend of higher mobility among female surgeons(Ricketts, 2010). Female rural general surgeons were slightly more likely to move primary practice locations than their male counterparts between 2006 and 2011. A greater percentage of movers are female (15.5%), and a slight negative correlation exists between gender and relocation. While studies exist on the specific migration practices of female physicians, this study further identifies female general surgeons as a population of interest for recruitment policy.
Surgical Specialization and Relocation
recruit or retain surgical specialists. However, it is important to note that a significant portion of those in the dataset who sub-specialized moved out of rural areas into urban ones. For this reason, the study cannot definitively conclude that rural areas are effectively recruiting and supporting surgical specialists. Further research should be conducted to analyze the
characteristics of urban general surgeons who sub-specialize and relocate to determine if recruitment strategies in rural service areas can be tailored to a segment of the current urban surgical workforce.
Predictors of Relocation
Previous literature has cited several factors that cause physicians and surgeons to relocate their primary practice – both professional and personal. However, there is less available
literature about what characteristics may be predictors of movement among general surgeons. This study identifies both gender and specialty change as significant predictors of movement among the rural general surgical workforce. Females are 1.5 times more likely to move than their male counterparts, and females comprise a larger percentage of the mobile population than of the overall population of rural general surgeons.
Specialty change is the strongest indicator of relocation. Specialty change is defined in this study as those in the dataset who indicated a different primary specialty in 2011 than they did in 2006. Specialty changes include those who sub-specialized in surgery as well as those who switched into a different type of medical specialty. Those who changed primary specialty between 2006 and 2011 were 2.7 times more likely to relocate than their counterparts.
specialty altogether may have to move away for a 5-year period or longer to obtain training, and once trained, there may be few to no job openings for certain specialists in rural areas. For these reasons, it would be useful to analyze the locations to which those who change specialty are moving or whether they move back to their original practice location after completing their training. Owing to the condensed 5-year timeframe of this study, the data do not support clear conclusions about whether rural general surgeons who change medical specialty may later return to a rural area to practice.
Implications for Policy and Research
The data from this study build upon the existing literature about migration among the surgical workforce. The high mobility of the rural general surgical workforce should spark new discussion among retention policy experts to determine best practices for keeping general surgeons within a specific service area. Further research is needed to determine whether rural general surgeons are moving to underserved rural areas or to rural areas with an already high physician-to-population density. Determining specific patterns of relocation among general surgeons will be crucial to developing an index of surgical underservice and to creating effective incentives to attract general surgeons to more isolated rural areas.
A secondary trend that emerged from the data was the breadth of rural general surgeons who switched specialties during the five-year period. General surgeons are critical to the success and quality of hospital systems, and it is important to research why so many rural general
professionals from the field of general surgery before addressing their geographic maldistribution.
WORKS CITED
ACS, A. C. o. S. (2011).
Ames, A., Evans, M., Fox, L., Milam, A., Petteway, R., & Rutledge, R. (2011). 2011 Neighborhood Health Profile: Greenmount East. In B. C. H. Department (Ed.). Anderson, R. L., & Anderson, M. A. (2012). Rural General Surgery: A Review of the Current
Situation and Realities from a Rural Community Practice in Central Nebraska. The Online Journal of Rural Research and Policy, 7(2), 1-‐19.
Association, N. R. H. What's Different About Rural Health Care? , from
http://www.ruralhealthweb.org/go/left/approximately -‐rural-‐health/what-‐s-‐ different-‐approximately -‐rural-‐health-‐care/what-‐s-‐different-‐approximately -‐rural-‐ health-‐care
BHPR, B. o. H. P. (2008).
Cofer, J. B., & Burns, R. P. (2008). The developing crisis in the national general surgery workforce. J Am Coll Surg, 206(5), 790-‐795; discussion 795-‐797. doi:
10.1016/j.jamcollsurg.2007.12.017
Dill, M. J., & Salsberg, E. S. (2008). The complexities of physician supply and demand: projections through 2025: Association of American Medical Colleges.
Dorsey, E. R., Jarjoura, D., & Rutecki, G. W. (2003). Influence of controllable lifestyle on recent trends in specialty choice by US medical students. Journal of American Medical Association, 290, 1173-‐1178.
Doty, B., Zuckerman, R., Finlayson, S., Jenkins, P., Rieb, N., & Heneghan, S. (2008). General surgery at rural hospitals: a national survey of rural hospital administrators. Surgery, 143(5), 599-‐606. doi: 10.1016/j.surg.2007.11.022
Gaul, K., Poley, S. T., Ricketts, T. C., Walker, E., & Groves, J. (2010). Mapping the Supply of Surgeons in the United States, 2009. Chapel Hill, NC: American College of Surgeons
Health Policy Research Institute.
Goodman, D. C. (2004). Twenty-‐year trends in regional variations in the U.S. physician workforce. Health Aff (Millwood), Suppl Variation, VAR90-‐97. doi:
10.1377/hlthaff.var.90
Hawkins, M. (2013). 2013 Merritt Hawkins Report.
Heneghan, S. J., Bordley, J., Dietz, P. A., Gold, M. S., Jenkins, P. L., & Zuckerman, R. J. (2005). Comparison of urban and rural general surgeons: motivations for practice location, practice patterns, and education requirements. J Am Coll Surg, 201(5), 732-‐736. doi: 10.1016/j.jamcollsurg.2005.06.262
Jarman, B. T., Cogbill, T. H., Mathiason, M. A., O'Heron, C. T., Foley, E. F., Martin, R. F., . . . Webb, T. P. (2009). Factors correlated with surgery resident choice to practice general surgery in a rural area. J Surg Educ, 66(6), 319-‐324. doi:
10.1016/j.jsurg.2009.06.003
Larson, E. H., Johnson, K. E., Norris, T. E., Lishner, D. M., Rosenblatt, R. A., & Hart, L. G. (2003). State of the Health Workforce in Rural America: Profiles and Comparisons. Seattle, WA: WWAMI Rural Health Research Center.
Lynge, D. C., Larson, E. H., Thompson, M. J., Rosenblatt, R. A., & Hart, G. (2008). A
Longitudinal Analysis of the General Surgery Workforce in the United States, 1981-‐ 2005. Archives of Surgery, 143(4), 345-‐350.
Lynge, D. C., Larson, E. H., Thompson, M. J., Rosenblatt, R. A., & Hart, L. G. (2008). A longitudinal analysis of the general surgery workforce in the United States, 1981-‐ 2005. Arch Surg, 143(4), 345-‐350; discussion 351. doi: 10.1001/archsurg.143.4.345 Maiga, A. W., Poley, S. T., Kasper, E. W., Lesesne, S., & Ricketts, T. C. (2010). Characteristics
and Motivations of Surgeons Moving to and from Rural Communities. American
College of Surgeons Health Policy Research Institute, Cecil G. Sheps Center for Health Services Research, Chapel Hill, NC.
National Resident Matching Program Internet Website. (2006). from http://www.nrmp.org/res_match/tables/ table5_06.pdf.
Probst, J. C., Moore, C. G., Glover, S. H., & Samuels, M. E. (2004). Person and place: The compounding effects of race/ethnicity and rurality on health. American Journal Of Public Health, 94(10), 1695-‐1703.
Ricketts, T. C. (2005). Workforce issues in rural areas: a focus on policy equity. American Journal Of Public Health, 95(1), 42-‐48. doi: 10.2105/AJPH.2004.047597
Ricketts, T. C. (2013). The migration of physicians and the local supply of practitioners: a five-‐year comparison. Academic medicine: Journal of the Association of American Medical Colleges, 88(12), 1913-‐1918. doi: 10.1097/ACM.0000000000000012
Ricketts, T. C., & Johnson-‐Webb, K. D. (1997). What is "rural" and how to measure "rurality": a focus on health care delivery and health policy. (H. R. a. P. A. Center, Trans.): Cecil G. Sheps Center for Health Services Research.
Ricketts, T. C., Johnson-‐Webb, K. D., & Randolph, R. K. (1999). Populations and Places in Rural America. In T. C. Ricketts (Ed.), Rural Health in the United States. New York: Oxford University Press.
Ricketts, T. C., & Randolph, R. (2008). The Diffusion of Physicians. Health Aff (Millwood), 27(5), 1409-‐1415. doi: 10.1377/hlthaff.27.5.1409
Rosenblatt, R. A., Cherkin, D. C., & Schneeweiss, R. (1982). The structure and content of family practice: current status and future trends. Journal of Family Practice, 15, 681-‐ 722.
Rosenblatt, R. A., & Moscovice, I. S. (1982). Rural Health Care. New York, NY: John Wiley & Sons, Inc.
Sheldon, G. F. (2009). In R. F. Martin, R. Zuckerman & D. Borgstrom (Eds.), Surgical Practice in Rural Areas (Vol. 89, pp. XVII-‐XIX). Philadelphia, PA: Elsevier, Inc.
Stevermer, J. J., Supattanasiri, G. J., & Williamson, H., Jr. (2001). A survey of general
Stevermer, J. J., Supattanasiri, G. J., & Williamson Jr, H. A. (2001). A Survey of General
Surgeons in Rural Missouri: Potential for Rapid Decrease in Work Force. The Journal of rural health, 17(1), 59-‐62.
Thompson, M. J., Lynge, D. C., Larson, E. H., Tachawachira, P., & Hart, G. (2005).
Characterizing the General Surgery Workforce in Rural America. Archives of Surgery, 140(Jan. 2005), 74-‐79.
Thompson, M. J., Lynge, D. C., Larson, E. H., Tachawachira, P., & Hart, L. G. (2005).
Characterizing the general surgery workforce in rural America. Arch Surg, 140(1), 74-‐79. doi: 10.1001/archsurg.140.1.74
U.S., B. o. t. C. (1990). Census of Population and Housing, 1990.
Williamson Jr, H. A., Williamson Jr, H. A., Hart, L. G., Pirani, M. J., & Rosenblatt, R. A. (1994). Rural hospital inpatient surgical volume: Cutting-‐edge service or operating on the margin? The Journal of rural health, 10(1), 16-‐25.