LETTER • OPEN ACCESS
Co-benefits of global, domestic, and sectoral
greenhouse gas mitigation for US air quality and
human health in 2050
To cite this article: Yuqiang Zhang et al 2017 Environ. Res. Lett. 12 114033
View the article online for updates and enhancements.
Related content
Ancillary health effects of climate mitigation scenarios as drivers of policy uptake: a review of air quality, transportation and diet co-benefits modeling studies
Kelly M Chang, Jeremy J Hess, John M Balbus et al.
-Climate change, air pollution and human health in Sydney, Australia: A review of the literature
Annika Dean and Donna Green
-Climate and health implications of future aerosol emission scenarios
Antti-Ilari Partanen, Jean-Sébastien Landry and H Damon Matthews
-Recent citations
Comprehensively assessing the drivers of future air quality in California
Shupeng Zhu et al
-Effect of Health-related Uncertainty and Natural Variability on Health Impacts and Co-Benefits of Climate Policy
Rebecca Karina Saari et al
-Sensitivity of projected PM2.5- and O3-related health impacts to model inputs: A case study in mainland China
Min Zhong et al
LETTER
Co-benefits of global, domestic, and sectoral greenhouse
gas mitigation for US air quality and human health in
2050
Yuqiang Zhang1,2 , Steven J Smith3, Jared H Bowden4,5, Zachariah Adelman1,4and J Jason West1,6 1 Environmental Sciences and Engineering Department, University of North Carolina at Chapel Hill, Chapel Hill, NC 27599, United
States of America
2 Environmental Protection Agency, Research Triangle Park, NC 27709, United States of America
3 Joint Global Change Research Institute, Pacific Northwest National Laboratory, College Park, MD 20740, United States of America 4 Institute for the Environment, University of North Carolina at Chapel Hill, Chapel Hill, NC 27599, United States of America 5 Department of Applied Ecology, North Carolina State University, Raleigh, NC 27607, United States of America
6 Author to whom any correspondence should be addressed.
OPEN ACCESS
RECEIVED
11 May 2017
REVISED
18 September 2017
ACCEPTED FOR PUBLICATION
27 September 2017
PUBLISHED
14 November 2017
Original content from this work may be used under the terms of the
Creative Commons Attribution 3.0 licence. Any further distribution of this work must maintain attribution to the author(s) and the title of the work, journal citation and DOI.
E-mail:[email protected]
Keywords:climate change, air quality, premature mortality, particulate matter, ozone, greenhouse gas, co-benefits Supplementary material for this article is availableonline
Abstract
Reductions in greenhouse gas (GHG) emissions can bring ancillary benefits of improved air quality
and reduced premature mortality, in addition to slowing climate change. Here we study the
co-benefits of global and domestic GHG mitigation on US air quality and human health in 2050 at
fine resolution using dynamical downscaling of meteorology and air quality from global simulations
to the continental US, and quantify for the first time the co-benefits from foreign GHG mitigation.
Relative to the reference scenario from which Representative Concentration Pathway 4.5 (RCP4.5)
was created, global GHG reductions in RCP4.5 avoid 16 000 PM
2.5-related all-cause deaths yr
−1(90%
confidence interval, 11 700–20 300), and 8000 (3600–12 400) O
3-related respiratory deaths yr
−1in the
US in 2050. Foreign GHG mitigation avoids 15% and 62% of PM
2.5-and O
3-related total avoided
deaths, highlighting the importance of foreign mitigation for US health. GHG mitigation in the US
residential sector brings the largest co-benefits for PM
2.5-related deaths (21% of total domestic
co-benefits), and industry for O
3(17%). Monetized benefits for avoided deaths from ozone and
PM
2.5are
$
137 (
$
87–
$
187) per ton CO
2at high valuation and
$
45 (
$
29–62) at low valuation, of
which 31% are from foreign GHG reductions. These benefits likely exceed the marginal cost of GHG
reductions in 2050. The US gains significantly greater air quality and health co-benefits when its GHG
emission reductions are concurrent with reductions in other nations. Similarly, previous studies
estimating co-benefits locally or regionally may greatly underestimate the full co-benefits of
coordinated global actions.
1. Introduction
Exposure to fine particulate matter (PM2.5) and ozone (O3) is associated with both morbidity (e.g. hospital-izations, emergency department visits, school absences, and asthma-related health effects) and premature human mortality (e.g. deaths from cardiovascular and respiratory disease and lung cancer), as revealed in epidemiological studies (US EPA 2009, 2013). Sev-eral cohort studies have shown evidence for chronic
effects of PM2.5on mortality (Ladenet al2006, Krewski
et al 2009, Lepeule et al 2012), whereas fewer have demonstrated the chronic effects of O3on mortality (Jerrettet al2009).
Previous research has quantified future air qual-ity changes and their effects on human health under projected emission scenarios, at both the global (West
quality through several mechanisms, including photo-chemical reactions, natural emissions, deposition rates, and air stagnation events (Weaveret al2009, Jacob and Winner2009, Fioreet al2012,2015). Related studies have quantified the effect of global and regional climate change on air quality and human health (Bellet al2007, Tagariset al2009, Postet al2012, Fanget al2013, Fann
et al2015). Postet al(2012) used an ensemble of atmo-spheric models to study the effect of climate change in 2050 on air quality and human health in the US, and found significant variability when using different models.
Many studies have also investigated the co-benefits of greenhouse gas (GHG) mitigation for air quality and avoided premature mortality, as actions to reduce GHG emissions also tend to reduce co-emitted air pol-lutants (Bellet al2008, Cifuenteset al2001, Nemetet al 2010). When monetized, the health co-benefits of GHG mitigation were found to range across the literature from$2–$196/tCO2(Nemetet al2010), comparable to the costs of GHG reductions. Other recent stud-ies have also analyzed the effects of GHG mitigation on future air quality and human health co-benefits in the US (Driscoll et al 2015, Markandya et al 2009, Thompsonet al2014, Trailet al2015, Plachinskiet al 2014). Thompsonet al(2014) studied the co-benefits of different climate policies in the US on domestic air quality in 2030, finding that human health bene-fits due to improved air quality can offset 26%–1050% of the cost of carbon polices. Other studies also investi-gate the co-benefits of climate policy on food security, energy savings, and other health co-benefits of active transportation (walking, biking) and changes in diet (Cappset al2016, Chuwahet al2015, Frielet al2009, Jakob2006, McCollumet al2013, Wilkinsonet al2009, Woodcocket al2009), but they are not the focus of our study.
Previous co-benefits studies have been limited by only considering the co-benefits of regional or local climate policies on regional air quality and human health, neglecting (i) the co-benefits of those actions for other nations or regions, and (ii) the co-benefits gained domestically from global actions where one country’s actions are coordinated with reductions internation-ally. Both PM2.5 and O3 have long enough lifetimes in the atmosphere to transport intercontinentally, sug-gesting that emissions from one source region can affect air quality and human health on multiple receptor regions (Anenberg et al2009,2014, Liuet al2009). For O3, the health benefits of O3precursor reductions may even be greater outside of the source region than within due to the greater population over several recep-tor regions (Duncanet al2008, Anenberget al2009, Westet al2009). PM2.5has a much shorter lifetime than O3, but the mortality impacts of intercontinental transport of PM2.5are comparable to that of ozone due to the stronger effects of PM2.5on mortality (Anenberg
et al2014). To address these limitations, West et al
(2013), (referred to as WEST2013 hereafter) were the
first to use a global chemical transport model (CTM) to address the co-benefits of global GHG mitigation on air quality and human health. WEST2013 were also the first to estimate co-benefits via two mechanisms: reduced co-emitted air pollutants, and slowing climate change and its effects on air quality. They found that global GHG mitigation could avoid 2.2±0.8 million premature deaths in 2100 due to the improved air quality, accounting for both PM2.5and O3mortality. The co-benefits from the first mechanism of reduced co-emitted air pollutants are much greater than those from the second mechanism of slowing climate change and its effect on air quality. The monetized co-benefits for health were estimated at$50–$380/tCO2, globally averaged, higher than previous estimates (Nemetet al2010).
WEST2013 applied a global CTM (horizontally 2◦×2.5◦) to study the co-benefits. We increased the horizontal resolution using a limited area model frame-work to further investigate the co-benefits for US air quality in 2050 at much finer resolution (Zhanget al 2016). Here we use the simulations performed by Zhang
et al(2016) and focus on quantifying the co-benefits of global GHG reductions for avoided air pollution-related mortality in the continental US in 2050. We study the total co-benefits through the two mecha-nisms, following WEST2013 and Zhanget al(2016), and separate the co-benefits of GHG mitigation in the US versus the contributions from foreign countries. By embedding this study within the previous global study of WEST2013, we are the first to investigate the co-benefits of foreign GHG mitigation for US air quality and human health. Previous studies have also investigated the effects of air pollution from specific emission sectors on premature mortality, both globally (Lelieveldet al2015, Moritaet al2014, Yimet al2015, Silvaet al2016b) and regionally (Caiazzoet al2013, Fannet al2012,2013). Here we conduct three new sen-sitivity simulations to quantify the air quality and health co-benefits of GHG reductions in three US emission sectors: industry, residential and energy.
2. Methods
2.1. Air quality changes in the US in 2050 at fine scale Air quality changes in the US under different GHG scenarios centered on 2050 were downscaled from WEST2013 by Zhang et al (2016). Meteorological fields from the NOAA Geophysical Fluid Dynamics Laboratory (GFDL) atmospheric model AM3 (Donner
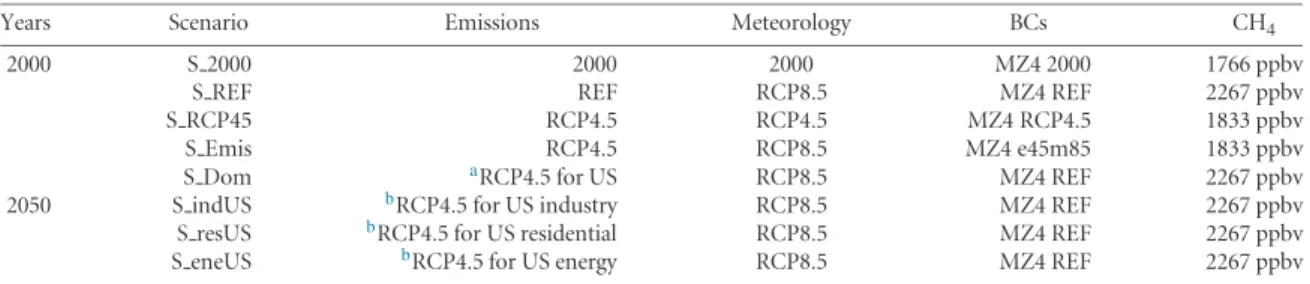
Table 1.Simulations used for health impact assessment in this study, conducted by Zhanget al(2016), and the three additional sector simulations for this study. Boundary conditions are from the MOZART-4 (MZ4) simulations of WEST2013. Global methane (CH4) background concentrations are fixed in CMAQ, consistent with the RCPs and WEST2013. All the simulations are run for three consecutive years, with four months spin-up.
Years Scenario Emissions Meteorology BCs CH4
2000 S 2000 2000 2000 MZ4 2000 1766 ppbv
S REF REF RCP8.5 MZ4 REF 2267 ppbv
S RCP45 RCP4.5 RCP4.5 MZ4 RCP4.5 1833 ppbv
S Emis RCP4.5 RCP8.5 MZ4 e45m85 1833 ppbv
S Dom aRCP4.5 for US RCP8.5 MZ4 REF 2267 ppbv
2050 S indUS bRCP4.5 for US industry RCP8.5 MZ4 REF 2267 ppbv
S resUS bRCP4.5 for US residential RCP8.5 MZ4 REF 2267 ppbv
S eneUS bRCP4.5 for US energy RCP8.5 MZ4 REF 2267 ppbv
aApply emissions from RCP4.5 in US and from REF in the parts of Canada and Mexico within the domain.
bOnly one sector of emissions from RCP4.5 (e.g. industry, residential and energy) are used, and emissions in other sectors over the US are
from REF, as are emissions over Canada and Mexico in the domain.
information on the WRF configuration can be found in Zhanget al(2016). GFDL-AM3 was downscaled using WRF for two periods, a historical period (2000–2003; here considered 2000), and a future period (2049– 2052; here considered 2050) for the Representative Concentration Pathway 4.5 (RCP4.5) and RCP8.5 sce-narios with one year of spin-up. Global anthropogenic emissions from RCP4.5 and its reference scenario (REF) were directly processed to the regional scale using the Sparse Matrix Operator Kernel Emissions (SMOKE, v3.5, Houyouxet al2000) program. Dynam-ical chemDynam-ical boundary conditions were acquired from the global CTM outputs of WEST2013. The Com-munity Multiscale Air Quality model (CMAQ, v5.0.1, Byun and Schere2006), with the CB05 chemical mech-anism with updated toluene reactions and the latest aerosol module (AE6), was used to simulate air pollu-tant concentrations (i.e. PM2.5and O3) in 2000 and 2050. Most of the CMAQ simulations used in this study (table1) were completed by Zhanget al(2016), but three new sensitivity simulations are performed here to quantify the co-benefits of GHG mitigation from domestic emission sectors in the US. The CMAQ simulations from Zhanget al(2016) and the three addi-tional sensitivity simulations are run for 40 consecutive months, with the first four months as spin-up, and the results are presented as three-year averages.
The total co-benefits from global GHG mitiga-tion are obtained by comparing scenarios S RCP45 and S REF (table1). As discussed by WEST2013 and Zhanget al(2016), RCP4.5 was developed based upon REF, which is a self-consistent representation of future energy and land use development, with regionally spe-cific air pollutants emissions, developed consistently with the assumed future development to 2100 but without considering climate policy (Smithet al2011). Relative to REF, RCP4.5 is created by applying a global carbon policy spanning all world regions and emis-sion sectors (Thomsonet al2011); the only difference between these two scenarios is therefore the carbon pol-icy. These self-consistent scenarios therefore uniquely isolate the effects of GHG mitigation (RCP8.5 is used as a proxy for REF meteorology, since no climate model simulated REF). The total co-benefits from global
GHG mitigation are obtained by comparing scenarios S RCP45 and S REF (table1). As discussed by Zhang
et al(2016), the sensitivity run S Emis applies emissions from RCP4.5 and meteorology from RCP8.5. To sep-arate the total co-benefits from the two mechanisms, we use S Emis minus S REF to give the co-benefits from co-emitted air pollutant reductions, and S RCP45 minus S Emis for the co-benefits from slowing climate change. The sensitivity simulation S Dom applies GHG mitigation from the RCP4.5 scenario in the US only, so the co-benefits of domestic GHG mitigation are esti-mated as S Dom minus S REF, and foreign co-benefits as S RCP45 minus S Dom.
In addition, we simulate three more scenarios to identify the co-benefits from actions to reduce GHG emissions in individual sectors domestically. We choose to simulate reductions in the industry (S indUS, manufacturing industries, industrial process emissions other than solvents, construction, mining, and agricul-tural machinery), residential and commercial buildings (S resUS, primarly from cooking, heating and hot water), and energy sectors (S eneUS, from electric power generation and energy extraction and transfor-mation), because air pollutant emission reductions in RCP4.5 in 2050 are greatest from these sectors in the US. Although ground transportation is the largest con-tributor for most air pollutants in the US in 2000 and 2050, we did not select transportation as little air pol-lutants reductions are seen from this sector in 2050. The air pollutant emission reductions from the three sectors selected here account for more than 98% of the total SO2and NOxreductions in RCP4.5 relative to REF in the US in 2050, 80% of the CO reductions, and more than 50% of the EC and OC reductions. However, these three sectors only account for 11% of the total non-methane volatile organic compound (NMVOC) decreases (supplementary table S1 available atstacks.iop.org/ERL/12/114033/mmedia).
2.2. Human health analysis
(a) (b)
45°N
40°N
35°N
30°N
25°N
45°N
40°N
35°N
30°N
25°N
110°W 100°W 90°W 80°W 110°W 100°W 90°W 80°W
-2 -1.6 -1.2 -0.8 -0.4 0 0.4 0.8 1.2 1.6 2 µg m -10 -8 -6 -4 -2 0 2 4 6 8 10 ppb
-3
Figure 1.Total air quality co-benefits (S RCP45-S REF) in 2050 for (a) annual average PM2.5, and (b) 6 month ozone-season average of 1 hr daily maximum of O3. Results are presented as three-year averages. Negative values (blue) indicate air quality improvements.
changes for both PM2.5and O3. BenMAP-CE calcu-lates the relationship between air pollution and certain health effects, using a health impact function (HIF) from epidemiological studies. The HIFs for PM2.5and O3used in this study are based on a log-linear rela-tionship between relative risk (RR) and air pollutant concentrations defined by epidemiology studies (Jer-rettet al2009, Krewskiet al2009), which are also used by WEST2013. RR is used to calculate attributable frac-tion (AF), the fracfrac-tion of the disease burden attributable to the risk factor, which is defined as:
AF = RR − 1RR = 1 − exp−𝛽Δ𝑥 (1)
where𝛽is the concentration–response factor (CRF; i.e. the estimated slope of the log-linear relation between concentration and mortality) andΔxis the change in air pollutant concentration between two scenarios. AF is multiplied by the baseline mortality rate (y0), and the exposed population (Pop) to yield an estimate of excess deaths attributable to changes in air pollution (ΔMort):
ΔMort =𝑦0× (1 − exp−𝛽Δ𝑥) × Pop. (2)
We present results for all-cause mortality from the PM2.5changes, rather than cardiopulmonary disease (CPD) and lung cancer (LC), as all-cause mortality is the most comprehensive estimate of PM-related mor-tality appropriate for the US. However, we also estimate the PM-related mortality from CPD and LC to compare with the results of WEST2013. We also quantify the premature mortality from respiratory disease (RESP) associated with O3changes. The 90% confidence inter-vals (CI) presented in this study are calculated using a full Monte Carlo analysis inside BenMAP-CE consid-ering only uncertainty in the HIF.
BenMAP-CE uses county-level baseline mortal-ity rates for the present day and projected to 2050 at five-year intervals, including RESP for O3, and all-cause, CPD, and LC for PM2.5 (RTI Interna-tional2015). Overall, the projected baseline mortality rates within BenMAP-CE decrease from 2005–2050.
However, the baseline mortality rates used by WEST2013 are projected to increase in 2050 in the US, derived from the International Futures (IFs, version 6.54, Hugheset al 2011) under the UNEPGEO Base Case scenario. For population, BenMAP-CE includes the future population projection at county level in the US until 2040 only (totalling 403 million, Woods and Poole 2012), but our study is focused on 2050 (the RCP4.5 projected total population is 384 mil-lion in 2050, Clarke et al 2007). To be consistent with WEST2013, we run BenMAP-CE with baseline mortality rates in 2005 and the population projection in 2040 (aged 30 and above), and then post-process the BenMAP-CE outputs by multiplying adjustment ratios to match the US population and US average baseline rates of WEST2013 (supplementary table S2). By doing so, we assume that future baseline mortal-ity rates increase at a uniform national ratio in each county without age, gender or ethnic variations, and that the spatial distribution of population in 2050 of RCP4.5 is the same as that in 2040 projected by Woods and Poole (2012).
3. Results
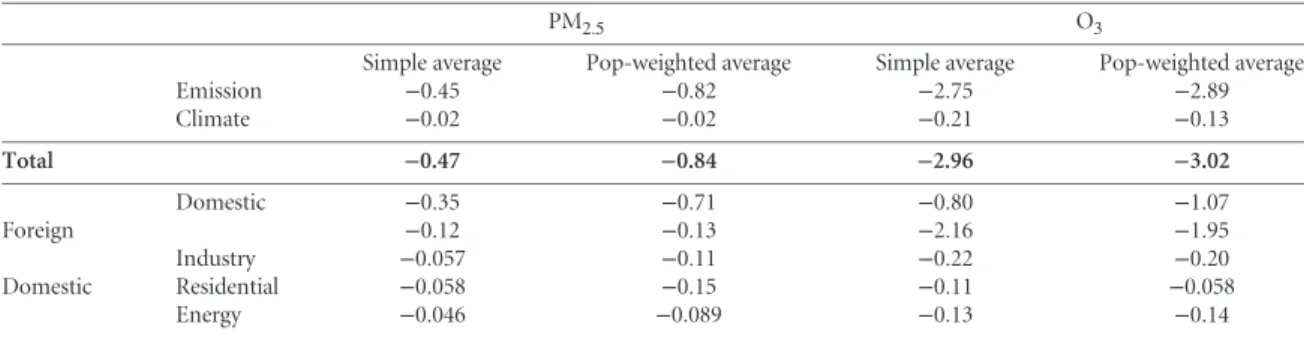
Table 2.Co-benefits for air quality changes in the continental US in 2050 from global, domestic and sectoral GHG mitigation. For PM2.5 (𝜇g m−3) we use the three-year average, and for O3(ppbv), we calculate the 6 month ozone season of 1 hr daily maximum, and then average over three years. Co-benefits are estimated using RCP4.5 minus REF. Negative values indicate air quality improvements.
PM2.5 O3
Simple average Pop-weighted average Simple average Pop-weighted average
Emission −0.45 −0.82 −2.75 −2.89
Climate −0.02 −0.02 −0.21 −0.13
Total −0.47 −0.84 −2.96 −3.02
Domestic −0.35 −0.71 −0.80 −1.07
Foreign −0.12 −0.13 −2.16 −1.95
Industry −0.057 −0.11 −0.22 −0.20
Domestic Residential −0.058 −0.15 −0.11 −0.058
Energy −0.046 −0.089 −0.13 −0.14
Table 3.Estimated total co-benefits for avoided premature mortality in 2050 from PM2.5-related all-cause mortality and O3-related respiratory mortality (deaths yr−1). The values in parenthesis are 90% confidence intervals (CI). Co-benefits are estimated using RCP4.5 minus REF. Positive values indicate fewer deaths.
PM2.5 O3
Emission 15 800 (11 500–20 000) 7600 (3400–11 700)
Climate 300 (200–400) 500 (200–700)
Total 16 000 (11 700–20 300) 8000 (3600–12 400)
Domestic 13 600 (9900–17 300) 3000 (1300–4700)
Foreign 2400 (1800–3100) 5000 (2200–7800)
Industry 2100 (1500–2700) 500 (200–800)
Domestic Residential 2800 (2000–3600) 200 (100–300)
Energy 1700 (1200–2200) 300 (100–500)
45°N
40°N
35°N
30°N
25°N
45°N
40°N
35°N
30°N
25°N
110°W 100°W 90°W 80°W 110°W 100°W 90°W 80°W
1 2 3 4 5 6 7 8 deaths yr
-1
(a) (b)
16000 (11700-20300) 8000 (3600-12400)
Figure 2.Total co-benefits (S RCP45-S REF) for avoided premature mortality (deaths yr−1) in the US in 2050, for (a) PM2.5(all-cause mortality), and (b) O3(respiratory mortality). Total avoided deaths and 90% confidence intervals are shown at the top of each panel. Positive values indicate fewer deaths.
weighting has less of an impact on the O3 estimates as the longer lifetime of O3produces a more uniform spatial distribution.
For the human health benefits from the global GHG mitigation, our results show that 16 000 (90% CI: 11 700–20 300) premature deaths will be avoided annually in the US in 2050 due to PM2.5 decreases (table3). The states with the most avoided deaths are CA (2500 deaths, CI: 1800–3200), New York (NY, 1300 deaths, CI: 1000–1700) and Texas (TX, 1200 deaths, CI: 800–1500) (supplementary fig-ure S1 and table S4), with each state having large population and large PM2.5decreases (figure1, sup-plementary table S4). For O3, the total avoided deaths in the US are 8000 (CI: 3600–12 400), 50% fewer than PM2.5, and also highest in CA (1400, CI: 600–2200), NY (500, CI: 200–800) and TX (500, CI: 200–700).
The spatial patterns of both PM2.5 and O3 related avoided premature mortality are shown in figure 2. We further quantify the human health co-benefits from global GHG mitigation by calculating the avoided mortality per capita (MPC, the avoided deaths per million people age 30 and older) in 2050, for both PM2.5and O3(supplementary figure S2, table S4). The MPC for PM2.5is much higher in the East than in the West (except for CA), with much greater vari-ation than for O3, consistent with the finding that the total concentration co-benefits vary locally to region-ally for PM2.5, and are more spatially uniform for O3 (figure1). Relative to the present, air quality improves and premature mortality decreases in the future under REF, due to the large projected emission reductions of conventional air pollutants (Silvaet al2016a, Smith
0 50 100 150 200 250
yr
(1000s
Mortality
-1)
This Study WEST2013
RESP CPD LC 0 50 100 150 200 250
M
o
rt
alit
y
(1000s
y
r
-1)
This Study WEST2013
RESP CPD LC
0 20 40
Mo
rt
a
lit
y
(
1
0
0
0
y
r
-1)
This Study WEST2013
RESP CPD LC (a)
(c)
(b)
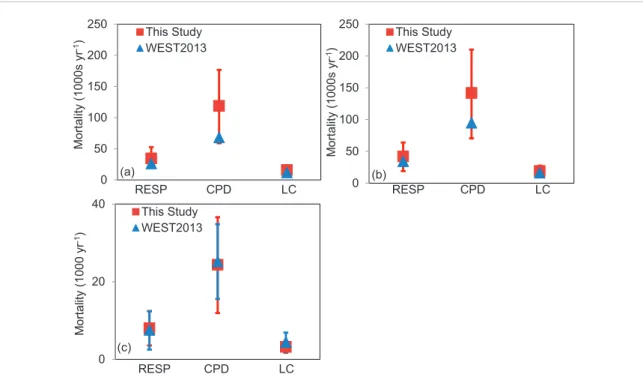
Figure 3.Comparisons between this study (red) and WEST2013 (blue) of the avoided human mortality in the US (1000 deaths yr−1) from air quality changes in 2050 compared with 2000, for (a) REF scenario, (b) RCP4.5 scenario, and (c) the total co-benefits in 2050. The red lines represent the 90% confidence intervals (CI) for this study, and blue lines are 95% CI for WEST2013. RESP indicates mortality from O3-related respiratory deaths, CPD for PM2.5-related cardiopulmonary deaths, and LC for PM2.5-related lung cancer.
We then compare the health results in this study with WEST2013 for the avoided deaths from 2000 to 2050 under the REF (S REF-S 2000) and RCP4.5 (S RCP45-S 2000) scenarios, and the total co-benefits in 2050 (S RCP45-S REF). Zhang et al (2016) con-cluded that future PM2.5 changes are greater using the regional CMAQ model simulations than those in WEST2013 for both REF (S REF-S 2000) and RCP4.5 (S RCP45-S 2000) scenarios, while the future O3 changes in 2050 were comparable between CMAQ and WEST2013. When quantifying human health impacts, figure3 shows that the avoided premature mortality for PM2.5for both REF and RCP4.5 relative to S 2000 are higher in this study than WEST2013, especially for CPD, which is consistent with the greater reductions in PM2.5predicted here. The avoided premature mortal-ity for O3for both REF and RCP4.5 relative to S 2000 are comparable between this study and WEST2013. The total co-benefits for the population-weighted air quality changes are higher for WEST2013 (4.56 ppbv for O3 and 1.30 𝜇g m−3 for PM2.5, figure S26 and S29 in WEST2013) than our estimations using the regional model (3.02 ppbv for O3and 0.84𝜇g m−3for PM2.5, table3), but the estimated total co-benefits for avoided mortality are similar (figure3in this paper). The fact that the total co-benefits for avoided deaths are comparable between this study and WEST2013, even though air quality changes are different, may be in part due to the use of county-level baseline mor-tality rates here vs the national average of WEST2013. Note that the total avoided deaths from the sum of CPD (24 300 deaths yr−1) and LC (3200 deaths yr−1) is larger than the co-benefits calculated for all-cause
mortality, as the RRs for CPD (1.13, 95%CI:1.1– 1.16) and LC (1.14, 95%CI:1.06–1.23) are greater than that for all-cause mortality (1.06, 95%CI:1.04–1.08) (Krewskiet al2009).
45°N
40°N
35°N
30°N
25°N
45°N
40°N
35°N
30°N
25°N
45°N
40°N
35°N
30°N
25°N 45°N
40°N
35°N
30°N
25°N
110°W 100°W 90°W 80°W 110°W 100°W 90°W 80°W
110°W 100°W 90°W 80°W
110°W 100°W 90°W 80°W
deaths yr-1
1 2 3 4 5 6 7 8 9 10
(a) (b)
(c) (d)
15800 (11500-20000) 7600 (3400-11700)
300 (200-400) 500 (200-700)
Figure 4.The emission co-benefits (a), (b) and climate co-benefits (c), (d) for avoided human mortality in 2050 (deaths yr−1) from PM2.5(a), (c) and O3(b), (d). White in panels (c) and (d) indicates increased mortality attributed to slowing climate change, from increases in air pollutant concentrations. Total avoided deaths and 90% confidence intervals are shown at the top of each panel. Positive values indicate fewer deaths.
GHG reductions from foreign countries account for 2400 avoided deaths (CI: 1800–3100) for PM2.5 -related all-cause mortality, and 5000 (CI: 2200–7800) deaths for O3-related RESP, which are 15% and 62% of the total deaths for PM2.5and O3 (table3). Foreign GHG mitigation likewise contributes 15% (−0.13 𝜇g m−3 for the three-year US population-weighted average) of the total air quality co-benefits for PM2.5, and 65% (−1.95 ppbv) of the total co-benefits for O3, emphasizing that PM2.5is more influenced by emission reductions in US, while O3is more influenced by the global methane reductions and intercontinental air pollutant transport (Zhanget al2016). Foreign co-benefits for both PM2.5- and O3-related mortality are centred in urban areas (figure 5), where population density is high, even though foreign GHG mitiga-tion reduces surface O3 pretty uniformly in the US (see supplementary figure S3). The contributions from domestic GHG mitigation on population-weighted average PM2.5(85% of the total) and O3 (35%) are higher than those for the simple average (74% for PM2.5 and 27% for O3 in table 2), as air quality improvements from domestic GHG mitigation occur in densely-populated areas. CA has the largest human health benefits from foreign GHG mitigation, with 400 deaths (CI: 300–500) avoided from PM2.5-related all-cause mortality, and 800 deaths (CI: 400–1300) avoided from O3. We have calculated total, domes-tic, and foreign mortality co-benefits for each state (see supplementary tables S4–S6). In quantifying the
domestic co-benefits, we neglect the effect of US GHG mitigation on global climate change, and assume that global and regional climate will be controlled by for-eign GHG emissions, which introduces a small error into our results. We also attribute the global methane concentration change to the effect of foreign GHG reductions, as US emissions are relatively small (6%– 10% of global emissions).
45°N
40°N
35°N
30°N
25°N
45°N
40°N
35°N
30°N
25°N 45°N
40°N
35°N
30°N
25°N 45°N
40°N
35°N
30°N
25°N
110°W 100°W 90°W 80°W 110°W 100°W 90°W 80°W
110°W 100°W 90°W 80°W
110°W 100°W 90°W 80°W
1 2 3 4 5 6 7 8 9 10 deaths yr
-1
(a) (b)
(d) (c)
13600 (9900-17300) 3000 (1300-4700)
2400 (1800-3100) 5000 (2200-7800)
Figure 5.Domestic (a), (b) and foreign co-benefits (c), (d) for avoided all-cause mortality from PM2.5(a), (c) and respiratory disease from O3(b), (d) in the US in 2050. Total avoided deaths and 90% confidence intervals are shown at the top of each panel. Positive values indicate fewer deaths.
sectors account for a larger fraction of emissions of most pollutants, possibly reflecting the smaller NMVOC emissions decreases from these sectors in RCP4.5. These findings of greater avoided deaths for residential GHG reductions suggest that residential sources might be targeted in policy efforts. Future research should attempt to evaluate air quality and health co-benefits for more specific GHG mitigation measures, including for other sources such as transportation, so that these co-benefits can be evaluated alongside the cost of GHG mitigation.
The total co-benefits of avoided premature mortality are monetized using high ($9.81 million) and low ($3.25 million) values of a statistical life (VSLs) for the US in 2050, as estimated by WEST2013 (in 2005 US$) based on projected income growth. Adding avoided mortality from O3 and PM2.5, and dividing monetized benefits by US CO2reductions in 2050, we estimate monetized co-benefits in 2050 of$137 ($87– $187) per ton CO2 reduced at a high VSL, and$45 ($29–$62) per ton CO2 reduced at a low VSL, very similar to the 2050 estimates of WEST2013 for the US. As for WEST2013, these monetized estimates do not account for avoided deaths outside of the US. These benefits at high VSL exceed the full range of GHG marginal abatement cost estimates from 13 energy-economic models (Westet al2013), and at low VSL are greater than the median cost. Of these total co-benefits, foreign GHG reductions are responsible for monetized benefits of$42 ($23–$62) per ton CO2at high VSL, and
$14 ($8–$21) at low VSL, which is 31% of the total monetized benefits.
4. Conclusions
Significant uncertainties exist in our results. For PM2.5, we compare the uncertainty for the future con-centration change under RCP4.5 of −2.92%±2.3%
𝜇g m−3 (−2.79%±22.0%𝜇g m−3for the PM25 esti-mated as a sum of species) based on the spread of ACCMIP models (Silvaet al2013, Zhanget al2016), and the uncertainty for the CRF is 0.0058%±32.8%. For O3, the uncertainty for the future concentration change under RCP4.5 is−5.87%±48.8% ppbv, and the uncertainty for the CRF is 0.0039%±69.2%. There-fore, the uncertainty in the CRF likely contributes more to the overall uncertainty than the uncertainty in modeled concentration changes, although, for ozone, concentration uncertainty is of similar magnitude to the CRF uncertainty. When quantifying the avoided deaths from improved air quality, we only account for adults above 30. Additional uncertainty arises from downscaling from the global to the regional scale chemistry model, including the conversion of chem-ical mechanisms in the models, particularly from the addition of new inorganic species for primary PM2.5 (Zhang et al 2016). Different components of PM2.5 may have different effects on human health, like black carbon particles (Liet al2016, Zanobetti and Schwartz 2009). However, we consider all of the components of PM2.5to have equal toxicity. Only a single modelling system (AM3-WRF-SMOKE-CMAQ) is used in this study, and as pointed out previously (Postet al2012, Silva et al 2013), results may differ among different models and ensembles of models can better charac-terize the range of results. Similarly, increasing the number of years simulated by the models used here can reduce uncertainty related to inter-annual variability (Deser et al 2012). Our conclusions are specific to the REF and GHG mitigation (RCP4.5) scenarios we choose, including their simulation of future emission pathways, which depend on economic drivers and air pollution control policies, and would differ for other scenarios. For example, the new shared socio-economic pathways 4 (SSP4) have different climate policy assumptions considering economic, institu-tional and technological limitations (Raoet al2017), and different emission reductions for co-emitted air pollutants in 2050 (supplementary table S3). We only account for the co-benefits from air quality changes due to the GHG mitigation, neglecting other impacts of climate change on health, like heat-waves, elevated temperatures, and infectious disease (Smithet al2014). Despite these uncertainties, both those quantified and unquantified, our major conclusion that global GHG mitigation can have significant co-benefits for air qual-ity and avoided mortalqual-ity in the US is unlikely to be altered.
Future studies should estimate co-benefits at both the global and regional scales with finer-resolution air quality model simulations. Uncertainties could be reduced by improving emission estimates for mul-tiple species, the chemical and aerosol mechanisms (CB05 and AE6), and using multi-year simulations
and ensemble model experiments (Rao et al 2016). Future air pollutant reference-case emission trajecto-ries are also uncertain (e.g. Raoet al 2017), and use of multiple future scenarios would also be valuable. Future studies should also evaluate benefits beyond health, such as for agriculture and energy. Previous studies have shown that using coarse resolution models tends to underestimate mortality near urban areas for PM2.5(Punger and West2013, Liet al2015). Improv-ing horizontal resolution in future studies can produce more robust estimates of health benefits, and may cause estimates to increase.
Previous studies have estimated co-benefits of GHG mitigation mainly on local, national, or con-tinental scales (Bellet al 2008, Cifuenteset al 2001, Nemetet al2010). These studies have presumed that most co-benefits are realized on those scales, and that the contributions of foreign GHG mitigation to total co-benefits would be small. Here we show that the US can gain significantly greater co-benefits for air quality and human health, especially for ozone, when coordinating its GHG emission reductions with con-current reductions in other nations to combat global climate change. Similar results would also be expected for foreign countries, which will likely also benefit from GHG mitigation in other countries. Previous stud-ies, which only estimate co-benefits from regional or local GHG mitigation may significantly underestimate the full co-benefits of coordinated global actions to mitigate climate.
Acknowledgments
This work was funded by the US Environmental Protection Agency STAR grant #834285, National Institute of Environmental Health Sciences grant #1 R21 ES022600-01, and NASA Health Air Quality Applied Sciences Team #NNX16AQ80G. The contents are solely the responsibility of the grantee and do not necessarily represent the official views of the US EPA or other funding sources. We also thank the three anonymous reviewers for their thoughtful comments and suggestions which make the paper more complete.
ORCID iDs
Yuqiang Zhang https://orcid.org/0000-0002-9161-7086
J Jason West https://orcid.org/0000-0001-5652-4987
References
Anenberg S C, West J J, Fiore A M, Jaffe D A, Prather M, Bergmann D, Cuvelier K and Dentener F J 2009 Intercontinental impacts of ozone pollution on human mortalityEnviron. Sci. Technol. 436482–7
Bell M L, Goldberg R, Hogrefe C, Kinney P L, Knowlton K, Lynn B, Rosenthal J, Rosenzweig C and Patz J A 2007 Climate change, ambient ozone, and health in 50 US citiesClim. Change82 61–76
Bell M L, Davis D L, Cifuentes L A, Krupnick A J, Morgenstern R D and Thurston G D 2008 Ancillary human health benefits of improved air quality resulting from climate change mitigation Environ. Health741
Bowden J H, Otte T L, Nolte C G and Otte M J 2012 Examining interior grid nudging techniques using two-way nesting in the WRF model for regional climate modelingJ. Clim.25 2805–23
Bowden J H, Nolte C G and Otte T L 2013 Simulating the impact of the large-scale circulation on the 2 m temperature and precipitation climatologyClim. Dyn.401903–20 Byun D and Schere K L 2006 Review of the governing equations,
computational algorithms, and other components of the Models-3 Community Multiscale Air Quality (CMAQ) modeling systemAppl. Mech. Rev.5951
Caiazzo F, Ashok A, Waitz I A, Yim S H L and Barrett S R H 2013 Air pollution and early deaths in the United States. Part I: quantifying the impact of major sectors in 2005Atmos. Environ.79198–208
Capps S L, Driscoll C T, Fakhraei H, Templer P H, Craig K J, Milford J B and Lambert K F 2016 Estimating potential productivity cobenefits for crops and trees from reduced ozone with US coal power plant carbon standardsJ. Geophys. Res.12114 679–90
Clarke L E, Edmonds J A, Jacoby H D, Pitcher H M, Reilly J M and Richels R G 2007 Scenarios of greenhouse gas emissions and atmospheric concentrationsProgram2011164
Cifuentes L, Borja-aburto V H, Gouveia N, Thurston G and Davis D L 2001 Hidden health benefits of greenhouse gas mitigation Science2931257–9
Chuwah C, Noije T V, Vuuren D P V, Stehfest E and Hazeleger W 2015 Global impacts of surface ozone changes on crop yields and land useAtmos. Environ.10611–23
Deser C, Knutti R, Solomon S and Phillips A S 2012 Communication of the role of natural variability in future North American climateNat. Clim. Change2775–9 Donner L Jet al2011 The dynamical core, physical
parameterizations, and basic simulation characteristics of the atmospheric component AM3 of the GFDL global coupled model CM3J. Clim.243484–519
Driscoll C T, Buonocore J J, Levy J I, Lambert K F, Burtraw D, Reid S B, Fakhraei H and Schwartz J 2015 US power plant carbon standards and clean air and health co-benefitsNat. Clim. Change5535–40
Duncan B N, West J J, Yoshida Y, Fiore A M and Ziemke J R 2008 The influence of European pollution on ozone in the near East and Northern AfricaAtmos. Chem. Phys.82267–83
Fang Y, Mauzerall D L, Liu J, Fiore A M and Horowitz L W 2013 Impacts of 21st century climate change on global air pollution-related premature mortalityClim. Change121 239–53
Fann N, Baker K R and Fulcher C M 2012 Characterizing the PM2.5-related health benefits of emission reductions for 17 industrial, area and mobile emission sectors across the US Environ. Int.49141–51
Fann N, Fulcher C M and Baker K 2013 The recent and future health burden of air pollution apportioned across US sectors Environ. Sci. Technol.473580–9
Fann N, Nolte C G, Dolwick P, Spero T L, Brown A C, Phillips S and Anenberg S 2015 The geographic distribution and economic value of climate change-related ozone health impacts in the United States in 2030J. Air Waste Manage. Assoc.65 570–80
Fiore A Met al2012 Global air quality and climateChem. Soc. Rev. 416663–83
Fiore A M, Naik V and Leibensperger E M 2015 Air quality and climate connectionsJ. Air Waste Manage. Assoc.65645–85 Friel Set al2009 Public health benefits of strategies to reduce
greenhouse-gas emissions: food and agricultureThe Lancet 3742016–25
Houyoux M R, Vukovich J M, Coats C J, Wheeler N J M and Kasibhatla P S 2000 Emission inventory development and processing for the Seasonal Model for Regional Air Quality (SMRAQ) projectJ. Geophys. Res.1059079
Hughes B B, Kuhn R, Peterson C M, Rothman D S, Sol ´orzano J R, Mathers C D and Dickson J R 2011 Projections of global health outcomes from 2005 to 2060 using the International Futures integrated forecasting modelBull. World Health Organ.89478–86
Jacob D J and Winner D A 2009 Effect of climate change on air qualityAtmos. Environ.4351–63
Jakob M 2006 Marginal costs and co-benefits of energy efficiency investmentsEnergy Policy34172–87
Jerrett M, Burnett R T, Pope C A, Ito K, Thurston G, Krewski D, Shi Y, Calle E and Thun M 2009 Long-term ozone exposure and mortalityNew Engl. J. Med.3601085–95
Jiang X, Hong C, Zheng Y, Zheng B, Guan D, Gouldson A, Zhang Q and He K 2015 To what extent can China’s near-term air pollution control policy protect air quality and human health? A case study of the Pearl River Delta regionEnviron. Res. Lett. 10104006
Krewski Det al2009 Extended follow-up and spatial analysis of the American Cancer Society study linking particulate air pollution and mortalityRes. Rep. Heal. Eff. Inst.1405–36 (PMID:19627030)
Kim Y-M, Zhou Y, Gao Y, Fu J S, Johnson B A, Huang C and Liu Y 2015 Spatially resolved estimation of ozone-related mortality in the United States under two Representative Concentration Pathways (RCPs) and their uncertaintyClim. Change128 71–84
Laden F, Schwartz J, Speizer F E and Dockery D W 2006 Reduction in fine particulate air pollution and mortality: extended follow-up of the Harvard Six Cities StudyAm. J. Respir. Crit. Care Med.173667–72
Lepeule J, Laden F, Dockery D and Schwartz J 2012 Chronic exposure to fine particles and mortality: an extended follow-up of the Harvard Six Cities Study from 1974–2009 Environ. Health Perspect.120965–70
Lelieveld J, Evans J S, Fnais M, Giannadaki D and Pozzer A 2015 The contribution of outdoor air pollution sources to premature mortality on a global scaleNature525367–71 Li Y, Henze D K, Jack D and Kinney P L 2015 The influence of air
quality model resolution on health impact assessment for fine particulate matter and its componentsAir Qual. Atmos. Health951–68
Li Y, Henze D K, Jack D, Henderson B H and Kinney P L 2016 Assessing public health burden associated with exposure to ambient black carbon in the United StatesSci. Total Environ. 539515–25
Liu J, Mauzerall D L and Horowitz L W 2009 Evaluating inter-continental transport of fine aerosols: (2) global health impactAtmos. Environ.434339–47
Markandya A, Armstrong B G, Hales S, Chiabai A, Criqui P, Mima S, Tonne C and Wilkinson P 2009 Public health benefits of strategies to reduce greenhouse-gas emissions: low-carbon electricity generationThe Lancet3742006–15
McCollum D L, Krey V, Riahi K, Kolp P, Grubler A, Makowski M and Nakicenovic N 2013 Climate policies can help resolve energy security and air pollution challengesClim. Change119 479–94
Morita H, Yang S, Unger N and Kinney P L 2014 Global health impacts of future aviation emissions under alternative control scenariosEnviron. Sci. Technol.4814659–67
Naik V, Horowitz L W, Fiore A M, Ginoux P, Mao J, Aghedo A M and Levy H 2013 Impact of preindustrial to present-day changes in short-lived pollutant emissions on atmospheric composition and climate forcingJ. Geophys. Res. Atmos.118 8086–110
Nemet G F, Holloway T and Meier P 2010 Implications of incorporating air-quality co-benefits into climate change policymakingEnviron. Res. Lett.5014007
Plachinski S D, Holloway T, Meier P J, Nemet G F, Rrushaj A, Oberman J T, Duran P L and Voigt C L 2014 Quantifying the emissions and air quality co-benefits of lower-carbon electricity productionAtmos. Environ.94180–91 Post E Set al2012 Variation in estimated ozone-related health
impacts of climate change due to modeling choices and assumptionsEnviron. Health Perspect.1201559–64 Punger E M and West J J 2013 The effect of grid resolution on
estimates of the burden of ozone and fine particulate matter on premature mortality in the USAAir Qual. Atmos. Health6 563–73
Rao Set al2016 A multi-model assessment of the co-benefits of climate mitigation for global air qualityEnviron. Res. Lett.11 124013
Rao Set al2017 Future air pollution in the shared socio-economic pathwaysGlob. Environ. Change42346–58
RTI International 2015BenMAP-CE: Environmental Benefits Mapping and Analysis Program-Community Edition, User’s Manual Appendices( www2.epa.gov/benmap/manual-and-appendices-benmap-ce) (Accessed: 1 December 2015) Selin N E, Wu S, Nam K M, Reilly J M, Paltsev S, Prinn R G and
Webster M D 2009 Global health and economic impacts of future ozone pollutionEnviron. Res. Lett.4044014 Smith K R, Woodward A, Campbell-Lendrum D, Chadee D D,
Honda Y, Liu Q, Olwoch J M, Revich B and Sauerborn R 2014 Human health: impacts, adaptation, and co-benefitsClimate Change 2014: Impacts, Adaptation, and Vulnerability. Part A: Global and Sectoral Aspects. Contribution of Working Group II to the Fifth Assessment Report of the Intergovernmental Panel on Climate Change(Cambridge: Cambridge University Press) pp 709–754
Smith S J, West J J and Kyle P 2011 Economically consistent long-term scenarios for air pollutant and greenhouse gas emissionsClim. Change108619–27
Skamarock W C and Klemp J B 2008 A time-split nonhydrostatic atmospheric model for weather research and forecasting applicationsJ. Comput. Phys.2273465–85
Silva R Aet al2013 Global premature mortality due to
anthropogenic outdoor air pollution and the contribution of past climate changeEnviron. Res. Lett.834005
Silva R Aet al2016a The effect of future ambient air pollution on human premature mortality to 2100 using output from the ACCMIP model ensembleAtmos. Chem. Phys.169847–62 Silva R A, Adelman Z, Fry M M and West J J 2016b The impact of
individual anthropogenic emissions sectors on the global burden of human mortality due to ambient air pollution Environ. Health Perspect.17761776–84
Sun J, Fu J S, Huang K and Gao Y 2015 Estimation of future PM2.5 -and ozone-related mortality over the continental United States in a changing climate: an application of high-resolution dynamical downscaling techniqueJ. Air Waste Manage. Assoc. 65611–23
Tagaris E, Liao K-J, DeLucia A J, Deck L, Amar P and Russell A G 2009 Potential impact of climate change on air pollution-related human health effectsEnviron. Sci. Technol.434979–88
Thompson T M, Rausch S, Saari R K and Selin N E 2014 A systems approach to evaluating the air quality co-benefits of US carbon policiesNat. Clim. Change4917–23
Thomson A Met al2011 RCP4.5: a pathway for stabilization of radiative forcing by 2100Clim. Change10977–94 Trail M A, Tsimpidi A P, Liu P, Tsigaridis K, Hu Y, Rudokas J R,
Miller P J, Nenes A and Russell A G 2015 Impacts of potential CO2-reduction policies on air quality in the United States Environ. Sci. Technol.495133–41
US Environmental Protection Agency 2009Final Report: Integrated Science Assessment for Particulate Matter (Washington, DC: US Environmental Protection Agency) EPA/600/R-08/139F
US Environmental Protection Agency 2013Final Report: Integrated Science Assessment of Ozone and Related Photochemical Oxidants(Washington, DC: US Environmental Protection Agency) EPA/600/R-10/076F
US Environmental Protection Agency 2014Environmental Benefits Mapping and Analysis Program—Community Edition (BenMAP-CE)(www2.epa.gov/benmap)
Weaver C P 2009et alA preliminary synthesis of modeled climate change impacts on US regional ozone concentrationsBull. Am. Meteorol. Soc.901843–63
West J J, Szopa S and Hauglustaine D A 2007 Human mortality effects of future concentrations of tropospheric ozone Comptes Rendus Geosci.339775–83
West J J, Naik V, Horowitz L W and Fiore A M 2009 Effect of regional precursor emission controls on long-range ozone transport—Part 2: steady-state changes in ozone air quality and impacts on human mortalityAtmos. Chem. Phys.9 6095–107
West J J, Smith S J, Silva R A, Naik V, Zhang Y, Adelman Z, Fry M M, Anenberg S, Horowitz L W and Lamarque J-F 2013 Co-benefits of global greenhouse gas mitigation for future air quality and human healthNat. Clim. Change3 885–9
Wilkinson Pet al2009 Public health benefits of strategies to reduce greenhouse-gas emissions: household energyThe Lancet374 1917–29
Woodcock Jet al2009 Public health benefits of strategies to reduce greenhouse-gas emissions: urban land transportThe Lancet 3741930–43
Woods and Poole Economics Inc 2012Complete Demographic Database(Washington, DC: W and P Economics Inc.) Yim S H L, Lee G L, Lee I H, Allroggen F, Ashok A, Caiazzo F,
Eastham S D, Malina R and Barrett S R H 2015 Global, regional and local health impacts of civil aviation emissions Environ. Res. Lett.10034001
Zanobetti A and Schwartz J 2009 The effect of fine and coarse particulate air pollution on mortality: a national analysis Environ. Health Perspect117898–903