STREAMFLOW TRENDS AND DROUGHT IN THE SOUTH ATLANTIC, U.S.:
IMPLICATIONS FOR WATER MANAGEMENT AND WATER TRANSFERS
Lauren A. Patterson
A dissertation submitted to the faculty of the University of North Carolina at Chapel Hill in
partial fulfillment of the requirements for the degree of Doctor of Philosophy in the
Department of Geography.
Chapel Hill
2012
Approved by:
Martin Doyle
Lawrence Band
Gregory Characklis
ABSTRACT
LAUREN A. PATTERSON: Streamflow trends and drought in the South Atlantic, U.S.:
Implications for water management and water transfers
(Under the direction of Martin W. Doyle)
The South Atlantic has recently experienced region-wide droughts. There is concern that water
scarcity may become more common or prevalent due to a warming climate. Problems associated
with water scarcity are compounded by under-developed water allocation policy in the historically
water abundant South Atlantic.
This dissertation examined the potential causes of water scarcity related to changes in average
streamflow from 1934-2005, 1934-1969 (Mid-20th Century) and 1970-2005 (Late-20th Century).
Second, the contribution of climate versus anthropogenic drivers of change in mean annual
streamflow in the Late 20th Century was evaluated using Budyko curves. Third, hydrologic drought
was characterized in the South Atlantic and changes in drought characteristics were assessed over
multiple time periods. Fourth, water interconnections, which form an important component of
water infrastructure and water management, were assessed for the potential to transfer water from
a drought free to a drought stricken area.
Results showed that streamflow abruptly shifted from a drier regime in the Mid-20th Century to
a wetter regime in the Late-20th Century with trends of significantly decreasing streamflow since
1970. Climate contributed to increased streamflow during the Late-20th Century throughout the
South Atlantic; whereas human factors varied between basins and either amplified or decreased the
climate change effect on streamflow. Human impacts were equivalent to or exceeded climate
recurrence interval of 6 years. Less than 7% of droughts were longer than one year, yet these longer
duration droughts resulted in region-wide water scarcity. There were few significant temporal
trends in drought characteristics over the studied time periods. The short interconnection distances
(median=11.6 km) rarely extended beyond the spatial extent of multi-year droughts; interconnected
water systems were simultaneously in drought 98±3% of the time from 2000-2008. Water managers
face many challenges with a steadily growing demand and fluctuating long-term and short-term
water supply needs that can be partially met through interconnections. Decision-making will benefit
from monitoring changes in climate, human activities, and streamflow, as well as continually
assessing the ability of current water infrastructure to perform under normal and adverse
ACKNOWLEDGEMENTS
I thank God for putting my feet in an open space, establishing the work of my hands, and
blessing me with the time and resources to complete this dissertation.
I am thankful for having been given the privilege to work with such a supportive and top-notch
committee. I thank Martin Doyle for pursuing me to come to graduate school, as well as for his
encouragement, teaching me to think critically, freedom to explore my own interests, and his wise
counsel. He has taught me something about what it means to have a vision and how to work toward
accomplishing those goals. His method of mentoring as a “crushing hammer, guiding light” has kept
me humble and made me a better researcher. I am thankful for Larry Band’s guidance, his ability to
make connections between diverse concepts, and his brilliant solutions to address seemingly
impossible problems. I am greatly appreciative of Greg Characklis’ clear insight, advice, and
enthusiasm. His water resources economics class was especially instrumental in teaching me about
scarcity and the complex politics and economics of water. I am thankful for Richard Whisnant’s
involvement in water policy, for teaching me the importance of stories as a means to communicate,
and for showing me how research and policy can mix. I appreciate Erika Wise’s willingness to take
me on in her first year at Carolina, for encouraging me to learn atmospheric processes, for providing
feedback, and for brainstorming ideas.
I am deeply grateful to Brian Lutz for his willingness to work with me, savvy statistical
knowledge, amazing Rcran programming skills, and editing prowess. His willingness to invest time
one step ahead in her research and always willing to teach me the useful methods and skills she
learned. I owe her a deep debt of gratitude for convincing me that programming in SAS and R was
more time efficient than excel and well worth learning.
Thank you Doyle lab members, past and present. Daisy Small, Jen Costanza, Jon Duncan, Jeff
Muehlbauer, Autumn Thoyre, and company have a diversity in expertise and personality that kept
graduate school interesting and enjoyable. I am also thankful for the support of UNC’s Geography
Department, particularly Barbara Taylor Davis, Nell Phillips, and Daniel Warfield.
My time working at the Environmental Finance Center at UNC was a blessing. Jeff Hughes, Shadi
Eskaf, Mary Tiger, Glenn Barnes, and others were a wonderful team to work with and have taught
me a lot about working with local governments, and of course, water-related financing. I am
especially grateful to Shadi for being patient and willing to teach me about interconnections,
dashboards, and how to think through problems by drawing them out on paper.
I am deeply honored and thankful to the institutions that chose to fund my research, including
the Udall Foundation, Periship Program, and National Science Foundation. It is my hope that these
institutions are pleased with the product of their investment.
I can never adequately express my depth of gratitude for the support and love given to me by
my family and friends. Jessie Stewart and Brooke Wheeler have been amazing roommates and
constant companions – thank you for letting me into your homes. Gretchen Logterman, Sarah
Hancock, Emily Mathers, Dana Saleeby, Nicki Jarret, Heather Deans, and Charlie Shaefer have been a
light to my feet and incredibly patient in teaching me what it means to live. The Peter’s, Hawke’s,
Perry’s, Stepp’s, Gervais’ and many others have let me into their lives and taught me what it means
TABLE OF CONTENTS
LIST OF TABLES ... X
LIST OF FIGURES ... XI
I. INTRODUCTION TO WATER RESOURCES IN THE SOUTH ATLANTIC ... 1
1.1 Introduction to Water Scarcity ... 1
1.2 Policy Legacies to Address Water Scarcity ... 2
1.3 Water Scarcity Drivers in the South Atlantic ... 4
1.4 Dissertation Outline ... 6
1.5 Figures ... 8
1.6 Literature Cited ... 9
II. STREAMFLOW CHANGES IN THE SOUTH ATLANTIC, US DURING THE MID AND LATE 20TH CENTURY ... 11
2.1 Abstract ... 11
2.2 Introduction ... 12
2.3 The South Atlantic Region ... 13
2.4 Data and Methods ... 14
2.5 Results ... 16
2.6 Discussion ... 20
2.9 Figures ... 28
2.10 Literature Cited ... 36
III. CLIMATE AND DIRECT HUMAN CONTRIBUTIONS TO CHANGES IN MEAN ANNAUL STREAMFLOW ... 39
3.1 Abstract ... 39
3.2 Introduction ... 40
3.3 Study Area ... 45
3.4 Methodology ... 46
3.5 Results ... 56
3.6 Discussion ... 60
3.7 Policy Implications ... 63
3.8 Tables ... 66
3.9 Figures ... 70
3.10 Appendix ... 81
3.11 References ... 88
IV. CHARACTERIZATION OF DROUGHT SINCE THE 1930’S IN THE SOUTH ATLANTIC, US ... 92
4.1 Abstract ... 92
4.2 Introduction ... 92
4.7 Tables ... 109
4.8 Figures ... 111
4.9 Appendix ... 117
4.10 References ... 122
V. INTERCONNECTIONS, WATER SCARCITY AND DROUGHT ... 125
5.1 Abstract ... 125
5.2 Introduction ... 126
5.3 Snapshot of Water Resources in North Carolina ... 127
5.4 Methods ... 131
5.5 Results ... 136
5.6 Discussion ... 140
5.7 Policy Implications ... 145
5.8 Tables ... 148
5.9 Figures ... 149
5.10 Appendix ... 159
5.11 References ... 161
VI. SUMMARY OF DISSERTATION FINDINGS ... 164
6.1 Policy Implications ... 167
6.2 Figures ... 170
LIST OF TABLES
CHAPTER 2
2.1: SMK test results for streamflow. ... 26
2.2: SMK test results for temperature. ... 26
2.3: SMK test results for precipitation. ... 26
2.4: Highlighted results from previous streamflow trend studies. ... 27
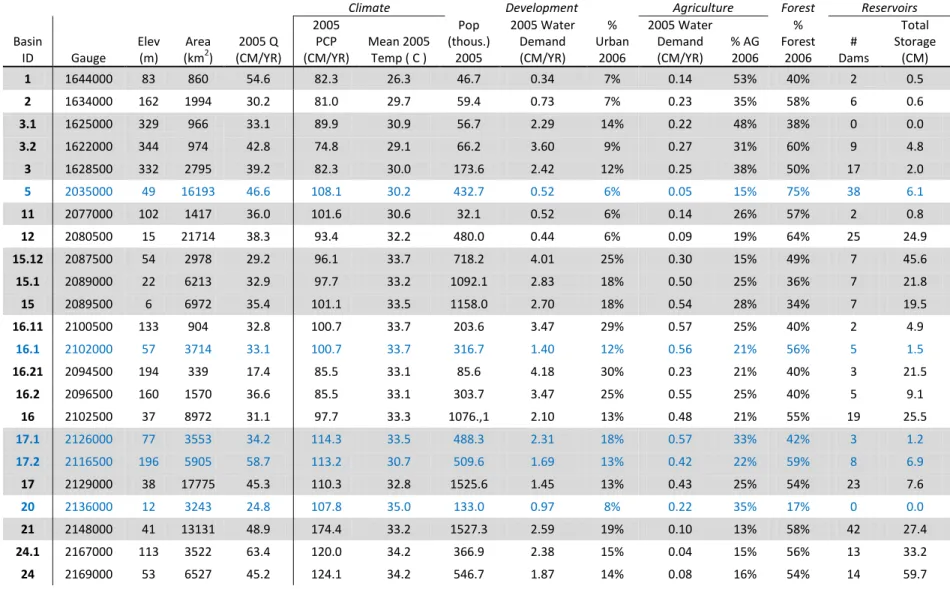
CHAPTER 3 3.1: Physical and hydrological characteristics of watersheds. ... 66
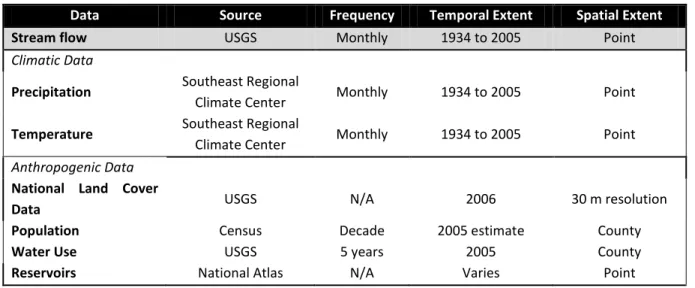
3.2: Data sources and their temporal and spatial extent of coverage... 67
3.3: Water demand linked to NLCD categories ... 67
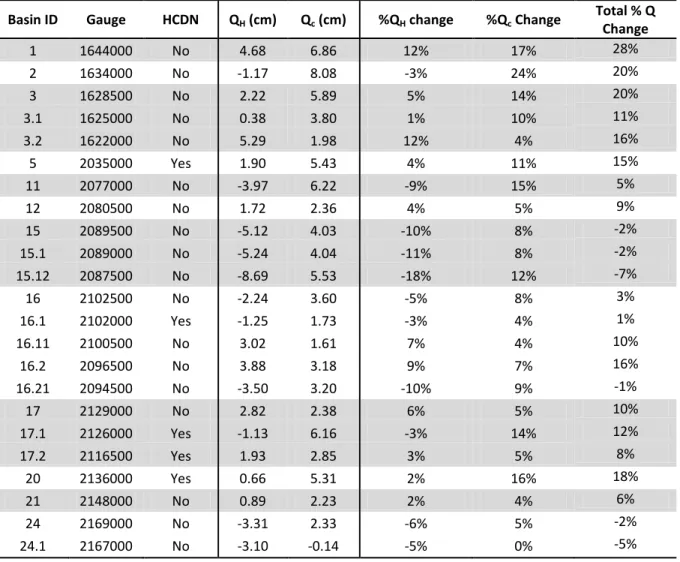
3.4: Climate- and human- induced changes to streamflow by basin ... 68
3.5: NMS axes and monthly spearman correlation results by basin... 69
CHAPTER 4 4.1: Characteristics for droughts of different duration ... 109
4.2: Average probabilities for all 54 basins by time periods ... 109
4.3: Changes in conditional and joint probabilities for nested basins. ... 110
4.4: Mid-20th Century drought characteristics ... 119
4.5: Late-20th Century drought characteristics ... 119
CHAPTER 5 5.1: Selection of inter-basin transfers averaging 5 mgd or more in 2010 ... 148
LIST OF FIGURES
CHAPTER 1
1.1: Schematic outlining dissertation chapters and their relationship to one another. ... 8
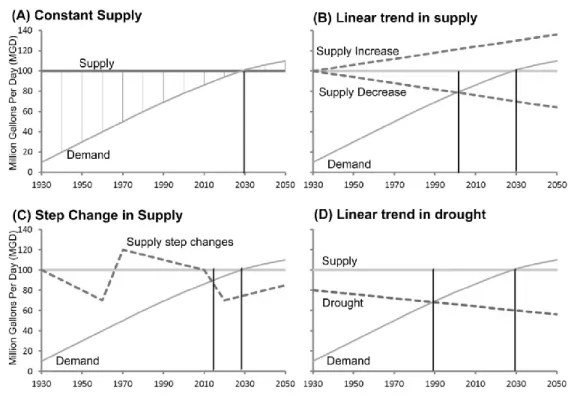
1.2: Impact of changes in streamflow and drought on water scarcity.. ... 8
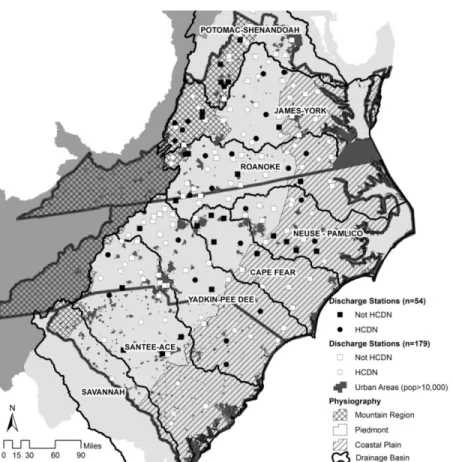
CHAPTER 2 2.1: The South Atlantic Region with physiographic provinces. ... 28
2.2: Percent of months for each site (12 months * 54 sites) per year that are dry (<= 30% average streamflow) and wet (>= 70% average streamflow).. ... 29
2.3: Spatial distribution of streamflow trends. ... 30
2.4: (A) Average monthly streamflow for stations. (B-D) Box plot of changes in streamflow for all time periods... 31
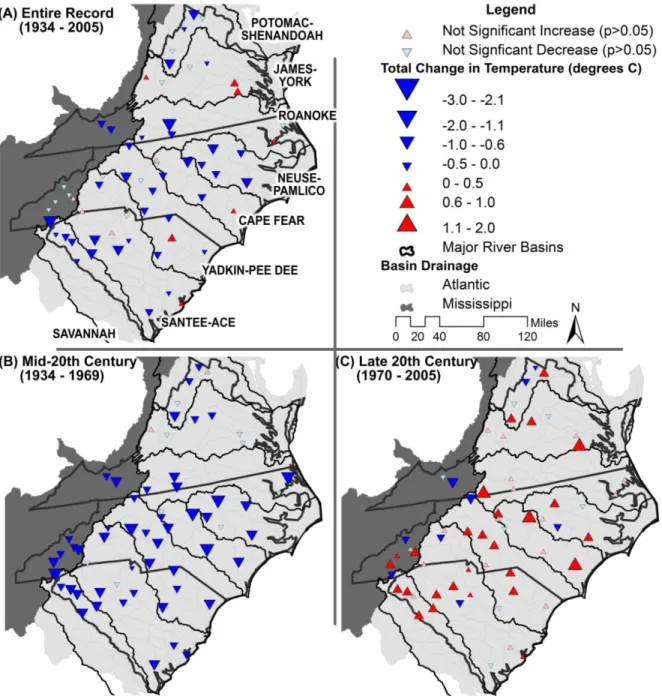
2.5: Spatial distribution of temperature trends. ... 32
2.6: (A) Average monthly temperature for stations. ... 33
2.7: Spatial distribution of precipitation trends. ... 34
2.8: (A) Average monthly precipitation for stations. ... 35
CHAPTER 3 3.1: Basins corresponding to USGS gauges located in the South Atlantic ... 70
3.2: Basin characteristics. ... 71
3.3: Budyko curve displaying the climate and direct human impact of change in E/P on streamflow. ... 72
3.4: Major reservoirs with total reservoir storage per basin as of 2005. The chart highlights the cumulative reservoir storage for selected basins through time. ... 73
3.5: Initial starting points (Ep/P, E/P) for all basins during Period 1 (1934-1969) ... 74
3.7: (A) Contribution of both climate and human impacts on the total change in streamflow. (B-C) Basin shade is the total percent change in streamflow
relative to 1934-1969. ... 76
3.8: NMS representation of basins in ordination space showing similarities between basins based on selected characteristics. Human induced changes on streamflow (Qh) are overlayed.. ... 77
3.9: Comparison between QH% and environmental variables in the NMS and R2 value.. ... 78
3.10: Temporal changes in QH and Qc for selected basins. ... 79
3.11: Relativized discharge for all basins to the maximum Q for each basin. ... 80
3.12: QH and QC results using PRISM data instead of point precipitation data. ... 83
3.13: Subtraction residuals between nested basins. ... 86
CHAPTER 4 4.1: Stream gauges and their representative basins in the South Atlantic.. ... 111
4.2: Method for calculating hydrological drought characteristics ... 112
4.3: Average deficit for a given duration bin. ... 113
4.4: The number of drought events that began (A) and ended (B) in the study area between 1930-2010.. ... 113
4.5: Trends in drought characteristics. ... 114
4.6: Percent of study area in drought over time. Black line is a 5 month moving average. ... 115
4.7: Spatial distribution in the maximum annual streamflow deficit for of two multi-year droughts (1999-2002 and 2006-2008). ... 115
4.8: Decadal shifts in population and streamflow for the South Atlantic ... 116
4.9: Schematic illustrating the impact of (A) change in drought and (B) change in mean streamflow on reservoir refill times... 116
CHAPTER 5
5.1: CWS and Interconnections included in this study for North Carolina... 149
5.2: Interconnections and drought methods.. ... 150
5.3: Interconnection components. ... 151
5.4: Difference between supply and demand for reporting CWS. ... 152
5.5: (Top) Comparison of water withdrawals and streamflow along the Flat River. (Bottom) Comparison of water withdrawals and streamflow along the Yadkin River... 153
5.6: Matrix of USDM drought index for each CWS by component.. ... 154
5.7: Percent of CWS in drought based on component size. ... 155
5.8: Average percent of CWS within each component in drought conditions ... 156
5.9: (A) Interconnection distances and their distribution (B) Adjacent components within 11.6 km that had significantly different drought status ... 157
5.10: Drought probabilities for buyers and sellers.. ... 158
5.11: Reported future interconnections and barriers to interconnections ... 160
1
CHAPTER 1
INTRODUCTION TO WATER RESOURCES IN THE SOUTH ATLANTIC
1876 – “The 100 meridian is the divide between the dry west and the lush east” – John Powell
1.1Introduction to Water Scarcity
The South Atlantic, a three state area referring to North Carolina, South Carolina, and Virginia,
has historically experienced abundant water availability to meet demand and has made it
unnecessary to develop region-wide water allocation regulations. Currently, institutional water
policies and regulations for allocating water remain under-developed in the South Atlantic. Two
recent region-wide, multi-year droughts (1998-2002 and 2006-2008) brought reservoirs to
record-lows and placed unprecedented stress on water systems to meet customer demand. The
back-to-back experience of water scarcity (i.e. insufficient supply to meet demand) has catalyzed a transition
in water resources management to be more proactive in addressing water allocation issues in the
South Atlantic.
While drought (a deficit in water from what is normally available) triggered water scarcity, the
impacts of the drought were exacerbated by the growth in population (increased water demand),
changes in land use (impacts water demand and evaporation rates), and non-conservative water use
practices (Seager et al., 2009). Jim Thebaut’s upcoming documentary “Running Dry-Beyond the
in recorded history after a year of severe drought conditions (Weissert and Plushnick-Masti, 2012).
This is the first time a community has run out of water in Texas, and Spicewood is now paying
thousands of dollars to transport water in tankers from a utility 17 miles away.
Previously, during the 2006-2008 drought, the City of Raleigh, NC (population over 400,000)
nearly emptied Falls Lake, the only water supply for the city. Larger cities, such as Atlanta, GA
(population over 5 million) were also within months of running out of water as Lake Lanier reached
record lows. The risk of running out of water has driven these cities to search for ways to increase
their water supply portfolio and reduce water demand. Solving water scarcity in an ad-hoc fashion
during emergencies for individual cities has historically worked, but may not be efficient or work as
well in the future as the margin between demand and supply decreases and decisions made by
individual consumers will have larger impacts on other consumers connected to the same water
source.
1.2 Policy Legacies to Address Water Scarcity
Since “today’s policy choices become tomorrow’s policy constraints” (Crase 2007), it is essential
to develop an understanding of the water-related policy and institutions currently in place, how they
came to be in place, and how they constrain future policy choices related to water scarcity. There is
no national water policy for water allocation. This is likely a result of diverse hydrologic conditions
throughout the country (Crase, 2007) and the focus on state-based federalism (Gerlak 2005).
Federal water policy has been limited to navigation (e.g. River and Harbor Acts 1899), flood control
(e.g. 1936 Flood Control Act), and more recently water quality (e.g. 1972 Clean Water Act) as the
social attitude towards water expanded from development to include environmental restoration
(Feldman, 2009; MacDonnell, 2009; Gerlak, 2005). The climatologic, hydrologic, and socio-economic
allocation. As a result, states have inherited the responsibility for developing policies to manage
water resource allocation as needed.
The British water policy of Riparianism was imported with the 13 colonies East of the
Mississippi River (MacDonnell, 2009; Musgrave, 2007). The riparian doctrine couples water rights to
land property rights immediately adjacent to a surface water body. All adjacent owners have equal
rights to the ‘reasonable’ use of water. Reasonable use is a vague term, and unless adjudicated,
riparian rights are not quantified. Riparianism was initially successful because there was enough
water to meet demand. Since there are not defined rules to allocate water, shortages are to be
equally shared by all water users regardless of how water is being used (e.g. municipal verses
agricultural).
Pure Riparianism is inadequate for dealing with water scarcity (Dellapenna 2002) and leaves
states and local jurisdictions to develop their own policies and legislation. As the South Atlantic
region moves toward reforming water policy to address scarcity, each state is moving towards
reforming their individual legislation and policies that move away from true Riparianism and toward
“Regulated Riparianism” (Lopsteich, 2010; Dellapenna, 2002). Yet, each state is inextricably linked to
adjacent states through shared watersheds, which are being fragmented by inconsistent water
policies that inhibit regional collaboration to manage water resources. This has resulted in some
conflict, particularly between upstream and downstream states for water rights (e.g. the
Apalachicola-Chattahoochee-Flint case between Alabama, Florida and Georgia, and the case
between North and South Carolina for the Catawba River Basin). A fundamental problem in
addressing these cases is that there are no uniform, legal water rights or rules to allocate water.
These policies include promoting water conservation, developing minimum release protocols during
the federal relicensing of reservoirs, requiring water permits for large withdrawals, and inter-basin
transfer regulations; and these changes in policy have signaled a shift towards Regulated
Riparianism with more regulations on water resource allocation.
Water policy reform is occurring in the South Atlantic. It will either change as a result of
proactive, intentional leadership or reactionary, ad-hoc crises. Undoubtedly, a proactive approach
would be ideal because policies would be intentionally designed to be compatible with other policy
goals. For that to happen, an understanding of hydrological, geographical, historical, social,
economic and political perspectives are required (Crase, 2007).
1.3 Water Scarcity Drivers in the South Atlantic
This dissertation seeks to contribute one piece to the picture by informing water policy
regarding how water resource availability has been changing in the South Atlantic. There is
considerable interest in answering this question because many scientists believe that warming
temperatures are intensifying the water cycle (e.g. Huntington, 2006). An intensified water cycle
would translate into more frequent and severe floods and droughts because of the increased ability
for the atmosphere to hold more water (Trenberth, 2011). The theory is based on the
Clausius-Clayperon relationship that describes the water-holding capacity of the atmosphere as a function of
temperature (~7% change in the volume of water for 1⁰C in temperature). This relationship is less
evident in the South Atlantic because evaporation is energy limited, rather than water limited
(Huntington, 2006). Since more water is held in the atmosphere prior to being released, the
intensity of precipitation events will increase and become less frequent (Trenberth, 1999). Thus, the
amount of precipitation may not change but the distribution of precipitation events may change in
processes, land cover, and water management (Diffenbaugh et al., 2005). Thus, it is important to
study climatic changes at regional scales.
Changes in climate (precipitation or temperature) translate to changes in streamflow (Q=P-E;
where Q is streamflow, P is precipitation, and E is evaporation which is impacted by temperature).
Streamflow is also impacted by human-induced changes such as reservoir storage, land cover, and
water demand (Arrigoni et al., 2010). For example, reservoirs are often managed to reduce
streamflow variability by holding more water during recharge months (decreasing streamflow) and
releasing more water during summer months (increasing streamflow). Growing populations require
more water, which reduces streamflow, and water demand also fluctuates during a year with peak
demand during summer months. Human factors can vary widely between basins located a few
kilometers apart; thereby, requiring study at the scale or basin of interest. Thus, climate and human
factors can change the amount of water in streams and those changes can vary between basins and
regions.
Management efforts can benefit from studies that explicitly examine changes in the water cycle
and the regional capacity for water systems to adapt to changes in the average condition. This
information can also be tied with how current water management policies and infrastructure
alleviate or exacerbate changes in streamflow, particularly during extreme conditions such as
drought. Monitoring key elements of the water cycle (i.e. precipitation, streamflow, and
temperature) provides “irreplaceable information that is particularly critical in a non-stationary
environment” (NRC, 2011). This study attempts to answer some of these questions in the four
chapters outlined below by exploring streamflow trends in watersheds that are subject to a broad
1.4 Dissertation Outline
The over-arching goal of this dissertation is to understand how average and drought
streamflow conditions have changed in the South Atlantic. I also sought to understand how much of
the change in streamflow can be attributed to climate and human factors. Lastly, I examined the
capacity of water transfers in North Carolina as a means to mitigate drought by redistributing water
supply (Figure 1.1).
Chapter 2 examines trends in average monthly streamflow for 54 stream gauges over different
periods of time (1934-2005; 1934-1969; 1970-2005) to determine if surface water supply is
changing. Trend analysis of how these elements have changed over time provides one line of
evidence to assess whether there has been a significant change in the water cycle. Estimates of
mean climate are more credible than estimates of climate variability and trends are generally more
credible over larger spatial areas and longer temporal averaging periods (i.e. monthly or annually;
Brown et al., 2011). A change in surface water availability will have significant implications for how
water is managed because that will alter the relationship between supply and demand (Figure 1.2).
Chapter 3 examines how much of the change in mean annual streamflow between two time
periods (1934-1969 and 1970-2005) is due to climate or direct human modification. Direct human
modification includes factors such as reservoir storage, land cover change (urbanization, agriculture,
forestry), and water demand. This method utilizes Budyko curves, which represents the
interdependence between mean annual evaporation and potential evaporation for precipitation in a
river basin. The Budyko curve in the first period (1934-1969) establishes “normal” climate and
watershed characteristics for the basin. The change in the Budyko curve in the second period
(1970-2005) can then be separated into climate (moves along the Budyko curve) and human (movement
contribution of climate and direct human impacts to changes in mean annual streamflow would be a
significant asset to inform water resource management policies and infrastructure decisions.
Chapter 4 characterizes hydrological drought (frequency, duration, deficit, severity, and spatial
extent) in the South Atlantic and explores whether these characteristics have changed over the
same time periods examined in Chapter 2. Drought has been the catalyst for much of the policy
reformation observed in the South Atlantic over the last 15 years, yet few (if any) analytical studies
of drought are available specifically for this region.
Chapter 5 develops a method to explore the utility of water transfers between water systems
to alleviate drought conditions. This method assesses the probability of a system buying water being
in-drought at the same time as the system selling water. The results from this analysis provide
information regarding which connected systems had the lowest probability of simultaneously being
in drought conditions, and whether the difference between near buy systems was significantly
different and would benefit from a future interconnection from a drought only perspective. In
addition, this chapter looks at the capacity for current interconnections to alleviate long-term water
supply and demand imbalances.
The combination of these analyses will provide a picture for the average streamflow water
supply in the South Atlantic, how these supplies are changing over time, what is driving these
changes, and how extremely dry periods impact water supply. This dissertation will also highlight
the role and capacity for interconnections as a short-term emergency, and long-term regular,
1.5 Figures
Figure 1.1: Schematic outlining dissertation chapters and their relationship to one another. Solid line is a direct connection between chapters. Dashed line is an indirect connection.
1.6 Literature Cited
Andreadis, K.M. and D.P. Lettenmaier. 2006. Trends in 20th Century Drought over the continental United States. Geophysical Research Letters 33, L10403, doi. 10.1029/2006GL025711.
Arrigoni, A.S., M.C. Greenwood, and J.N. Moore. 2010. Relative impact of anthropogenic modifications versus climate change on the natural flow regimes of river in the Northern Rocky Mountains, United States. Water Resources Research 46 (W12542), doi:10.1029/2010WR009162.
Barnett, C. 2007. Mirage: Florida and the Vanishing Water of the Eastern U.S. University of Michigan Press, Detroit, MI, pp 240
Brown, C., W. Werick, W. Leger, and D. Fay. 2011. A decision-analytic approach to managing climate risks: application to the upper Great Lakes. Journal of American Water Resources Association 47 (3): 524-534, doi: 10.1111/j.1752-1688.2011.00552.x
Crase, L. 2007. Lessons from Australian Water Reform. In: Crase, L. (ed.) Water Policy in Australia: The Impact of Change and Uncertainty. Resources for the Future, Washington D.C., pp. 248-266.
Dellapenna, J.W. 2002. The law of water allocation in the Southeastern states at the opening of the twenty-first century. UALR Law Review 25: 9-88.
Diffenbaugh, N.S., J.S. Pal, R.J. Trapp, and F. Giorgi. 2005. Fine-scale processes regulate the response of extreme events to global climate change. PNAS 102 (44): 15774015778, doi: 10.1073/pnas.0506042102
Feldman, D.L. 2009. Preventing the repetition: Or, what Los Angeles’ experience in water management can teach Atlanta about urban water disputes. Water Resources Research 45, W04422, doi: 10.1029/2008WR007605.
Gerlak, A.K. 2005. Federalism and U.S. Water Policy: Lessons from the Twenty-First Century. Journal of Federalism 36 (2): 231-257.
Huntington, T.G. 2006. Evidence for intensification of the global water cycle: Review and synthesis.
Journal of Hydrology 319: 83-95, doi: 10.1016/j.jhydrol.2005.07.003.
Lopsteich, R.A. In Press. Water Allocation: The Florida Story-Past, Present and Future
MacDonnell, L.J., 2009. Return to the River: Environmental Flow Policy in the United States and Canada.
Journal of the American Water Resources Association 45(5):1087-1099. DOI: 10.1111⁄ j.1752- 1688.2009.00361.x
NRC (National Research Council). 2011. Global change and extreme hydrology: testing conventional wisdom. Report by the Committee on Hydrologic Science Water Science and Technology Board.
National Academies Press, Washington, D.C. ISBN 978-0-309-21768-2, pp. 45
Seager, R., A. Tzanova, and J. Nakamura. 2009. Drought in the Southeastern United States: Causes, Variability over the Last Millennium, and the Potential for Future Hydroclimate Change. Journal of Climate 22, pp. 5021-5045, doi: 10.1175/2009JCLI2683.1.
Trenberth, K.E. 2011. Changes in precipitation with climate change. Climate Research 47: 123-138, doi: 10.3354/cr00953.
Trenberth, K.E. 1999. Conceptual framework for changes of extremes of the hydrological cycle with climate change. Climatic Change 42: 327-339.
Thebaut, J. Forthcoming. Running Dry: Beyond the Brink. Last accessed February, 2012. http://awramedia.org/mainblog/2011/12/07/preview-jim-thebauts-running-dry-beyond-the-brink/
Wang, D. and M. Hejazi. 2011. Quantifying the relative contribution of the climate and direct human impacts on mean annual streamflow in the contiguous United States. Water Resources Research 47 (W00J12), doi: 10.1029/2010WR010283.
Weissert, W. and Plushnick-Masti, R. 2012. Texas town relying on tanker trucks for water. The Kansas City Star. Published January 30, 2012. Last accessed February, 2012.
2CHAPTER 2
STREAMFLOW CHANGES IN THE SOUTH ATLANTIC, US DURING THE MID AND LATE 20TH
CENTURY1
2.1 Abstract
Repeated severe droughts over the last decade in the South Atlantic have raised concern that
streamflow may be systematically decreasing, possibly due to climate variability. We examined the
monthly and annual trends of streamflow and climate (precipitation and temperature) in the South
Atlantic for the time periods: 1934-2005, 1934-1969, and 1970-2005. Streamflow and climate trends
transitioned ca. 1970. From 1934-1969, streamflow and precipitation both increased and decreased
within similar regions; while temperature decreased throughout the region. From 1970-2005,
streamflow decreased, precipitation decreased, and temperature increased throughout the South
Atlantic. It is unclear whether these will be continuing trends or simply part of a long-term climatic
oscillation. Whether these streamflow trends have been driven by climatic or anthropogenic
changes, water managers face challenging prospects of adapting to decadal-scale persistently wet
2.2 Introduction
Water management policy and infrastructure throughout much of the Atlantic drainage basin
within Virginia (VA), North Carolina (NC), and South Carolina (SC; hereafter the ‘South Atlantic’) was
developed and implemented under assumptions of climate stationarity, an assumption that is
increasingly questioned (Milly et al., 2008). Knowing past, present, and predicted future temporal
and spatial trends in water availability is essential to understand the possible implications of climate
variation on water availability and to develop policies and institutions that can effectively manage
water resources in the South Atlantic.
Streamflow is responsive to both changes in climate and anthropogenic activity, making them a
priority for study. Several recent studies have explored streamflow trends at the national scale (e.g.,
Andreadis and Lettemaier, 2006; Lins and Slack, 2005; McCabe and Wolock, 2002; Lettenmaier et
al., 1994). The general conclusion of these studies was that streamflow has increased in the United
States, particularly since the 1970’s. Yet throughout much of the South Atlantic repeated periods of
water scarcity have been experienced over the last decade. Previous national scale findings do not
align well with regional perceptions or observations. Focusing or relying solely on national trends
may over-shadow the presence of regional scale trends (Zhu and Day, 2005), yet to our knowledge
no previous studies have explicitly explored streamflow trends in the South Atlantic.
Many of the national scale studies that have found increasing streamflow trends also found
increasing precipitation trends, indicating a climatic driver to streamflow change (Andreadis and
Lettenmaier, 2006; Lettenmaier et al., 1994; Lins and Slack, 2005). Climate influences the amount of
water available at all spatial scales ranging from local (101 km2) to regional (105 km2) to global (108
km2). At the regional and global scale, climate is often the major determinant of streamflow quantity
and timing (Arrigoni et al., 2010; Frederick and Gleick, 1999). At more local spatial scales human
The South Atlantic has also experienced large population growth in recent decades (Wachob et al.,
2009; Blowe et al., 2006), resulting in land use change, which has in turn impacted the timing and
quantity of streamflow (Sun et al., 2005; Smith et al., 2002). There have also been changes in water
use and hydro-electric power generation (Wachob et al., 2009). As a result, disentangling the
potential effects of changing climate versus anthropogenic changes on streamflow is challenging.
Regardless of causes, a necessary first step is determining whether climate and streamflow
exhibit spatially and temporally consistent trends (Douglas et al., 2000). In this article, we examine
trends in streamflow throughout the South Atlantic using data from long-term gauging stations. We
assess if trends are consistent across different time periods, as well as spatially within the study
area. We also assess changes in temperature and precipitation to determine if they are spatially and
temporally consistent with observed changes in streamflow. Consistency between climatic and
hydrologic trends would suggest climate change is an important driver of streamflow trends, but
would not distinguish between, or quantify, the relative importance of changing climate verses
anthropogenic impacts.
2.3 The South Atlantic Region
We examined trends in climate and surface streamflow volumes in the Atlantic draining
portions of the South Atlantic states (Figure 2.1). Three basins start in VA and drain in an easterly
direction, while four basins begin in NC and drain in a south-easterly direction. Of these seven river
basins, Cape Fear is the smallest (~25,370 km2) and the Santee-ACE is the largest (~61,100 km2).
The South Atlantic is comprised of three physiographic provinces: the Mountain Region,
rolling topography with a mosaicked landscape of forest, agriculture, and urban development. The
Coastal Plain is relatively flat and land use is dominated by agriculture. Mean annual temperature
increases from the mountains (11⁰C) to the ocean (16⁰C), and mean annual precipitation is typically
lower in the Coastal Plain (average of 115 cm) than inland (up to 200+ cm).
2.4 Data and Methods
We analyzed climate and streamflow data from 1930 to 2010. This time period allowed us to
maximize our sample size while avoiding analyzing records of variable length (longer records were
truncated to 1930). The time period of analysis is significant because even non-parametric trend
analyses are sensitive to the choice of time period (McCabe and Wolock, 2002), particularly to edge
effects if the beginning or end of the record coincides with an abnormally wet or dry period (Hayhoe
et al., 2007). Widespread drought occurred in the South Atlantic in the early 1930’s and late 2000’s
(Figure 2.2). As a result, we truncated our analysis to range from 1934 to 2005 since these years
represent periods of transition between wet and dry conditions, and would decrease the likelihood
of biasing the trend analysis. The change in start and end points did not significantly change our
results from using the full record (1930-2010).
Previous studies found an abrupt shift in climate and streamflow around 1970 (Baines and
Folland, 2007; McCabe and Wolock, 2002). Preliminary analysis of our data showed a similar shift.
Thus, in addition to analyzing the entire record, we also analyzed data separated into the “Mid-20th
Century” (1930-1969) and the “Late-20th Century” (1970-2005) in order to observe general
streamflow trends while accounting for the abrupt shift.
Monthly average streamflow data were acquired from the United States Geologic Survey
(USGS) stream gauge network (http://nwis.waterdata.usgs.gov/nwis). Gauges having records from
USGS gauged streams determined to be free of anthropogenic influences, such as dams, diversions,
and significant land use change during the period of record (up until 1988; Lins and Slack, 2005).
Changes in streamflow at HCDN sites can be attributed predominantly to changes in climate
(Hodgkins et al., 2007). All streamflow data were normalized by drainage area and converted to
centimeters (cm).
Monthly total precipitation and mean temperature data were obtained from the U.S. Historical
Climatology Network (HCN) dataset that was developed by the National Climatic Data Center and
hosted through the Southeast Regional Climate Center (http://climod.meas.ncsu.edu/). HCN data
are adjusted for biases that develop due to changes in station location and instrumentation
(Hodgkins et al., 2007). We only used precipitation (n=90) and temperature (n=60) data from
stations having continuous records from 1930 to 2010 and less than 10% missing data.
2.4.1 Trend Analyses:
Our primary goal was to analyze long-term trends in streamflow and climate. Seasonal Mann
Kendall (SMK) tests provide information regarding the direction and significance of trends. Several
advantages of non-parametric test statistics are that they allowed the data to: (1) be non-normal
(Andreadis and Lettenmaier, 2006), (2) have missing values (Hirsch and Slack, 1984), and (3) have
correlations between seasons (Campbell et al., 2011; Zhu and Day, 2005). Corrections for seasonal
correlations were made by inflating the variance of the test statistic (Hirsch and Slack, 1984). The
SMK tests for monotonic trends while accounting for seasonality by calculating the trend for each
month and combining the results to determine whether the aggregated monthly trends were
continuous variables (e.g. streamflow and time; Hodgkins et al., 2007; Claessens et al., 2006;
Granato, 2006). The slope was multiplied by the length of time to get an estimated total change
during each period.
2.4.2 Cluster Analysis
We were also interested in the spatial trend of streamflow changes. We examined the spatial
association for climate and streamflow trends at each time period using Anselin Global and Local
Moran’s I statistic (Anselin, 1995). Global Moran’s I provided one statistic to indicate whether trends
are homogenous, dispersed, or clustered throughout the South Atlantic. Local Moran’s I gave a
statistic for every station to indicate the presence or absence of significant spatial correlation with
nearby stations relative to all stations within the South Atlantic. This provided a quantitative metric
of determining if stations had positive or negative spatial autocorrelation. High positive Z scores
indicate that the surrounding stations have positive spatial correlation and the test distinguishes
between clusters of high (low) values (i.e. stations with increasing (decreasing) trends). Stations with
low z-scores that have high values near low values or vise-versa have a negative correlation.
2.5 Results
2.5.1 Annual Streamflow Trends
Few stations exhibited significant streamflow trends over the entire record (1934-2005). Two
sites showed a significant increase in streamflow while seven showed declines (Table 2.1). While few
trends were significant, the directionality of observed changes in streamflow was consistent within
basins (Figure 2.3A). For example, the Roanoke, Neuse-Pamlico, and Santee-ACE river basins had
predominantly decreasing streamflow, while the Yadkin-Pee Dee and Potomac-Shenandoah river
In contrast, approximately 50% of all stations exhibited significant trends over the shorter time
periods, with nearly all trends being negative (Table 2.1). The magnitude of decline in the Mid-20th
Century (1934-1969; HCDN = -0.99±0.48; non-HCDN = -0.80±0.40) was similar to the magnitude of
decline in the Late-20th Century (1970-2005; HCDN = -0.96±0.49; non-HCDN = -1.32±0.76).
During the Mid-20th Century, significant decreases in streamflow occurred in VA river basins
and the headwaters of the Neuse-Tar Pamlico and Cape Fear river basins, while significant increases
occurred in downstream sections of the Yadkin-Pee Dee and Santee-ACE river basins (Figure 2.3B).
In contrast, during the Late-20th Century, nearly all gauges in all river basins showed declining
streamflow (Global Moran’s p-value < 0.0001), with larger declines in streamflow clustered
throughout the Piedmont Province of SC and along the Mountain/Piedmont transition in NC (Figure
2.3C). Anselin’s Local Moran I showed the presence of positive spatial autocorrelation between
stations during the Mid- and Late-20th Century periods. The location of increasing and decreasing
clusters reversed between the two sub-periods (figure not shown).
HCDN streams were not more likely to exhibit a significant trend in streamflow than non-HCDN
sites and the magnitude of change was comparable between the two (Table 2.1). Since differences
between HCDN and non-HCDN sites were not significant, we do not distinguish between them any
further.
2.5.2 Monthly Streamflow Trends
Streamflow in the South Atlantic peaks in March and is lowest in September (Figure 2.4A). For
the entire record, there were few significant monthly trends and most of those trends occurred as
During the Mid-20th Century, a few sites (n=3) showed large increases in March streamflow, but
nearly half of the sites showed small, significant declines during late summer months
(July-September; Figure 2.4C). These widespread declines during summer months drive the negative
trends in annual streamflow. In contrast, during the Late-20th Century, no sites showed a significant
positive trend in any month and significant declines, while not as frequent, occurred most
commonly during early summer (May; Figure 2.4D).
2.5.3 Climate Trends: Temperature
Over the entire record, 36 of the 60 climate stations showed a significant decline in mean
annual temperature of approximately 1.0⁰C (Table 2.2). Seven stations exhibited a significant
positive trend, and these were smaller in magnitude (+0.52⁰C) than the declines observed at
stations with negative trends. During the Mid-20th Century, there was a significant decrease in
temperature at 80% of stations (n=49; average decline of -1.3⁰C), with no positive trends at any
station (Table 2.2). In contrast, during the Late-20th Century we found significant increases (average
0.72 ⁰C) in 27 (45%) of the stations, while nine stations showed significant cooling (average -0.76⁰C).
Eight of these nine stations showed significant cooling throughout the period of record.
Spatial trends in temperature showed fairly uniform cooling (1934-2005 and 1934-1969) or
warming (1970-2005) throughout the region (Figure 2.4). The Global Moran’s I was not significant
for any of the time periods, indicating temperature change was fairly homogenous throughout the
South Atlantic.
Temperature changes during the winter and summer months were responsible for the majority
of significant temperature trends observed in the annual data (Figure 2.6B). During the Mid-20th
Century, many sites showed dramatic cooling in early winter (January temperatures declined by
were driven by increases in mid-winter (February = 1.9±0.9⁰C) and mid –summer (June and July =
1.4±0.4⁰C) temperatures at significant sites (Figure 2.6D).
2.5.4 Climate Trends: Precipitation
There were few significant trends in precipitation during all time periods with less than 10% of
available stations showing significant change (Table 2.3). Both the Mid- and Late-20th Century had a
similar number of stations increasing (n=6) and decreasing (n=5) in precipitation. The Late-20th
Century exhibited only decreasing trends in precipitation. Where significant trends were found,
regardless of trend direction, the average change was less than 2% of the average annual
precipitation.
Although the number and magnitude of trends in precipitation were small, there was significant
spatial clustering (Figure 2.7). During the Mid-20th Century, precipitation increases were
predominantly located in the Mountain/Piedmont Provinces of NC and in SC, while VA and the
headwaters of the Cape Fear and Neuse/Pamlico river basins decreased (Figure 2.7). In contrast,
during the Late-20th Century, precipitation declines were located in the Mountain and Piedmont
Provinces of North and South Carolina. Precipitation changes were regionally clustered during the
Mid-20th Century (p-val = 0.001). Significant local clusters of positively correlated precipitation
change occurred in both the Mid- and Late-20th Century (figure not shown).
Precipitation in the South Atlantic showed high variability and little seasonality with a small
increase in rainfall occurring from June to September (Figure 2.8A). For the entire record, 18 of the
90 climate stations experienced a significant decrease in July precipitation (average = -5.6±2.9 cm),
(October = -6.9±1.3cm) of the growing season (Figure 2.8D). While annual trends in precipitation
were small (<2% of annual total precipitation), monthly declines in precipitation had a larger impact
as it accounted for up to 47% of that months average precipitation. Overall, however, the monthly
data were noisy and limited our ability to resolve significant trends in the annual data.
2.6Discussion
There were few significant trends in streamflow over the entire 71-year record (1934-2005).
However, there was an abrupt shift in climate and hydrology (an increase in streamflow) that
occurred around 1970 that overwhelms our ability to assess trends at this timescale. Before
(Mid-20th Century; 1934-1969) and after (Late-20th Century; 1970-2005) this transition we observed many
significant trends in both streamflow and climate (Table 2.1 to Table 2.3). The largest declines in
streamflow were observed during the Late-20th Century. Declines in streamflow were broadly
distributed throughout the South Atlantic in recent decades, with the most significant decreases
occurring in the western Piedmont of North Carolina and throughout South Carolina (Figure 2.3C).
During this period, annual temperatures throughout the region have increased significantly by
nearly 1⁰C (Table 2.2 and Figure 2.5C), with winter months approaching a 2⁰C increase in
temperature (Figure 2.6D). An increase of this magnitude has the potential to significantly alter
evapotranspiration rates and disrupt infrastructure and agriculture (Band and Salvesan, 2009)
particularly since many sites showed significant warming during drier summer months (Figure 2.6D).
Evapotranspiration accounts for a significant amount of the total water flux through ecosystems,
particularly in the heavily forested Mountain and Piedmont provinces (Sun et al., 2005).
Although precipitation is highly variable and trends were difficult to detect, significant declines
during the Late-20th Century were observed throughout the Mountain/Piedmont provinces of North
Figure 2.4D, respectively), during the growing season. There were also decreases in streamflow
during winter months when peak groundwater and reservoir recharge occur. The spatial and
temporal coherence of these climate trends suggests that warming and drying in the South Atlantic
may be important contributors to the significant declines in streamflow that have been observed.
Prior to 1970, streamflow trends in the South Atlantic showed significant decreases throughout
the northern portions of our study area, and few significant increases in the southern portion of the
study area (Figure 2.3B). Temperatures declined significantly during this time period throughout the
region (Figure 2.5B). Significant precipitation trends, though sparse, paralleled the spatial pattern of
streamflow trends with decreasing precipitation in the north and increasing precipitation in the
south (Figure 2.7B). Thus, the directionality and spatial distributions of streamflow trends were
co-located in space with precipitation trends that favor the directionality of observed streamflow
changes.
2.6.1 Atlantic Multi-decadal Oscillation Climatic Driver
The abrupt change in precipitation and streamflow in the 1970’s has been noted throughout
the conterminous United States (Krakauer and Fung, 2008; McCabe and Wolock, 2002). The cause of
this shift is not known, although some studies have hypothesized that the change in streamflow is
due to a change in precipitation patterns brought about by multiple factors, including a phase shift
in the Atlantic Multi-decadal Oscillation (AMO; Krauker and Fund, 2008; Baines and Folland, 2007;
Enfield, 2001). The AMO is a low frequency climate pattern linked to oscillations in sea surface
temperature.
term trends from low frequency climatic variation. The AMO switched from a warm phase to a cold
phase around 1970 (McCabe et al., 2004), which corresponds to the timing of observed trends
transitioning between the Mid- and Late-20th Century. The cooler temperatures during the Mid-20th
Century (Figure 2.6C) are anticipated with the AMO warm phase because of its impact on the North
Atlantic Oscillation (NAO; pressure rather than temperature). During the AMO warm phase, the NAO
pulls the jet stream farther south and introduces cool air into the South Atlantic, particularly during
the winter months (Figure 2.6C; D’Aleo, 2008). The AMO warm phase is often associated with a
decrease in summer precipitation for the conterminous U.S. (McCabe et al., 2008); which we
observed in July during the Mid-20th Century (Figure 2.8C). In 1995, the AMO returned to a warm
phase and is currently favoring a return to drier summer conditions in the South Atlantic.
The temporal coincidence of a climate transition with a regional shift in streamflow trends
indicates that discrete changes in climate regimes can have important effects on surface water
resources in the South Atlantic. However, if the AMO is largely responsible for driving the general
climate observed in the South Atlantic, then water resource managers have a better sense for what
streamflow is likely to do during certain months over several decades. For example, warmer winter
conditions (Figure 2.6) and less rain in the spring (Figure 2.8) resulted in decreased streamflow
during the winter and spring recharge period (Figure 2.4). On the other hand, the reality of
AMO-driven climate and streamflow requires that we have the capacity and water infrastructure
necessary for handling abrupt transitions between long periods of predominantly wet or dry
conditions in the South Atlantic.
2.6.2 National Studies
The prevalence of significant decreasing precipitation and streamflow trends in the South
follow the predominant trends of increasing streamflow. Regional studies from the northeast US
have contradicted national scale studies, reporting decreasing streamflow trends since 1970 (Table
2.4; Hayhoe et al. 2007; Zhu and Day, 2005). Discrepancies between national and regional scale
studies reflect the high spatial and temporal variability of climate and hydrology, as well as the
sensitivity of trends to the time period assessed. As the spatial scale of a study increases, it becomes
more difficult to ensure that there are not factors (such as we observed over larger time periods in
the South Atlantic) that are obscuring important trends. This implies the necessity of conducting
studies at the scale of water management strategies being pursued.
2.6.3 Anthropogenic Factors
Anthropogenic activities can also have a variety of effects on streamflow, including water
withdrawals, reservoir operation, and land use change. These changes greatly complicate the
relationship between climate and streamflow. For example, in Figure 2.3A there is an outlier in NC
where streamflow continuously increased from 1934-2005 regardless of climate trends. Closer
examination revealed that this stream is located in a small, rapidly urbanizing basin (38 km2). Over
67% of the basin was classified as developed in 2006. Urbanization is considered one of the most
dominant factors in altering streamflow and often results in increased streamflow after rain events
due to increased impervious surface, but it can also result in an overall decrease in streamflow as
groundwater recharge is inhibited (Hodgkin et al., 2007; Dewalle et al., 2000).
Lettenmaier et al. (1994) proposed that where streamflow does not follow climatic indicators,
the cause is likely anthropogenic. The South Atlantic has been exposed to population increases over
evidence based on data from the HCDN network that anthropogenic activities are systematically
altering streamflow in the South Atlantic.
2.6.4 Implications for Water Management and Policy
Water infrastructure and institutions in the South Atlantic have been constructed with a
foundational assumption that climate, and therefore streamflow, is stationary (Hirsch 2011;
Frederick and Gleick, 1999). However, the last few decades have challenged that assumption. Our
findings indicate that stationarity is the exception and not the rule in the South Atlantic. Moreover,
not only does streamflow commonly exhibit gradual drift over long periods of time, but also these
trends can be punctuated by abrupt and large shifts associated with changes in climate regime. Thus
managers and water infrastructure must be capable of handling these very different types of change
in coming decades.
The presence of both persistent wetter and drier periods has important implications for water
resource. For instance, Enfield et al. (2001) pointed out that streamflow in Florida to Lake
Okeechobee was 40% higher from 1930-1964 than 1964-1994, representing a different hydrologic
state that translated into a near complete reversal in water management priorities as they shifted
from flood to drought management. While our annual streamflow changes are not of this
magnitude, it is clear that there are periods of wetter and drier streamflow resulting in the need for
accordant management practices, such as conservation prioritization, to shift over multi-decadal
time periods.
Water managers in the South Atlantic are becoming more efficient in managing the immediate
juxtaposition of wet months (e.g. recharging reservoirs in the winter) to dry months (e.g. mandatory
water restrictions in the summer) within a year. However, the institutional capacity to manage
conservation, and not become ensconced in prioritizing one strategy over the other. Undoubtedly,
water resource managers are faced with significant distribution challenges associated with changing
streamflow conditions. Our results show the flexibility to adapt to alternate, juxtaposed hydrologic
conditions that may persist for several years is needed.
2.7 Acknowledgements
This study was funded by the Morris K. Udall Dissertation Completion Fellowship and further
supported by the National Periship Award to Patterson. This work was also supported in part by an
IPA from the US Army Corps of Engineers - Institute for Water Resources to Lutz and Doyle. Any
opinions, findings, conclusions, or recommendations expressed in this publication are those of the
author(s) and do not necessarily reflect the views of the Morris K. Udall and Stewart L. Udall
2.8 Tables
Table 2.1: SMK test results for streamflow. The number of significant trends is provided above the average change in streamflow from the start to end of the time period +/- standard deviation (cm). Results are subdivided by HCDN classification.
Number of Sites Significant Increase (cm) Significant Decrease (cm)
HCDN Not HCDN HCDN Not HCDN HCDN Not HCDN
Entire Record
(1934-2005) 26 28
1 0.60±(N/A) 1 1.09±(N/A) 1 -0.50±(N/A) 6 -0.69±(0.20) Mid-20th Century
(1934-1969) 26 28
3 0.73±(0.15) 1 0.83±(N/A) 13 -0.99±-(0.48) 17 -0.80±(0.40) Late 20th Century
(1970-2005) 26 28
0 0 14
-0.96±(0.49)
12 -1.32±(0.76)
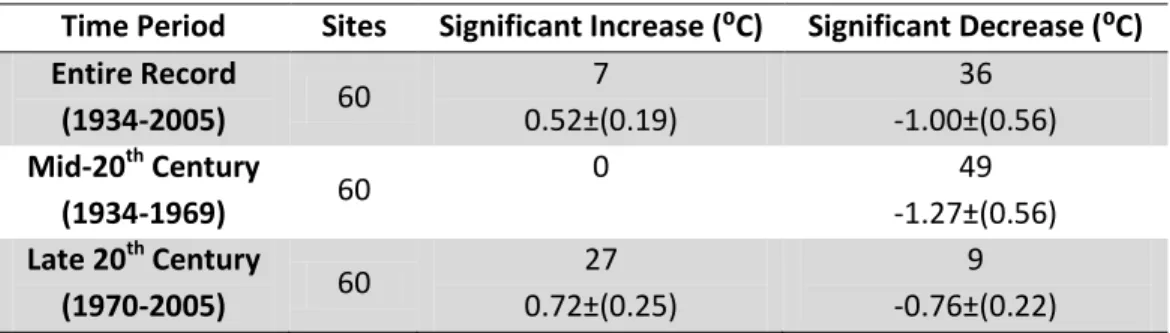
Table 2.2: SMK test results for temperature. The number of significant trends is above the average change in temperature from the start to end of the time period +/- standard deviation (⁰C).
Time Period Sites Significant Increase (⁰C) Significant Decrease (⁰C) Entire Record
(1934-2005) 60
7 0.52±(0.19)
36 -1.00±(0.56) Mid-20th Century
(1934-1969) 60
0 49
-1.27±(0.56) Late 20th Century
(1970-2005) 60
27 0.72±(0.25)
9 -0.76±(0.22)
Table 2.3: SMK test results for precipitation. The number of significant trends is provided above the average change in precipitation from the start to end of the time period +/- standard deviation (cm).
Time Period Sites Significant Increase (cm) Significant Decrease (cm) Entire Record
(1934-2005) 90
8 1.85±(0.73)
2 -1.43±(0.25) Mid-20th Century
(1934-1969) 90
6 1.83±(0.22)
5 -1.77±(0.50) Late 20th Century
(1970-2005) 90
0 8
Table 2.4: Highlighted results from previous streamflow trend studies.
Author Data
Spatial Scale
Temporal Scope
Main Trend
Direction Notes
Andreadis & Lettenmaier (2006) Annual HCDN streamflow
National 1925-2003 Increase Linked to precipitation.
Arrigoni et al. (2010) Daily USGS streamflow Northern Rocky Mountains
1950-2008 None
Cyclical pattern from climate. Anthropogenic factors drove streamflow trends, not climate. Douglas et al. (2000) Annual max and min HCDN streamflow
National 1959-1988 1939-1988
Increase in min and med flow
Trends present in Midwest region of U.S. Present at both time scales. Krakauer & Fung (2008) Annual HCDN streamflow
National 1920-2007 Increase
Most increase due to abrupt shift in 1960’s. Linked to precipitation.
Hayhoe et al. (2007) USGS streamflow Northeast US 1950-2000 1970-1999 Slight increase Slight decrease
Linked to temperature increase and little change in precipitation. Hodgkins et al. (2007) Monthly USGS streamflow Great Lakes
Basin 1915-2004
Low 1955-1970
High 1970-1995 Linked to precipitation.
Lettenmaier et al. (1994)
Monthly HCDN streamflow
National 1948-1988
Increased in Midwest Decreased in
NE
Strong seasonal variation in all variables. Some correlation with precipitation.
Temperature increased.
Lins & Slack (2005)
Annual min, med and max HCDN streamflow
National 1940-1999
Increase in low to med. flows
in central US
No systematic monthly trends. Linked to
precipitation. SE-Gulf had noticeable differences with more decreasing trends.
McCabe & Wolock (2002)
Annual min, med & max
HCDN streamflow
National 1941-1999 Increase in min and med flow
Step increase ca. 1970. Linked to precipitation.
Small et al. (2006)
HCDN
streamflow Eastern US 1948-1997
Increase in min and med flow
Linked to increase in fall precipitation Wang & Hejazi (2011) International Model Parameter Estimation Experiment
National 1948-2003
Increase (largely in Midwest)
Climate linked to increasing streamflow. Anthropogenic factors have spatially heterogeneous impacts.
Zhu & Day (2005)
USGS
streamflow PA 1971-2001 Decrease
Greatest decrease in June, July, and December.
2.9 Figures
2.10 Literature Cited
Andreadis, K.M. and D.P. Lettenmaier. 2006. Trends in 20th Century Drought over the continental United States. Geophysical Research Letters 33 (L10403), doi: 10.1029/2006GL025711.
Anselin, L. 1995.Local Indicators of Spatial Association – LISA. Geographical Analysis 27 (2): 93-115.
Arrigoni, A.S., M.C. Greenwood, and J.N. Moore. 2010. Relative impact of anthropogenic modifications versus climate change on the natural flow regimes of river in the Northern Rocky Mountains, United States. Water Resources Research 46 (W12542), doi:10.1029/2010WR009162.
Band, L.A. and D. Salveson (Eds). 2009. Climate Change Committee Report. UNC Institute for the Environment at the University of North Carolina, Chapel Hill. pp. 197.
Baines, P.G. and C.K. Folland. 2007. Evidence for a rapid global climate shift across the late 1960’s.
Journal of Climate 20: 2721-2744, doi: 10.1175/JCLI4177.1
Blowe, B., S. Harrell, F. Akhtar, C. Cannady, and J. Crews-Klein. 2006. Water 2030 Series. The North Carolina Rural Center.http://www.ncruralcenter.org Last Accessed September 2011.
D’Aleo, J. 2008. The Atlantic Multidecadal Oscillation. Intellicast.com – The Authority in Expert Weather. http://www.intellicast.com/Community/Content.aspx?a=127. Last Accessed August 5, 2011.
DeWalle, D.R., B.R. Swistock, T.E. Johnson, and K.J. McGuire. 2000. Potential effects of climate change and urbanization on mean annual streamflow in the United States. Water Resources Research 36: 2655-2665.
Douglas, E.M., R.M. Vogel, and C.N. Kroll. 2000. Trends in floods and low flows in the United States: impact of spatial correlation. Journal of Hydrology 240: 90-105.
Campbell, J.L., C.T. Driscoll, A. Pourmokhatarian, and K. Hayhoe. 2011. Streamflow responses to past and projected future changes in climate at the Hubbard Brooke Experimental Forest, New Hampshire, United States. Water Resources Research 47 (W02514), doi: 10.1029/2010WR009438.
Claessens, L., C. Hopkinson, E. Rastetter, and J. Vallino. 2006. Effect of historical changes in land use and climate on the water budget of an urbanizing watershed. Water Resources Research 42 (W03426), doi: 10.1029/205WR004131.
Enfield, D.B., A.M. Mestas-Nuñez, and P.J. Trimble. 2001. The Atlantic multidecadal oscillation and its relation to rainfall and river flows in the continental U.S. Geophysical Research Letters 28 (10): 2077-2080.
Frederick, K.D. and P.H. Gleick. 1999. Water and Global Climate Change: Potential Impacts on U.S. Water Resources. Pew Center on Global Climate Change. Washington, D.C.