State Street Associates
State Street Securities Finance
MAY 2013
Asset Allocation vs. Securities Lending:
Comparing Risk-Adjusted Returns
Building upon the risk-based framework established in our previous paper, “Securities Lending: Assessing Portfolio Risk and Return,” we seek to compare the incremental impact of an institutional investor’s asset allocation decision to an investor’s decision to lend securities and invest the cash collateral received in a chosen reinvestment portfolio. We model both normal and extreme market conditions using historical data and conclude that securities lending may be an efficient addition to an investor’s broader portfolio management process.
State Street Associates
State Street Global Markets’ research partnership with renowned academics, State Street Associates, is creating a full spectrum of proprietary investor behavior indicators, risk indices, inflation series and advisory research services. State Street Global Markets State Street Global Markets provides specialized research, trading, securities lending and innovative portfolio strategies to owners and managers of institutional assets.
Authors – State Street Associates David Chua, PhD
dbchua@statestreet.com
Hans-Christian Lüdemann, PhD hluedemann@statestreet.com
Authors – State Street Securities Finance Leslie Levine, CFA
lwlevine@statestreet.com
Crossan Barnes crbarnes@statestreet.com
Glenn Horner, CFA, FRM ghorner@statestreet.com
Contents
Executive Summary p. 3
Risk and Reward: Asset Reallocation vs. Securities Lending p. 4
Summary p. 10
EXECUTIVE SUMMARY
In our first paper, “Securities Lending: Assessing Portfolio Risk and Return,” we delved into the concept of loan portfolio balance-at-risk. We also examined overall lending program risk stemming from the relationship of the loan portfolio and the maturity and asset performance of a lender’s cash collateral investment portfolio. During the height of the global financial crisis, broadly declining market values and deleveraging within the financial markets required the return of substantial amounts of cash collateral to borrowers. If a lender lacked sufficient liquidity in its reinvestment portfolio, it may have needed to sell securities that had declined in value and ultimately realize a loss. We hope to identify a means to better measure the liquidity risk for today’s lenders, under both normal and extreme conditions.
In this paper, we look at securities lending in the context of the overall management of the underlying investment portfolio. We provide risk-return metrics for securities lending and compare them to those of other portfolio management options that an institutional investor may consider in constructing its optimal portfolio. This paper also builds upon several concepts introduced in the prior paper. We calculate the potential risk-adjusted return of a securities lending portfolio and compare it to the risk-adjusted return of various asset allocation options within a sample underlying investment portfolio.
Ultimately, our results portray securities lending as more efficient on the risk-return spectrum than the sample asset reallocations considered. We readily acknowledge, however, that our results are based on the limited inputs used in our model and, more importantly, that an investor’s asset allocation decision is the foundation for all other investment decisions. Lending one’s securities (or not) will always be a downstream decision to an investor’s initial investment choices. Further, while we find the risk-return metrics for securities lending compelling, there are inherent constraints to the potential upside for lending risk-returns — driven by asset demand, investment portfolio turnover, regulatory limitations and other factors. We invite you to view the analysis critically. Our ultimate goal is to invite a review of the potential benefits and risks of securities lending in a similar way to that of other investment opportunities.
RISK AND REWARD: ASSET REALLOCATION VS. SECURITIES LENDING
To assess securities lending as an investment activity relative to other investment options available to institutional investors, we compare:
a) the incremental impact of sample asset reallocations into higher-return, riskier assets, to
b) the incremental impact of leaving the asset allocation unchanged, lending securities versus cash collateral, and reinvesting the collateral.
As we structure an analytical framework through which to draw some comparative conclusions about securities lending risk and return, we are mindful of program risks — some readily quantifiable and some not — that bear on the overall assessment, but are not considered here. The most notable one, borrower default risk, is typically managed through counterparty assessment, the intake of excess collateral for securities loaned and, for most lenders using an agent, borrower default indemnification. In our previous paper, “Securities Lending: Assessing Portfolio Risk and Return,” we established a risk-based framework for assessing lending returns with a particular emphasis on loan balances and collateral liquidity management. That framework serves as a foundation for our present risk-adjusted return analysis.
Our focus is on lending securities versus cash collateral, which represents the majority of global activity, though collateral preferences and requirements vary regionally. Cash collateral is generally less well-correlated with the loaned securities than most forms of non-cash collateral. The lesser correlation actually assists here by presenting a more conservative return/risk review.
To compare the incremental impact of sample asset reallocations versus engaging in securities lending, we outline a hypothetical investment portfolio for a large institutional investor. Figure 1 shows the hypothetical portfolio’s asset allocation and expected returns for each asset class. We use this portfolio as an illustrative example throughout our analysis.1 We use daily historical return data to compute simulated time series of historical returns for this portfolio, assuming that the portfolio is rebalanced back to its target asset allocation on the last trading day of each calendar month.
Figure 1: Sample Investment Portfolio Asset Allocation and Expected Returns
Source: State Street Global Markets
1
In the Appendix, we repeat our analysis for a second hypothetical investment portfolio that is more heavily weighted toward fixed income assets. Each of the figures in the body of the paper are recalculated for the alternative portfolio and shown in Figures A-2 through A-8.
Asset Allocation Expected Return
US Equities 25% 8.0%
EAFE Equities 25% 8.0%
EM Equities 10% 10.0%
US Gov't Bonds 30% 2.5%
US Corporate Bonds 10% 4.0%
Incremental Risk and Returns from Investment Portfolio Reallocations
We consider three investment portfolio reallocations into higher-risk assets that an institutional investor could make to try to boost returns. These sample reallocations, listed in Figure 2, reflect marginal changes to the original asset allocation presented in Figure 1.
Figure 2: Sample Asset Reallocations
Source: State Street Global Markets
For each of the resulting newly reallocated portfolios, we compute a simulated time series of historical returns. From the time series of the newly reallocated portfolios and those of the original portfolio, we assess the incremental risk relative to the original portfolio introduced by each sample asset reallocation using both:
a) a mean-variance risk model, computing the standard deviation of the one-month relative returns as a metric for tracking error, to measure risk under the assumption of a normal distribution (i.e., what some might say covers most instances), and
b) an incremental tail-risk model, calculating the 5 percent conditional Value-at-Risk (cVaR), or the mean of the lowest 5 percent of one-month relative returns, to measure potential losses under extreme market conditions.
The relative tracking error, relative tail risk and expected incremental return of the asset reallocations are all shown in Figure 3.
Figure 3: Incremental Risk and Return of Asset Reallocations
Reallocated Amount Reallocation from Reallocation to
Reallocation 1 1.0% US Equities → EM Equities
Reallocation 2 1.0% US Gov't Bonds → US Equities
Reallocation 3 1.0% US Gov't Bonds → EM Equities
Reallocation 1 Reallocation 2 Reallocation 3
Relative Returns 2.0 5.5 7.5
(in Bps, Annualized)
Relative Returns 0.2 0.5 0.6
(in Bps, 1-Month) Relative Risk (in Bps, 1-Month)
Standard Deviation 4.7 5.5 7.7
Tail Risk (5% cVaR) 10.8 14.6 18.4
Incremental Risk and Returns from Lending
Next, we consider the impact of retaining the current asset allocation and utilizing securities lending.
For purposes of this analysis, we assume the entire investment portfolio is lendable and consider a portfolio utilization rate of 15 percent for the sample portfolio. This means that the value of our collateral reinvestment portfolio is approximately 15 percent of the value of the underlying investment portfolio. In Figure 4, we present characteristics of a sample loan portfolio.
We calculate the expected weighted average rebate rate to be paid to borrowers for the securities on loan based on historical asset class return statistics.2 The total earnings from lending securities versus cash collateral are a function of the difference, or spread, between the collateral reinvestment portfolio yield and the weighted average rebate rate for the underlying loans.
Figure 4: Sample Loan Portfolio
Source: State Street Global Markets
We then look at the potential changes in the net asset value unit price of the securities lending collateral reinvestment portfolio, again computing both mean-variance and tail-risk metrics, to assess the risk of lending securities versus cash.
We consider three sample collateral reinvestment portfolios, whose characteristics were first detailed in the appendix of our previous paper, and present several key metrics for each in Figure 5.
2
Representative asset class rebates are described in Figure A-2.
Equities Fixed Incom e
US S&P 500 32.1% US Gov't 21.4%
Russell 2000 10.7% USD Corp. 14.3%
Japan Nikkei 225 8.7%
France CAC 40 3.5%
Australia ASX 50 3.4%
Germ any DAX 3.1%
Spain IBEX 1.3%
Hong Kong Hang Seng 1.1%
Norw ay OBX 0.4%
64.3% 35.7%
Calculated Asset-Weighted Rebate Rate -19.9
Figure 5: Risk and Return of Lending Securities
Collateral Portfolio
Collateral Vehicle Treasury Repo Money Market Fund Enhanced Cash
Collateral Yield 18.6 32.0 41.3
(in Bps, Annualized) Collateral Risk
(1-Month NAV Changes in Bps)
Standard Deviation 0.1 2.2 4.1
Tail Risk (5% cVaR) 0.2 3.9 8.9
Loan Portfolio
Asset-Weighted Rebate Rate -19.9 -19.9 -19.9
(in Bps, Annualized)
Integrated Portfolio
Gross Integrated Spread 38.5 51.8 61.2
(in Bps, Annualized)
Net Integrated Spread 28.9 38.9 45.9
(in Bps, Annualized, 75%/25% Split)
Net Integrated Spread 2.4 3.2 3.8
(in Bps, 1-Month)
Comparing Lending and Investment Portfolio Reallocations
With the information gathered thus far, we compare the various reallocations’ incremental risk and return to the risk and returns from lending and reinvesting cash collateral in each of the three sample collateral portfolios. Mindful that the collateral
reinvestment portfolio is considerably smaller than the investment portfolio, we normalize the difference by expressing return and risk measures in dollar terms in Figure 6.
Figure 6: Lending Securities vs. Reallocating Assets
Total Assumed Portfolio Value $1,000,000
Assumed Utilization 15%
Total Assumed Collateral Portfolio $150,000
Lending Securities
Treasury Repo Money Market Fund Enhanced Cash
Collateral Risk
(1-Month Changes in Collateral NAV)
Standard Deviation $2 $33 $61
Tail Risk (5% cVaR) $2 $58 $133
Net Integrated Spread $36 $49 $57
(1-Month)
Reallocating Assets
Reallocation 1 Reallocation 2 Reallocation 3
Incremental Risk (1-Month Relative Returns)
Standard Deviation $470 $554 $766
Tail Risk (5% cVaR) $1,081 $1,464 $1,842
Incremental Return $17 $46 $63
(1-Month)
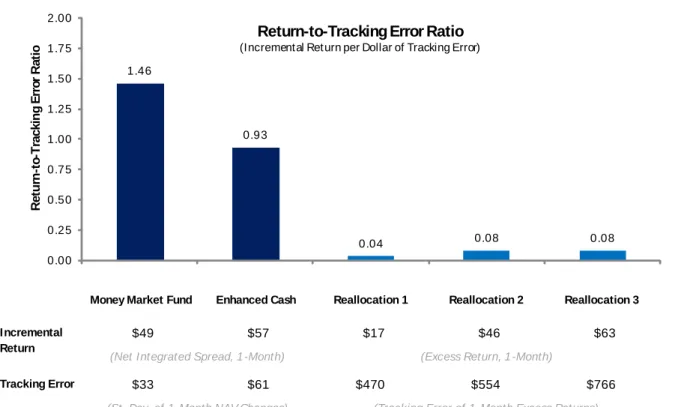
In Figures 7 and 8, we plot the return-to-tracking error and return-to-tail risk ratios of securities lending for two of the reinvestment options and the three sample reallocations.
Figure 7: Return/Risk for Asset Reallocation vs. Securities Lending
Money Market Fund Enhanced Cash Reallocation 1 Reallocation 2 Reallocation 3
$49 $57 $17 $46 $63
$33 $61 $470 $554 $766
So urce: State Street Glo bal M arkets Incremental
Return
Tracking Error
(Excess Return, 1-Month)
(Tracking Error of 1-Month Excess Returns) (Net Integrated Spread, 1-Month)
(St. Dev. of 1-Month NAV Changes) 1.46
0.93
0.04 0.08 0.08
0.00 0.25 0.50 0.75 1.00 1.25 1.50 1.75 2.00 R e tu rn -to -T ra c k in g E rr o r R a ti o
Return-to-Tracking Error Ratio
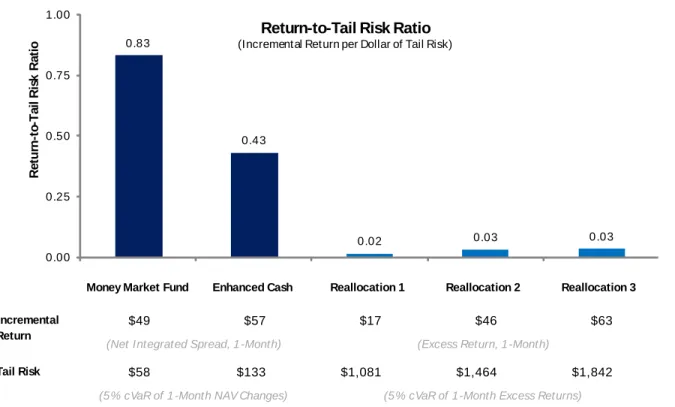
(Incremental Return per Dollar of Tracking Error)Figure 8: Return/Tail Risk for Asset Reallocation vs. Securities Lending
Whether considering risk from a mean-variance (tracking error) or tail-risk (cVaR) perspective, the comparative result is similar. For the sample loan portfolio, the relative return from securities lending and reinvesting the cash collateral received in either the money market fund or enhanced cash fund provides a superior incremental return for the relative risk incurred when compared to each of the reallocation options presented. It is important to consider that there is a limit to how much securities lending revenue can be earned from a given portfolio, and it is likely less than what can be earned by a modest reallocation to higher expected return/risk assets. In this respect, the lending of portfolio securities is really a complementary source of revenue, and an efficient one, and should be considered as one possible tool in the portfolio optimization process.
SUMMARY
For an institutional investor to decide whether or not to engage in securities lending, we believe it is important for the investor to view its risk and return trade-offs relative to other available asset management options. The preceding examples use empirical data for a sample investment and loan portfolio and are meant to provide a framework to contextualize the risk and returns in securities lending. Each investor portfolio’s expected performance and actual performance will likely differ from these sample portfolios considered, based on the underlying assets owned, and it is advisable to look at the specific portfolio when assessing the potential value of a securities lending program.
Based on our assumptions and calculations for the time period covered, we find that lending securities and reinvesting cash collateral offers an attractive risk/return opportunity — whether we use tracking-error or tail-risk metrics — compared to the sample asset reallocations presented. When guided by an experienced agent lender or within a controlled proprietary lending program managed within the construct of an asset/liability framework, securities lending may serve as an efficient adjunct to existing investment management activity.
Money Market Fund Enhanced Cash Reallocation 1 Reallocation 2 Reallocation 3
$49 $57 $17 $46 $63
$58 $133 $1,081 $1,464 $1,842
So urce: State Street Glo bal M arkets Tail Risk
Incremental Return
(Net Integrated Spread, 1-Month) (Excess Return, 1-Month)
(5% cVaR of 1-Month NAV Changes) (5% cVaR of 1-Month Excess Returns)
0.83
0.43
0.02 0.03 0.03
0.00 0.25 0.50 0.75 1.00 R e tu rn -to -T a il R is k R a ti o
Return-to-Tail Risk Ratio
(Incremental Return per Dollar of Tail Risk)APPENDIX Rebate Rates
Figure A-1 shows the rebate rates used to calculate the asset-weighted net rebate.
Figure A-1: Sample Rebate Rates
Source: State Street Global Markets
Implications of Alternative Investment Portfolios
Different investment portfolios will result in varying loan portfolios. We include here in the Appendix an analysis similar to that in the body of the paper, where we focus on a primarily equity-based portfolio, for an investment portfolio more heavily weighted with fixed income assets. Individual investment and loan portfolios will have unique risk-return characteristics. Our goal is to provide a framework by which a potential lender may better understand and assess its specific profile.
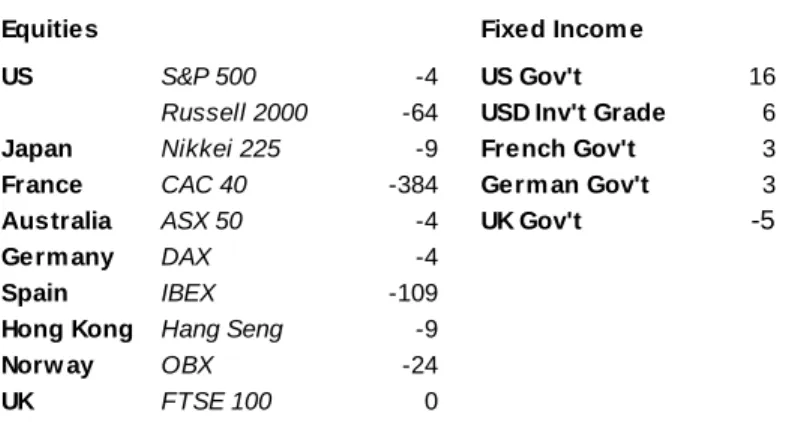
In Figure A-2, we describe the composition of an alternative investment portfolio with a substantial allocation to fixed income.
Figure A-2: Alternative Investment Portfolio
Equities Fixed Incom e
US S&P 500 -4 US Gov't 16
Russell 2000 -64 USD Inv't Grade 6
Japan Nikkei 225 -9 French Gov't 3
France CAC 40 -384 Germ an Gov't 3
Australia ASX 50 -4 UK Gov't -5
Germ any DAX -4
Spain IBEX -109
Hong Kong Hang Seng -9
Norw ay OBX -24
UK FTSE 100 0
All rebate rates in basis points.
Asset Allocation Expected Return
US Equities 9% 8.0%
EAFE Equities 9% 8.0%
EM Equities 2% 10.0%
US Gov't Bonds 35% 2.5%
French Gov't Bonds 15% 2.5%
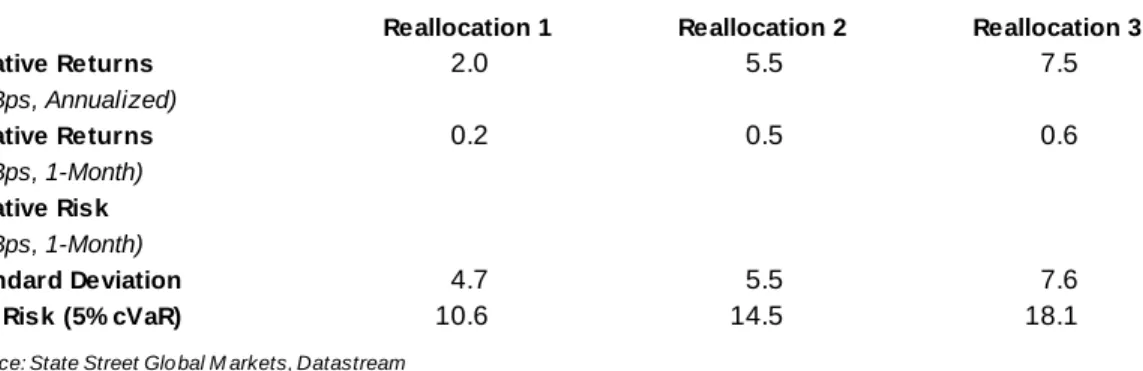
In Figure A-3, we list the incremental risk and return metrics of reallocating assets according to Figure 2, for an investor who holds the fixed-income heavy alternative investment portfolio described in Figure A-2. Incremental risk and return is largely determined by the relative reallocation, which remains unchanged from the portfolio described in Figure 3. There are, therefore, only minor differences in the risk metrics of Figure A-3 and Figure 3.
Figure A-3: Risk and Return of Reallocating Assets, Alternative Investment Portfolio
In Figure A-4, we list the composition of a sample loan portfolio associated with an investment portfolio that is more heavily allocated to fixed income.
Figure A-4: Sample Loan Portfolio Associated with the Alternative Investment Portfolio
Reallocation 1 Reallocation 2 Reallocation 3
Relative Returns 2.0 5.5 7.5
(in Bps, Annualized)
Relative Returns 0.2 0.5 0.6
(in Bps, 1-Month) Relative Risk (in Bps, 1-Month)
Standard Deviation 4.7 5.5 7.6
Tail Risk (5% cVaR) 10.6 14.5 18.1
So urce: State Street Glo bal M arkets, Datastream
Equities Fixed Incom e
US S&P 500 10.0% US Gov't 40.0%
France CAC 40 3.3% French Gov't 13.3%
Germ any DAX 3.3% Germ an Gov't 13.3%
UK FTSE 100 3.3% UK Gov't 13.3%
20.0% 80.0%
Calculated Asset-Weighted Rebate Rate -6.3
In Figure A-5, we list the incremental risk and return metrics of lending securities for an investor who lends the sample loan portfolio in Figure A-4. It differs from the data in Figure 5 only in the lower (negative) rebate rates associated with these fixed income assets. Here, this means that borrowers pay less to lenders for borrowing fixed income assets than for borrowing the equity-heavy portfolio in Figure 5, and the spread lenders can earn is lower.
Figure A-5: Risk and Return of Lending Securities, Alternative Loan Portfolio
Collateral Portfolio
Collateral Vehicle Treasury Repo Money Market Fund Enhanced Cash
Collateral Yield 18.6 32.0 41.3
(in Bps, Annualized) Collateral Risk
(1-Month NAV Changes in Bps)
Standard Deviation 0.1 2.2 4.1
Tail Risk (5% cVaR) 0.2 3.9 8.9
Loan Portfolio
Asset-Weighted Rebate Rate -6.3 -6.3 -6.3
(in Bps, Annualized)
Integrated Portfolio
Gross Integrated Spread 24.9 38.3 47.6
(in Bps, Annualized)
Net Integrated Spread 18.7 28.7 35.7
(in Bps, Annualized, 75%/25% Split)
Net Integrated Spread 1.6 2.4 3.0
(in Bps, 1-Month)
In Figure A-6, we compare lending securities and reallocating assets for the case of the alternative investment and loan portfolios.
Figure A-6: Lending Securities vs. Reallocating Assets, Alternative Investment and Loan Portfolios
Total Assum ed Portfolio Value $1,000,000
Assum ed Utilization 15%
Total Assum ed Collateral Portfolio $150,000
Lending Securities
Treasury Repo Money Market Fund Enhanced Cash
Collateral Risk
(1-Month Changes in Collateral NAV)
Standard Deviation $2 $33 $61
Tail Risk (5% cVaR) $2 $58 $133
Net Integrated Spread $23 $36 $45
(1-Month)
Reallocating Assets
Reallocation 1 Reallocation 2 Reallocation 3
Incremental Risk (1-Month Relative Returns)
Standard Deviation $467 $551 $763
Tail Risk (5% cVaR) $1,062 $1,450 $1,811
Increm ental Return $17 $46 $63
(1-Month)
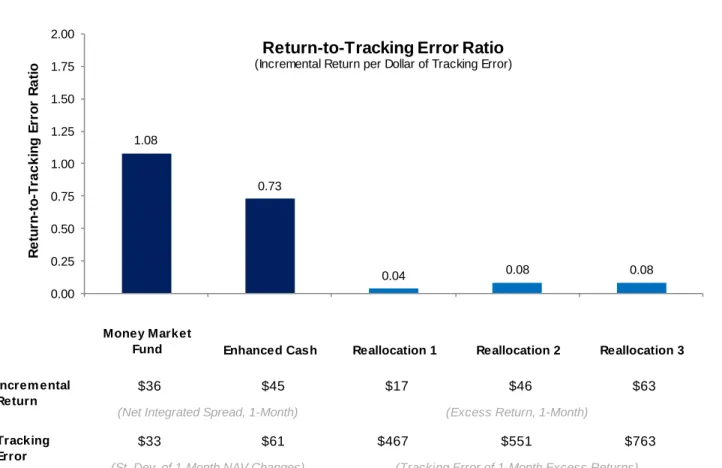
In Figure A-7, we compare the return-to-tracking error ratios for lending securities and reallocating assets for the case of the alternative investment and loan portfolios.
Figure A-7: Loan Portfolio
Money Market
Fund Enhanced Cash Reallocation 1 Reallocation 2 Reallocation 3
$36 $45 $17 $46 $63
$33 $61 $467 $551 $763
So urce: State Street Glo bal M arkets
Increm ental Return
(Net Integrated Spread, 1-Month) (Excess Return, 1-Month)
Tracking Error
(St. Dev. of 1-Month NAV Changes) (Tracking Error of 1-Month Excess Returns)
1.08
0.73
0.04 0.08 0.08
0.00 0.25 0.50 0.75 1.00 1.25 1.50 1.75 2.00 R e tu rn -to -T ra c k in g E rr o r R a ti o
Return-to-Tracking Error Ratio
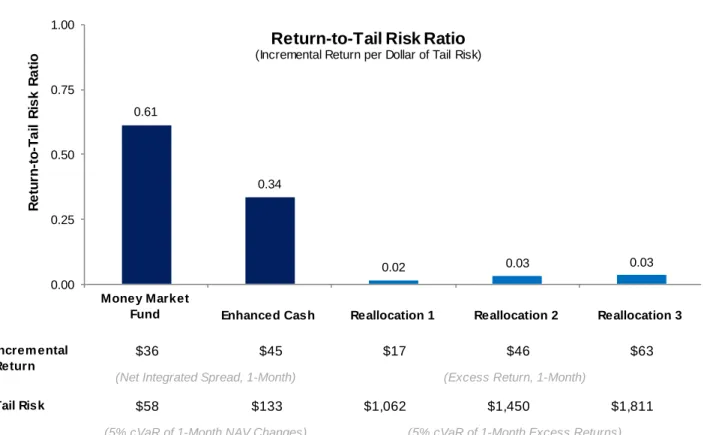
(Incremental Return per Dollar of Tracking Error)In Figure A-8, we compare the return-to-tail risk ratios for lending securities and reallocating assets for the case of the alternative investment and loan portfolios.
Figure A-8: Loan Portfolio
Money Market
Fund Enhanced Cash Reallocation 1 Reallocation 2 Reallocation 3
$36 $45 $17 $46 $63
$58 $133 $1,062 $1,450 $1,811
So urce: State Street Glo bal M arkets
Increm ental Return
(Net Integrated Spread, 1-Month) (Excess Return, 1-Month)
Tail Risk
(5% cVaR of 1-Month NAV Changes) (5% cVaR of 1-Month Excess Returns)
0.61
0.34
0.02 0.03 0.03
0.00 0.25 0.50 0.75 1.00
R
e
tu
rn
-to
-T
a
il
R
is
k
R
a
ti
o
Return-to-Tail Risk Ratio
(Incremental Return per Dollar of Tail Risk)NOTES AND DEFINITIONS
State Street Global Markets is the marketing name and a registered trademark of State Street Corporation used for its financial markets businesses. State Street Associates is a research partnership between State Street Global Markets and academia and under which this communication is produced. State Street Associates is a registered trademark of State Street Corporation. The products and services outlined in this document are offered through either State Street Global Markets International Limi ted, State Street Bank Europe Limited and State Street Bank and Trust Company, London Branch, all of which are authorized and regulated by the Financial Conduct Authority and Prudential Regulation Authority, and/or State Street Bank GmbH, London Branch, which is authorized and regulated by the Deutsche Bundesbank and the German Financial Supervisory Authority (BaFin) and subject to limited regulation by the Financial Conduct Authority, details of which are available from us on request. Please note, certain foreign exchange business (spot and certain forward transactions) are not regulated by the Financial Conduct Authority nor Prudential Regulation Authority. This communication is not intended for and must not be provided to retail investors. This communication is being distributed in the United States by State Street Bank and Trust Company.
Investing involves risk including the risk of loss of principal. Asset allocation may be used in an effort to manage risk and enhance returns. It does not, however, guarantee a profit or protect against loss. Diversification does not ensure a profit or guarantee against loss. Any performance figures contained herein are provided on a gross of fees basis only, but net of administrative costs. The performance figures do not reflect the deduction of advisory or other fees which could reduce the return. Past performance is not a guarantee of future results. Clients should be aware of the risk of trading foreign exchange.
Generally, among asset classes, stocks are more volatile than bonds or short-term instruments. Government bonds and corporate bonds have more moderate short-term price fluctuations than stocks, but provide lower potential long-term returns. U.S. Treasury Bills maintain a stable value if held to maturity, but returns are generally only slightly above the inflation rate. Although bonds generally present less short-term risk and volatility risk than stocks, bonds contain interest rate risks; the risk of issuer default; issuer credit risk; liquidity risk; and inflation risk.
The information provided does not constitute investment advice and is not a solicitation to buy or sell securities. It does not take into account any investor’'s particular investment objectives, strategies or tax status. All material has been obtained from sources believed to be reliable but we make no representation or warranty as to its accuracy and you should not place any reliance on this information. We, our affiliated companies and our and their directors and employees make no representation that the information and opinions contained in this communication comply with local accounting standards or are accurate, complete or up to date and hereby exclude all warranties, conditions and other terms, whether express or implied, in relation to such information and opinions and accept no liability, whether arising in contract, tort (including negligence) or for breach of statutory duty, misrepresentation or otherwise, for any losses, liabilities, damages, expenses or costs arising from or connected with this communication and the information and opinions expressed herein, provided, however that nothing herein shall limit or exclude liability for fraud or for any other liability to the extent that the same cannot be limited or excluded by applicable law. We also do not undertake, and are under no obligation, to update or keep current the information or opinions contained in this communication to account for future events.
You may only use and copy this communication for internal purposes and may not forward, amend or distribute the communication outside your immediate organization without our prior written consent. These terms are subject to any agreement between us governing the provision of the communication. This communication is not i ntended for distribution to, and may not be relied upon by, any person or entity in any jurisdiction or country where such distribution or use would be contrary to applicable law or regulation.
Japan. This communication is disseminated in Japan by State Street Global Markets Japan Limited, which is regulated by the Financial Services Agency of Japan as a financial instruments firm.
Hong Kong. This communication is made available in Hong Kong by State Street Bank and Trust Company, which accepts responsibility for its contents, and is intended for distribution to professional investors only (as defined in the Securities and Futures Ordinance). Australia. This communication is being distributed in Australia by State Street Bank and Trust Company ABN 70