Since the appearance of Rotter’s locus of control questionnaire (1966), called the Internal-External Locus of Control Scale (I-E Scale), numerous other instruments have been published. These instruments vary from general to highly specific. Some of these instruments are intended for children and others for adults. However, they are all concerned with the construct of “locus of control”. This construct was created by Rotter and pertains to a person’s expectation of reinforcement of his/her behaviour, arising from the social environment. It is therefore theoretically based on social learning theory (Mischel, 1986). Rotter (1966) distinguished between two different orientations in people, namely an internal control orientation and an external control orientation. People with an internal control orientation are convinced that the reinforcement of their behaviour depends on their own achievements, abilities and dedication, whereas people with an external control orientation believe that random or fortuitous events, fate, Lady Luck and certain influential people are responsible for their behaviour.
The most well-known scales in this regard are Rotter’s Internal-External Locus of Control Scale, Wallston’s Health Locus of Control Scale (Wallston, Wallston, Kaplin & Maides, 1976), Wallston’s Multidimensional Health Locus of Control Scale (Wallston, Wallston & De Vellis, 1978), the Nowicki-Strickland Locus of Control Scale (1973), Levenson’s Multiple Dimension Locus of Control Scale (1974), the Economic Locus of Control Scale of Furnham (1986) and the Internal Control Index of Duttweiler (1984).
Of the said scales, Rotter’s I-E Scale is used most frequently in the USA (69%), whereas the Nowicki-Strickland Scale as well as the Multiple Dimension Locus of Control Scale of Levenson are used the least – 7% and 4% respectively (Procuik & Lussier, 1975).
The Health Locus of Control Scale, the Multidimensional Health Locus of Control Scale and the Economic Locus of Control Scale are well-developed scales with acceptable reliabilities, but they are too specific for general use.
The scales of Rotter and Duttweiler are promising scales from a contentpoint of view, but they are both poorly developed from a psychometric point of view. These scales will now be briefly discussed.
The single most important problem regarding Rotter’s I-E Scale is the fact that the forced choice item-format leads to ipsative measurement, while the user of the instrument wants to use it in a normative way. In essence, there is nothing wrong with ipsative measures, but the users of such instruments must be fully aware of the limitations thereof.
Ipsative measures can be used successfully to determine the relative strength of drives intra-individually, but not to determine inter-individual differences, for which normative measures are required. Clemans (1966, p. 52) states this as follows: “Ipsative scores are relative scores. It is quite possible that a person obtaining a low ipsative score on a particular trait actually possesses more of the characteristics in question than a person obtaining a much higher ipsative score. It is imperative that users of ipsative variables interpret them in the relative sense only.”
Paired comparisons, multiple ranks, forced-choice formats and certain electro-physiological measures, where the instruments are calibrated for each person separately, usually lead to ipsative measurement.
Ipsative measures cannot automatically be subjected to item analysis and factor analysis. If ipsative measures are intercorrelated, more than half of the correlations will be negativeand many values will be close to zero (Clemans, 1966, pp. 3, 38 and 51). This will result in a distortion of the factor structure. Tucker (1956, p. 1) explained the problem as follows: The direct factor analysis approach (termed the R-technique by Stephenson and Cattell) has been properly applied to those measures for which the scale of measurement is consistent for each variableover the population of people. Such measures are termed “normative”, and may be illustrated by test scores. The obverse, or Q-technique, factor analysis approach has
JOHANN M SCHEPERS
Programme in Industrial Psychology Department of Human Resource Management
University of Johannesburg
ABSTRACT
The primary objective of the study was to construct a normativescale of locus of control for use with students and adults. A corollary of the study was to establish the personality, interest and cognitive correlates of locus of control. Conceptually the instrument is based on attribution theory and on social learning theory. The first edition of the Locus of Control Inventory (LCI) was applied to 356 first-year university students during 1994. A factor analysis of the 65 items of the inventory yielded threefactors. The factors were interpreted as Autonomy, Internal Control and External Control. Three scales, corresponding to the three factors, were constructed, and yielded reliability coefficients of 0,80; 0,77 and 0,81 respectively. Following this the cognitive, interest and personality correlatesof the LCI were determined. The implications of the findings are discussed.
OPSOMMING
Die hoofdoel van die studie was die konstruksie van ’n normatieweskaal van lokus van beheer vir gebruik met studente en volwassenes. ’n Newe-doelwit van die studie was om die persoonlikheids-, belangstellings- en kognitiewe korrelate van lokus van beheer te bepaal. Konseptueel is die instrument op attribusieteorie en sosiale-leerteorie gebaseer. Die eerste-uitgawe van die Lokus van Beheervraelys (LvB) is op 356 eerstejaaruniversiteitstudente toegepas gedurende 1994. ’n Faktorontleding van die 65 items van die vraelys is gedoen en het driefaktore opgelewer. Die faktore is as Outonomie, Interne Beheer en Eksterne Beheer geïnterpreteer. Voorts is drie skale wat ooreenstem met die drie faktore, gekonstrueer en het betroubaarhede van 0,80; 0,77 en 0,81, onderskeidelik, opgelewer. Vervolgens is die kognitiewe, belangstellings- en persoonlikheidskorrelate van die LvB bepaal. Die implikasies van die be-vindinge word bespreek.
THE CONSTRUCTION OF A NORMATIVE
SCALE OF LOCUS OF CONTROL
Requests for copies should be addressed to: JM Schepers, [email protected]
been properly applied to “ipsative” type measures for which the scale of measurement is consistent for each personover the population of observations …. Intercorrelating variables involving ipsative measurement implies the use of a double centered score matrix. Similarly, intercorrelating individuals over observations made by normative measurement implies use of a double centered score matrix. Use of the traditional factor analysis technique involving communalities, however, is not appropriate.
Tucker (1956) developed a special factor analytical technique for this purpose. It is, however, less well known than the standard techniques and not available in packages such as SAS, SPSS and BMDP.
Various attempts to factor analyse Rotter’s I-E Scale were doomed to failure because inappropriate factor analytical techniqueswere used: these include the studies of Rotter (1966), Franklin (1963), Mirels (1970), Abramowitz (1973) and Erwee (1986). However, Collins (1974) was more successful. First, he converted the 23 pairs of the I-E Scale into 46 items with a Likert-format. Then he added 42 items with the connotation that “it depends on the situation”. This scale, comprising 88 items, was then applied to 300 undergraduate students. The 46 Likert-format items were then subjected to a principal factor analysis. There were six eigenvalues greater than unity, but only four factors were rotated. The four-factor solution, with a Varimax rotation, produced a fairly neat simple structure. In the light of his four-factor-solution, Collins reached the following conclusion: “A respondent may score external on the Rotter Internal-External Scale because he believes (a) the world is difficult, (b) the world is unjust, (c) the world is governed by luck, or (d) the world is politically unresponsive”. However, it cannot be said with certainty that Collins’ four-factor-solution represents four factors. It can also be four clustersloading on a single factor.
Duttweiler’s Scale (1984) has a good theoretical basis, but its statistical analysis is questionable: she used an intensity scale, but the scale units are not equal. In fact, it is an ordinal scale. She gave no indication of the number of items with which she began, but indicated that she ended with 28 items after item analysis and factor analysis. It seems that she conducted an item analysis with all the items without first establishing the dimensionality of the vector space of the test items. This is emphasised by the fact that she reported only one reliabilit y coefficient (coefficient alpha) for the scale.
In order to establish the dimensionality of her scale, she used principal factor analysis. There were eighteigenvalues greater than unity, but she rotated only two factors – an entirely arbitrary decision. The two factors that were rotated were interpreted as self-confidenceand autonomy. There is, however, a strong possibility that these two “factors” are actually two clustersof items loading on the same factor.
There are numerous problems associated with factor analysis of items: a single scale can yield as many as twenty factors, most of which are artefactors. The basic problem here is differential skewnessof items. Items with the same degree of skewness or with common content can load on the same factor (cf. Schepers, 1992, pp. 108-143). Therefore, a way must be found to determine the true struct ure of an intercorrelation matrix of items. This matter will be dealt with in the method section.
In view of the above, it ought to be evident that there is currently not a single locus of control scale that is not contestable. Thus, there is scope for the construction of a new measuring instrument to measure this important construct. The limitations of the said measuring instruments should, however, be overcome1).
Statement of problem
The principal objective of the present study was to construct a normative measuring instrument of the construct(s) of locus of control, that can be used with students and adults.
A corollary of the study was to establish the personality, interest and cognitive correlates of locus of control. If important personality, interest and cognitive correlates are found, a single instrument could be used to create a fairly comprehensive personality profile of an individual. Conceptually, the measuring instrument is based on attribution theoryand social learning theory.
People are constantly seeking causes for their behaviour and those of others. The ascribed causes of specific behaviour are called attributions. The causative attributions that people make, and their interpretation thereof, determine to a large extent their perceptions of the social world. Is it a friendly or a threatening world? Is it a just or unjust world? Is it a predictable or an unpredictable world? Can we exercise control over particular events through our own abilities or are our lives controlled by certain influential people?
The causes of human behaviour can be divided into two broad categories, namely dispositionalcauses and situational causes. Dispositional causes pertain to one’s natural disposition and include one’s organismic attributes. Situational causes pertain to the external world and include all environmental factors (Roediger III, Capaldi, Paris & Polivy, 1991).
Social learning theory is closely linked to attribution theory: Whilst social learning theory deals with the nature of reinforcements arising from the social environment and how it affects the social behaviour of the learner, attribution theory pertains to the way in which a person gathers information about the stable or invariant characteristics of others – their motives, intentions and traits – as well as of the external world (Baron, Byrne & Kantowitz, 1980). Rotter’s (1966) definition of internal and external control is used throughout this paper.
A construct closely related to internal control is autonomy. Autonomy can be defined as “the tendency to attempt to master or be effective in the environment, to impose one’s wishes and designs on it” (Wolman, 1973, p.37). It is expected that persons high on autonomy would seek control of situations that offer possibilities of change, would readily accept the challenge of solving complex problems, would take the initiative in situations requiring leadership, would prefer to work on their own and to structure their own work programme.
With attribution theory and social learning theory as frames of reference, the first edition (1994) of the Locus of Control Inventory (LCI) was constructed. To ensure content validitythe domain of locus of control was extensively sampled. Altogether 65 items were written, representing the constructs of Internal Control, External Control and Autonomy.
The items of the LCI are all in the form of questionsand the responses are endorsed on a seven-point scale. Only the end-points of the scales are verbally anchored, and the respondent has to indicate his/her response by drawing a cross in the appropriate box of the rating scale. For large scale testing separate answer sheets, that can be read by an optical page reader, are used.
In the light of the major objective of the study the following
postulatesand hypothesiswere formulated:
Postulate 1
As far as the structureof the LCI is concerned threefactors are postulated, viz. Internal Control, External Control and Autonomy.
SCHEPERS
2
Postulate 2
It is postulated that three homogeneousscales, with acceptable reliabilities, can be formed.
Postulate 3
It is postulated that twoor more contrasting groupscan be formed with reference to the measures of the LCI.
Hypothesis 1
It is hypothesised that the vectors of means of the contrasting groupsdiffer in respect of certain selected measures of cognitive ability, interest and personality.
METHOD
Participants
The LCI was applied to a sample of 356 first-year students in industrial psychology at a large South African university where the main language used was Afrikaans. Almost all of the participants were White. The sample was representative of the Faculty of Economic and Business Sciences, as industrial psychology is one of the core subjects in the faculty.
Measuring instruments
In order to determine the correlates of locus of control the following measuring instruments were applied jointly with the LCI: The General Scholastic Aptitude Test (GSAT), the Senior Aptitude Tests (SAT), the Sixteen Personality Factor Questionnaire (16PF), the Personal, Home, Social and Formal Relations Questionnaire (PHSF), the Survey of Study Habits and Attitudes (SSHA), the 19 Field Interest Inventory (19FII) and the Career Development Questionnaire (CDQ). All the instruments are well known in South Africa and do not need any further description here. Appropriate manuals are available for all the instruments (Cattell, 1989; Claassen, de Beer, Hugo & Meyer, 1998; Fouché & Verwey, 1991; Langley, du Toit & Herbst, 1996). The metrical properties of all the instruments are acceptable for research purposes.
Statistical analysis
If the presumption exists that the vector spaceof test items is multidimensional, it will be necessary to first classif y the items in terms of the construct measured, before an item analysis is done. The categorisation of the test items can be done with the aid of factor analysis, but the procedure is not free from problems.
The core of the problem centres in the differential skewness of test items. If items that are differentially skew are subjected to factor analysis, a multiplicityof factors is obtained with the result that the true structure of the intercorrelations is obscured (cf. Ferguson, 1941).
To overcome the above-mentioned problem, the following procedure (cf. Schepers, 1992, pp.140-143) was followed in the analysis of the LCI:
1. The 65 items were intercorrelated.
2. The eigenvalues of the unreduced intercorrelation matrix were calculated.
3. As many factors as there were eigenvalues greater than unity were postulated.
4. An iterative principal factor analysis was done.
5. Iteration was done on the number of factors as determined at step 3.
6. The obtained factor matrix was rotated to simple structureby means of a Varimax rotation.
7. All the items with high negative loadings were reflected. 8. All the items with high loadings on a specific factor were
added together and a subscore for each factor was computed. Every item was used only once.
9. The obtained subscores were intercorrelated and steps 2 to 4 were repeated.
10.The obtained factor matrix was rotated to simple structureby means of a Direct Oblimin rotation.
11.All subscores with negative loadings on the first principal axiswere reflected.
12.Separate scales were formed, corresponding to each of the factors, by grouping all the items together that have substantial loadings on a factor (cf. step 8).
13.Separate item analyses were done for each of the scales formed*.
14.Iteration was done in terms of the indices of reliabilityof the test items.
15.The reliabilitiesof the scales were determined by means of Cronbach’s coefficient alpha.
To determine the correlates of locus of control contrasting
groupswere used. These groups were formed by using the scores
of the LCI. To ensure that the groups that are formed are natural groups, use was made of cluster analysis:
According to Sokal (1974) clusters can be considered as homogeneous classes. Cluster analysis minimisesthe variance within clusters and maximisesthe variance between clusters.
The cluster analysis program that was used in the present study is based on a method described by Friedman and Rubin (1967). It comprises an iterative reclassification of objects with the view to minimisethe variance within clusters and to maximise the variance between clusters. The largest number of clusters expected (essentially a subjective decision) must be specified ahead of time. The program then forms fewer and fewer clusters until only two are left (Muller, 1975).
Next, the clusters obtained are compared with one another in terms of the reference tests already described. Depending on the number of clusters obtained, MANOVA or Hotelling T2is used to determine whether the vectors of means of the various clusters differ from one another or not. If the vectors of means of the various clusters differ from one another the group meansof the different clusters are compared with one another. For this purpose Tukey’s studentised range test or t-tests are used. If there are only two clusters t-tests are used.
RESULTS
Factor analysis of the LCI
As the procedure that was followed in the analysis of the LCI has been fully described in the method section, only the essential results are given here.
The items of the LCI were intercorrelated, and the eigenvalues of the intercorrelation matrix were calculated. Twenty of the eigenvalues were greater than unity, accordingly 20 factors were extracted and rotated to simple structure by means of a Varimax rotation. These tables, however, are too large for reproduction here.1)
Next, subscores were calculated in respect of each of the factors. The subscores were then intercorrelated and the intercorrelation matrix is given in Table 1. From Table 1 it is clear that the various subscores are mutually correlated despite the fact that the initial factors were orthogonal to one another.
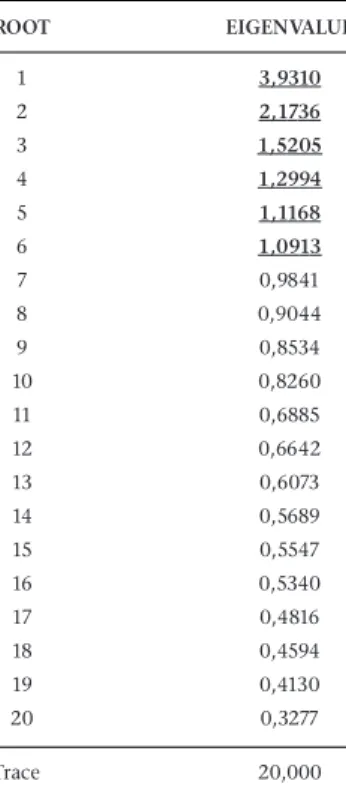
The eigenvalues of the intercorrelation matrix of subscores are given in Table 2. Table 2 shows that sixof the eigenvalues are greater than unity. Accordingly six factors were extracted and rotated to simple structure by means of a Direct Oblimin rotation. The rotated factor matrix is given in Table 3.
From Table 3 it is evident that Factors IV, V and VI are poorly determinedwith four, one and five itemsrespectively. There are thus only three well determined factors. Separate scaleswere formed in respect of the three factors.
*NP50 – an item analysis program developed by the National Institute for Personnel Research, previously a division of the Council for Scientific and Industrial Research, was used for this purpose.
SCHEPERS
4
TABLE1
MATRIX OF INTERCORRELATIONS OF THE SUBTESTS OF THE LOCUS OF CONTROL INVENTORY(1994)
Variable Subtest 1 Subtest 2 Subtest 3 Subtest 4 Subtest 5 Subtest 6 Subtest 7 Subtest 8 Subtest 9 Subtest 10
Subtest 1 1,0000
Subtest 2 0,3926 1,0000
Subtest 3 -0,1092 -0,0682 1,0000
Subtest 4 -0,0819 -0,0992 0,4227 1,0000
Subtest 5 -0,0157 -0,0845 0,3515 0,4376 1,0000
Subtest 6 0,5339 0,4607 -0,1156 -0,1343 -0,1305 1,0000
Subtest 7 0,2963 0,5332 -0,0670 -0,2175 -0,1847 0,3101 1,0000
Subtest 8 0,2512 0,2612 -0,0124 -0,1512 -0,0933 0,3287 0,3055 1,0000
Subtest 9 -0,2305 -0,3677 0,1869 0,2377 0,2073 -0,2259 -0,4142 -0,3604 1,0000
Subtest 10 -0,1449 -0,0783 0,0787 0,0979 0,2166 -0,1876 -0,0127 -0,0018 0,0345 1,0000
Subtest 11 0,3674 0,3409 -0,1366 -0,1766 -0,0731 0,4013 0,2846 0,3212 -0,2651 -0,0395
Subtest 12 0,0280 0,0400 0,1704 0,1191 0,2731 -0,0360 0,0184 0,0498 0,0744 0,0663
Subtest 13 0,3652 0,3359 -0,1394 -0,0771 -0,0557 0,3708 0,0925 0,1476 -0,1664 -0,0318
Subtest 14 0,1650 0,1358 0,0490 0,0465 0,0899 0,0726 0,0560 0,0807 -0,0237 0,0907
Subtest 15 0,0376 -0,1172 0,2293 0,3555 0,2603 0,0179 -0,2353 -0,1803 0,2567 -0,0060
Subtest 16 0,0764 0,0143 0,0439 -0,0365 -0,0382 0,0043 -0,0096 0,0389 0,0220 -0,0219
Subtest 17 0,3290 0,2669 -0,0326 0,1328 0,0445 0,1839 0,0793 -0,0547 -0,0458 -0,1864
Subtest 18 0,1923 0,1367 -0,0182 -0,0823 -0,1125 0,1269 0,0800 0,1015 -0,1447 -0,0422
Subtest 19 -0,0721 -0,3188 0,0578 0,1080 0,2381 -0,1815 -0,2920 -0,1240 0,2785 0,1251
Subtest 20 0,2853 0,1994 -0,1159 -0,0008 0,0228 0,2039 0,0727 0,1427 -0,0878 -0,0387
Note: N = 356; K = 65
Subtest 11 Subtest 12 Subtest 13 Subtest 14 Subtest 15 Subtest 16 Subtest 17 Subtest 18 Subtest 19 Subtest 20
1,0000
-0,0125 1,0000
0,3402 -0,0604 1,0000
0,1356 -0,0185 0,1247 1,0000
-0,0657 0,0021 0,1526 0,0137 1,0000
0,1353 0,0401 0,0533 0,0479 -0,0649 1,0000
0,0871 0,0686 0,1448 0,0713 0,0902 -0,0458 1,0000
0,1441 -0,1309 0,1732 0,0404 0,0427 0,0835 0,0470 1,0000
-0,0710 0,0744 -0,1071 0,0012 0,1288 0,0022 -0,0132 -0,0506 1,0000
TABLE2
EIGENVALUES OF UNREDUCED INTERCORRELATION MATRIX(20 × 20)
ROOT EIGENVALUE
1 3,9310
2 2,1736
3 1,5205
4 1,2994
5 1,1168
6 1,0913
7 0,9841
8 0,9044
9 0,8534
10 0,8260
11 0,6885
12 0,6642
13 0,6073
14 0,5689
15 0,5547
16 0,5340
17 0,4816
18 0,4594
19 0,4130
20 0,3277
Trace 20,000
Next, separate item analyses were done in respect of the three scales. The item statistics in respect of Scale I are given in Table 4. From an inspection of Table 4 it is clear that all the items have acceptable indices of reliability. The item-test correlations vary from 0,389 to 0,638 and the standard deviations from 0,975 to 1,767. All the items were retained and yielded a Cronbach alpha coefficient of 0,802. As far as the content of the items are concerned they all deal with autonomous behaviour. The scale was accordingly identified as a scale of Autonomy.
TABLE4
ITEM STATISTICS IN RESPECT OF SCALE I(AUTONOMY) OF THELCI
Item N Mean Standard Item-test Index of of item deviation Correlation reliability of
(Xg) of item (sg) (rgx) item (rgxsg)
*Q1 356 4,669 1,387 0,439 0,609
Q2 356 5,138 1,332 0,403 0,537
Q3 356 4,747 1,319 0,467 0,616
Q5 356 5,621 0,981 0,541 0,531
*Q11 356 5,371 1,354 0,523 0,708
Q13 356 5,789 0,975 0,638 0,622
Q14 356 5,171 1,180 0,581 0,686
*Q15 356 4,806 1,443 0,553 0,798
Q17 356 5,360 1,285 0,502 0,645
Q22 356 5,944 1,044 0,627 0,655
Q24 356 5,424 1,255 0,536 0,672
Q28 356 5,514 1,281 0,611 0,783
Q29 356 5,388 1,166 0,514 0,600
Q30 356 5,096 1,399 0,594 0,832
*Q65 356 4,295 1,767 0,389 0,687
Cronbach alpha = 0,802 Number of items = 15
*Reflected items
The item statistics in respect of Scale II are given in Table 5. Table 5 shows that with the exception of item 21 all the items have acceptable indices of reliabilit y. The item-test correlations vary from 0,329 to 0,613 and the standard deviations of the items from 0,834 to 1,843. Only one item was rejected, namely item 21. The remaining items yielded a Cronbach alpha coefficient of 0,774. As far as the contentof the items are concerned, it is clear that they deal with the
extent of control that the respondentcan exert over matters
or happenings. The scale was accordingly identified as a scale of Internal Control.
TABLE3
FACTOR MATRIX OFLCI (DIRECT OBLIMIN ROTATION)
Variables K FACTOR I FACTOR II FACTOR III FACTOR IV FACTOR V FACTOR VI
Subtest 1: Items 6, 7, 18, 19, 26, 31 en 37 7 0,091 0,528 -0,064 0,322 0,205 0,145 Subtest 2: Items 2, 5, 14, 22, 24, 29 en 30 7 0,646 0,311 0,038 0,123 0,139 -0,145 Subtest 3: Items 12, 32, 33, 35, 36 en 41 6 0,124 -0,198 0,747 -0,055 0,045 0,188 Subtest 4: Items 20, 43, 56, 59 en 64 5 -0,079 0,052 0,603 -0,013 0,077 -0,185 Subtest 5: Items 9, 47, 50, 51, 57 en 58 6 -0,192 0,198 0,379 -0,238 0,378 -0,106 Subtest 6: Items 27, 54 en 55 3 0,227 0,408 -0,017 0,295 0,038 0,197 Subtest 7: Items 13, 15 en 28 3 0,684 0,039 -0,060 -0,023 0,124 0,006 Subtest 8: Items 42, 45, 46 en 49 4 0,326 0,165 -0,024 -0,127 0,057 0,358
Subtest 9: Items 1, 11 en 17 3 -0,515 -0,104 0,164 0,081 0,027 -0,041 Subtest 10: Items 8, 52 en 53 3 -0,009 0,103 0,032 -0,507 0,074 -0,082 Subtest 11: Items 44, 61, 62 en 63 4 0,130 0,454 -0,133 -0,008 0,064 0,272 Subtest 12: Item 4 1 0,007 -0,137 0,090 0,025 0,515 0,106 Subtest 13: Items 10 en 48 2 0,023 0,570 -0,024 0,089 -0,108 0,025 Subtest 14: Item 34 1 0,040 0,226 0,058 -0,082 0,064 0,011 Subtest 15: Items 38, 39 en 40 3 -0,282 0,251 0,420 0,132 -0,127 -0,090 Subtest 16: Item 23 1 -0,052 0,015 0,005 0,020 0,017 0,235
Subtest 17: Item 25 1 0,044 0,185 0,023 0,443 0,266 -0,232 Subtest 18: Items 16 en 21 2 0,068 0,179 0,036 0,064 -0,170 0,116 Subtest 19: Items 3 en 65 2 -0,515 0,098 -0,061 -0,096 0,176 0,070 Subtest 20: Item 60 1 -0,015 0,462 -0,046 -0,036 -0,121 -0,037
TABLE5
ITEM STATISTICS IN RESPECT OF SCALE II
(INTERNAL CONTROL) OF THELCI
Item N Mean Standard Item-test Index of of item deviation Correlation reliability of
(Xg) of item (sg) (rgx) item (rgxsg)
Q6 356 5,778 1,155 0,517 0,597
Q7 356 5,542 1,116 0,424 0,473
Q10 356 6,118 0,834 0,502 0,419
Q16 356 4,997 1,717 0,336 0,577
Q18 356 6,132 0,870 0,530 0,461
Q19 356 6,287 0,799 0,470 0,376
Q21 356 5,025 1,096 *** ***
Q26 356 5,121 1,418 0,344 0,488
Q27 356 5,691 1,048 0,568 0,595
Q31 356 6,101 0,956 0,555 0,531
Q34 356 5,315 1,764 0,329 0,580
Q37 356 5,871 0,993 0,613 0,609
Q44 356 5,149 1,025 0,497 0,510
Q48 356 4,885 1,252 0,472 0,590
Q54 356 5,567 1,076 0,500 0,539
Q55 356 5,612 0,926 0,561 0,520
Q60 356 5,739 1,339 0,425 0,569
Q61 356 4,947 1,843 0,449 0,828
Q62 356 5,008 1,255 0,408 0,513
Q63 356 6,081 0,950 0,510 0,485
Cronbach alpha = 0,774 No items were reflected Number of items = 19
TABLE6
ITEM STATISTICS IN RESPECT OF SCALE III
(EXTERNAL CONTROL) OF THELCI
Item N Mean Standard Item-test Index of of item deviation Correlation reliability of
(Xg) of item (sg) (rgx) item (rgxsg)
*Q9 356 5,149 1,237 0,469 0,580
*Q12 356 2,972 1,465 0,621 0,910
*Q20 356 3,604 1,342 0,535 0,718
*Q32 356 3,500 1,543 0,323 0,499
*Q33 356 2,882 1,517 0,381 0,577
*Q35 356 3,632 1,570 0,507 0,796
*Q36 356 3,868 1,511 0,508 0,767
*Q38 356 3,671 1,397 0,376 0,525
*Q39 356 3,506 1,403 0,500 0,702
Q40 356 5,472 1,234 *** ***
*Q41 356 2,924 1,470 0,633 0,930
*Q43 356 3,826 1,681 0,462 0,776
*Q47 356 4,649 1,435 0,378 0,543
*Q50 356 4,202 1,416 0,338 0,479
*Q51 356 3,803 1,341 0,487 0,653
*Q56 356 3,444 1,510 0,576 0,870
*Q57 356 3,848 1,408 0,601 0,846
*Q58 356 2,329 1,513 0,413 0,624
*Q59 356 2,677 1,523 0,445 0,678
*Q64 356 4,590 1,665 0,472 0,785
Cronbach alpha = 0,807 Number of items = 19 *Reflected items
SCHEPERS
6
TABLE7
MEANS AND STANDARD DEVIATIONS OF THE VARIOUS CLUSTERS IN RESPECT OF AUTONOMY, INTERNAL CONTROL AND EXTERNAL CONTROL
Clusters N Means of clusters Standard deviations of clusters
Autonomy Internal External Autonomy Internal External
control control control control
CLUSTER 1: LLA+ 171 42,7705 43,4269 53,2342 7,6025 8,3837 8,8477
CLUSTER 2: HHA– 185 56,6824 56,0757 47,0106 6,7872 7,1224 10,0947
TABLE8
SIGNIFICANCE OF DIFFERENCES IN MEANS BETWEEN THE TWO CLUSTERS IN RESPECT OF THEGSAT, SAT ANDM-SCORE
Variables Cluster 1 Cluster 2 Levene F DF p(F) t-Value DF p(t)
X1 S2
1 N1 X1 S22 N2
GSAT: VERBAL IQ 108,9250 10,5050 120 110,7482 11,9916 139 1,93 1; 257 0,1655 -1,29 257 0,1976 GSAT: NON-VERBAL IQ 108,3833 11,8451 120 112,0504 12,1883 139 0,00 1; 257 0,9634 -2,45 257 0,0151* SAT 1: VERBAL COMPREHENSION 17,8417 3,8018 120 19,1583 3,6836 139 0,30 1; 257 0,5836 -2,83 257 0,0051* SAT 2: CALCULATIONS 17,8833 5,9736 120 19,0575 5,6296 139 0,48 1; 257 0,4877 -1,63 257 0,1049 SAT 3: DIGUISED WORDS 19,7833 5,4529 120 19,7482 5,4866 139 0,03 1; 257 0,8670 0,05 257 0,9589 SAT 4: COMPARISON 21,7333 3,4731 120 21,4748 3,5982 139 0,20 1; 257 0,6542 0,59 257 0,5584 SAT 5: PATTERN COMPLETION 19,0417 5,1782 120 20,5396 5,3274 139 0,38 1; 257 0,5382 -2,29 257 0,0231* SAT 6: FIGURE SERIES 19,4500 4,8764 120 20,6331 4,9346 139 0,00 1; 257 0,9526 -1,93 257 0,0541 SAT 7: SPATIAL 2D 17,3167 5,2724 120 20,0719 5,3238 139 0,02 1; 257 0,9019 -4,17 257 <0,0001* SAT 8: SPATIAL 3D 18,3833 4,9742 120 19,8489 4,6077 139 1,58 1; 257 0,2103 -2,46 257 0,0145* SAT 9: MEMORY-PARAGRAPH 13,4333 3,6731 120 13,4604 3,7460 139 0,00 1; 257 0,9458 -0,06 257 0,9533 SAT 10: MEMORY-SYMBOLS 25,6250 3,9451 120 26,1007 4,3176 139 0,01 1; 257 0,9151 -0,92 257 0,3584 M-SCORE 15,2000 3,9696 120 15,9353 4,7856 139 1,47 1; 257 0,2265 -1,33 257 0,1837
The item statistics in respect of Scale III are given in Table 6. From Table 6 it is clear that with the exception of item 40 all the items have acceptable indices of reliability. The item-test correlations range from 0,323 to 0,633 and the standard deviations of the items from 1,234 to 1,681. Only one item was rejected, namely item 40. The remaining items yielded a Cronbach alpha coefficient of 0,807. As far as the contentof the items are concerned they all deal with the degree of control that the external world exerts on the behaviour of the respondent. The scale was accordingly identified as a scale of External Control.
Next, the intercorrelations between the three scales were computed:
The Scale of Autonomy correlates 0,492 with the Scale of Internal Control and both correlate negativelywith the Scale of External Control. The Scale of Autonomy correlates -0,262 with the Scale of External Control, and the Scale of Internal Control correlates -0,172 with External Control. It is therefore evident that Internal Control and External Control are not bipolar opposites, but independent constructs. Although the Scales of Autonomy and Internal Control are moderately correlated, the percentage of common variance is only 24%. Therefore both make a unique contributionin their own right.
Cluster analysis
With the view to doing a cluster analysisof cases(persons) a score was calculated for each participant in respect of each of the three scales of the LCI. To facilitate the interpretation of the scores, the respective scales were linearly transformed to a mean of 50 and a standard deviation of 10. These transformed scores were then used as iput-variablesin the cluster analysis.
There is not an objective criterionfor deciding on the number of clusters to take. The choice depends largely on the meaningfulnessof the obtained clusters. In the present case two, three and four clusters were considered. Ultimately two clusters were taken. However, four clusters would also have been meaningful.
The means and standard deviations of the two clusters in respect of Autonomy, Internal Control and External Control are given in Table 7. From Table 7 it is clear that Cluster 1 is lowin respect of Autonomy and Internal Control and average to high on
External Control. By contrast Cluster 2 is highon Autonomy and Internal Control, but average to lowon External Control.
Differences between clusters in respect of the cognitive measures
The vectors of means of the two clusters were compared with one another in respect of Verbal and Non-verbal IQ (GSAT), the various measures of the Senior Aptitude Tests (SAT) and the M-score (matric mark). The significance of the differences in means between the various measures are shown in Table 8.
Table 8 indicates that the Hotelling T2-value is equal to 34,178 with an associated F-ratio of 2,506. This F-value, with 13 and 245 degrees of freedom, is statistically highly significant (p = 0,0031). Therefore, the t-tests can be interpreted with confidence.
From Table 8 it is clear that the means of Cluster 2 (HHA–) are statistically significantly higher than those of Cluster 1 (LLA+) in respect of the following variables:
Non-verbal IQ
Verbal Comprehension
Pattern Completion
Spatial 2D
Spatial 3D
It is therefore clear that persons with high scoreson Autonomy and Internal Control and low scores on External Control achieve higher scores on the cognitive measures than those who are lowon Autonomy and Internal Control, but highon External Control.
Differences between clusters in respect of the various primary factors of the 16PF
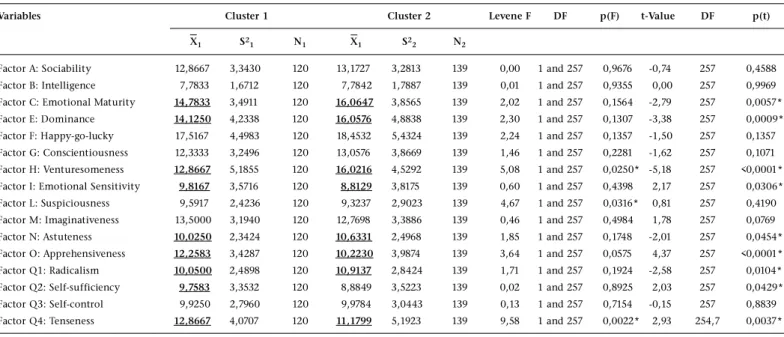
The vectors of means of the two clusters were also compared in terms of the various primary factors of the 16PF. The significance of the differences in means of the two clusters, in respect of the measures mentioned, are given in Table 9.
Table 9 shows that the Hotelling T2-value is equal to 59,902 with an associated F-value of 3,525. This F-value, with 16 and 242 degrees of freedom, is statistically highly significant (p < 0,0001). Thus, the t-tests can be interpreted with confidence.
TABLE9
SIGNIFICANCE OF DIFFERENCES IN MEANS BETWEEN THE TWO CLUSTERS IN RESPECT OF THE16PF
Variables Cluster 1 Cluster 2 Levene F DF p(F) t-Value DF p(t)
X1 S21 N1 X1 S22 N2
Factor A: Sociability 12,8667 3,3430 120 13,1727 3,2813 139 0,00 1 and 257 0,9676 -0,74 257 0,4588 Factor B: Intelligence 7,7833 1,6712 120 7,7842 1,7887 139 0,01 1 and 257 0,9355 0,00 257 0,9969 Factor C: Emotional Maturity 14,7833 3,4911 120 16,0647 3,8565 139 2,02 1 and 257 0,1564 -2,79 257 0,0057* Factor E: Dominance 14,1250 4,2338 120 16,0576 4,8838 139 2,30 1 and 257 0,1307 -3,38 257 0,0009* Factor F: Happy-go-lucky 17,5167 4,4983 120 18,4532 5,4324 139 2,24 1 and 257 0,1357 -1,50 257 0,1357 Factor G: Conscientiousness 12,3333 3,2496 120 13,0576 3,8669 139 1,46 1 and 257 0,2281 -1,62 257 0,1071 Factor H: Venturesomeness 12,8667 5,1855 120 16,0216 4,5292 139 5,08 1 and 257 0,0250* -5,18 257 <0,0001* Factor I: Emotional Sensitivity 9,8167 3,5716 120 8,8129 3,8175 139 0,60 1 and 257 0,4398 2,17 257 0,0306* Factor L: Suspiciousness 9,5917 2,4236 120 9,3237 2,9023 139 4,67 1 and 257 0,0316* 0,81 257 0,4190 Factor M: Imaginativeness 13,5000 3,1940 120 12,7698 3,3886 139 0,46 1 and 257 0,4984 1,78 257 0,0769 Factor N: Astuteness 10,0250 2,3424 120 10,6331 2,4968 139 1,85 1 and 257 0,1748 -2,01 257 0,0454* Factor O: Apprehensiveness 12,2583 3,4287 120 10,2230 3,9874 139 3,64 1 and 257 0,0575 4,37 257 <0,0001* Factor Q1: Radicalism 10,0500 2,4898 120 10,9137 2,8424 139 1,71 1 and 257 0,1924 -2,58 257 0,0104* Factor Q2: Self-sufficiency 9,7583 3,3532 120 8,8849 3,5223 139 0,02 1 and 257 0,8925 2,03 257 0,0429* Factor Q3: Self-control 9,9250 2,7960 120 9,9784 3,0443 139 0,13 1 and 257 0,7154 -0,15 257 0,8839 Factor Q4: Tenseness 12,8667 4,0707 120 11,1799 5,1923 139 9,58 1 and 257 0,0022* 2,93 254,7 0,0037*
SCHEPERS
8
From Table 9 it is evident that the two clusters differ statistically significantly from one another in respect of the following primary factors:
Factor C: Emotional maturity Factor E: Dominance Factor H: Venturesomeness Factor I: Emotional Sensitivity Factor N: Astuteness
Factor O: Apprehensiveness Factor Q1: Radicalism Factor Q2: Self-sufficiency Factor Q4: Tenseness
From Table 9 it is apparent that Cluster 2 (HHA¯) has higher
scores than Cluster 1 (LLA+) in respect of the following variables:
Emotional maturity, dominance, venturesomeness, astuteness and radicalism. Furthermore, Cluster 2 has lower scores than Cluster 1 in respect of the following variables: Emotional Sensitivity, apprehensiveness and tenseness.
Persons with highscores on Autonomy and Internal Control and low scores on External Control can therefore be described as follows:
They are emotionally stable, mature, calm, self-assertive, independent, unconventional, venturesome, socially uninhibited, firm, responsible, clever, self-assured, analytical, free-thinking, relaxed and composed.
Persons with lowscores on Autonomy and Internal Control, and highscores on External Control fall essentially at the opposite poleof all the above-mentioned personality attributes.
Differences between the clusters in respect of the various dimensions of the PHSF Relations Questionnaire
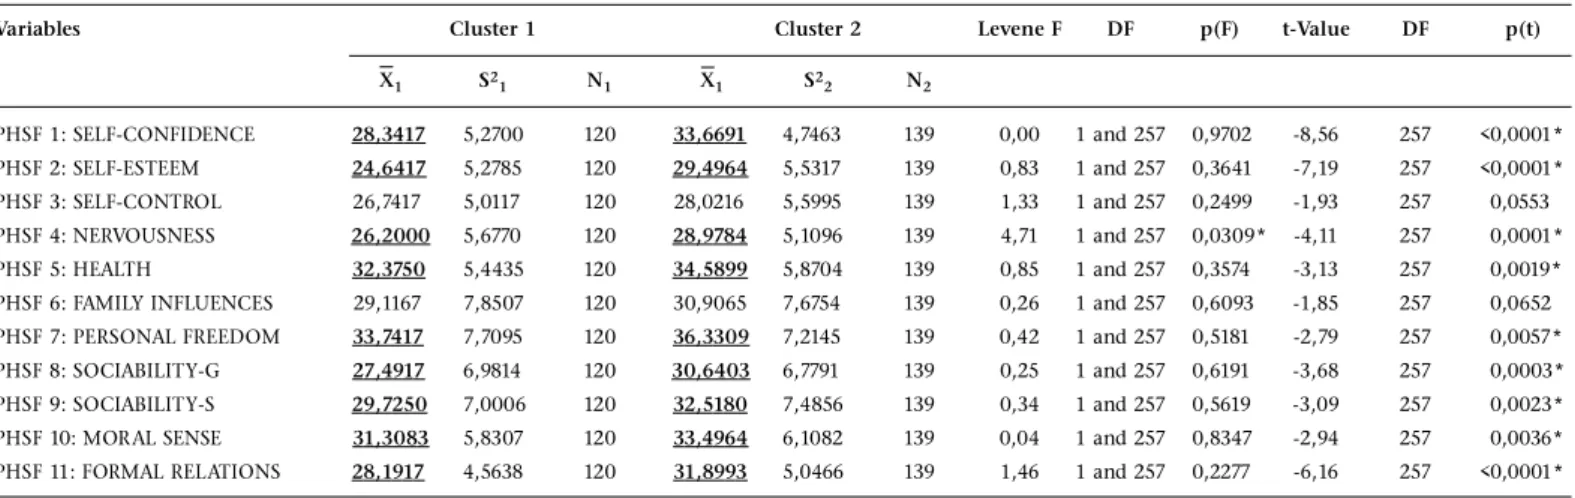
The vectors of means of the two clusters were compared with one another in respect of the various dimensions of the PHSF Relations Questionnaire. The significance of the differences in means between the two clusters are given in Table 10.
Table 10 shows that the Hotelling T2-value is equal to 101,902
with an associated F-value (11 & 247) = 8,903; p < 0,0001). Therefore the t-tests can be interpreted with confidence. From Table 10 it is clear that the means of the two clusters differ statistically significantly from one another in respect of the following dimensions of the PHSF:
Self-confidence Self-esteem Nervousness Health
Personal Freedom Sociability – G Sociability – S Moral Sense Formal Relations
With the exception of Self-control and Family Influences the means of Cluster 2 are statistically significantly higherthan those of Cluster 1. Persons with high scoreson Autonomy and Internal Control, and low scoreson External Control are therefore better adjusted persons than those with low scoreson Autonomy and Internal Control, and high scores on External Control. This applies to their Personal, Home, Social and Formal relations.
TABLE10
SIGNIFICANCE OF DIFFERENCES IN MEANS BETWEEN THE TWO CLUSTERS IN RESPECT OF THEPHSF
Variables Cluster 1 Cluster 2 Levene F DF p(F) t-Value DF p(t)
X1 S21 N1 X1 S22 N2
PHSF 1: SELF-CONFIDENCE 28,3417 5,2700 120 33,6691 4,7463 139 0,00 1 and 257 0,9702 -8,56 257 <0,0001* PHSF 2: SELF-ESTEEM 24,6417 5,2785 120 29,4964 5,5317 139 0,83 1 and 257 0,3641 -7,19 257 <0,0001* PHSF 3: SELF-CONTROL 26,7417 5,0117 120 28,0216 5,5995 139 1,33 1 and 257 0,2499 -1,93 257 0,0553 PHSF 4: NERVOUSNESS 26,2000 5,6770 120 28,9784 5,1096 139 4,71 1 and 257 0,0309* -4,11 257 0,0001* PHSF 5: HEALTH 32,3750 5,4435 120 34,5899 5,8704 139 0,85 1 and 257 0,3574 -3,13 257 0,0019* PHSF 6: FAMILY INFLUENCES 29,1167 7,8507 120 30,9065 7,6754 139 0,26 1 and 257 0,6093 -1,85 257 0,0652 PHSF 7: PERSONAL FREEDOM 33,7417 7,7095 120 36,3309 7,2145 139 0,42 1 and 257 0,5181 -2,79 257 0,0057* PHSF 8: SOCIABILITY-G 27,4917 6,9814 120 30,6403 6,7791 139 0,25 1 and 257 0,6191 -3,68 257 0,0003* PHSF 9: SOCIABILITY-S 29,7250 7,0006 120 32,5180 7,4856 139 0,34 1 and 257 0,5619 -3,09 257 0,0023* PHSF 10: MORAL SENSE 31,3083 5,8307 120 33,4964 6,1082 139 0,04 1 and 257 0,8347 -2,94 257 0,0036* PHSF 11: FORMAL RELATIONS 28,1917 4,5638 120 31,8993 5,0466 139 1,46 1 and 257 0,2277 -6,16 257 <0,0001*
Hotelling T2= 101,9016 F-ratio = 8,9033 df = 11 & 247 p = <0,0001
TABLE11
SIGNIFICANCE OF DIFFERENCES IN MEANS BETWEEN THE TWO CLUSTERS IN RESPECT OF THESSHA
Variables Cluster 1 Cluster 2 Levene F DF p(F) t-Value DF p(t)
X1 S21 N1 X1 S22 N2
SSHA 1: DELAY AVOIDANCE 21,2583 9,0084 120 25,4317 9,3064 139 0,47 1 and 257 0,4940 -3,65 257 0,0003* SSHA 2: WORK METHODS 24,4833 7,6191 120 29,0935 8,7534 139 2,47 1 and 257 0,1169 -4,49 257 <0,0001* SSSHA 4: EDUCATIONAL APPROVAL 25,0500 8,4822 120 27,2518 8,4176 139 0,02 1 and 257 0,8750 -2,09 257 0,0374* SSHA 5: ACCEPTANCE OF EDUCATION 24,7833 7,2728 120 27,4892 7,3241 139 0,15 1 and 257 0,6998 -2,97 257 0,0032*
Differences between the clusters in respect of the factors of the SSHA
The vectors of means of the two clusters were also compared with one another in respect of the different factors of the SSHA. The significance of the differences between the two clusters are given in Table 11.
Table 11 shows that the Hotelling T2-value is equal to 22,262 with an associated F-value (4 & 254) equal to 5,501; (p = 0,0003). The t-tests can therefore be interpreted with confidence.
From Table 11 it is clear that the means of the two clusters differ statistically significantly from one another in respect of the following factors of the SSHA:
Delay avoidance
Work methods
Approval of education
Acceptance of education
Cluster 2 has higher scores than Cluster 1 on all the factors of the SSHA. Persons with high scores on Autonomy and Internal Control, and low scores on External Control, show good adjustment in the educational context: They have good st udy-habits and work-methods, they avoid post ponement, and have a positive attit ude toward education.
Differences between the clusters in respect of the factors of the CDQ
The vectors of means of the two clusters were also compared in respect of the different factors of the CDQ. The significance of the differences in means between the two clusters are given in Table 12.
Table 12 shows that the Hotelling T2-value is equal to 30,305 with an associated F-value (5 & 253) equal to 5,967; (p < 0,0001). The t-tests can therefore be interpreted with confidence.
TABLE12
SIGNIFICANCE OF DIFFERENCES IN MEANS BETWEEN THE TWO CLUSTERS IN RESPECT OF THECDQ
Variables Cluster 1 Cluster 2 Levene F DF p(F) t-Value DF p(t)
X1 S21 N1 X1 S22 N2
CDQ 1: SELF-KNOWLEDGE 16,3417 2,4546 120 17,1223 2,1246 139 3,34 1 and 257 0,0686 -2,74 257 0,0065* CDQ 2: DECISION-MAKING 15,9083 3,0348 120 17,3741 2,3196 139 9,09 1 and 257 0,0028* -4,31 220,9 <0,0001* CDQ 3: CAREER INFORMATION 13,6000 3,7938 120 15,1295 3,4825 139 1,90 1 and 257 0,1688 -3,38 257 0,0008* CDQ 4: INTEGRATION OF SELF- 16,2583 2,4062 120 17,5827 1,9778 139 10,33 1 and 257 0,0015* -4,79 230,6 <0,0001* KNOWLEDGE AND CAREER
INFORMATION
CDQ 5: CAREER PLANNING 14,1667 3,1445 120 15,3957 2,9748 139 0,94 1 and 257 0,3340 -3,23 257 0,0014*
Hotelling T2= 30,3053 F-ratio = 5,9667 df = 5 & 253 p = <0,0001
TABLE13
SIGNIFICANCE OF DIFFERENCES IN MEANS BETWEEN THE TWO CLUSTERS IN RESPECT OF THE19FII
Variables Cluster 1 Cluster 2 Levene F DF p(F) t-Value DF p(t)
X1 S21 N1 X1 S22 N2
FII 1: FINE ARTS 21,6750 10,9323 120 23,1295 12,6931 139 4,94 1; 257 0,0271* -0,99 257 0,3227 FII 2: CLERICAL 13,9500 9,6344 120 14,0576 8,9651 139 1,52 1; 257 0,2194 -0,09 257 0,9260 FII 3: SOCIAL WORK 23,0083 11,9765 120 19,4892 12,3196 139 0,26 1; 257 0,6092 2,32 257 0,0210* FII 4: NATURE 11,0500 10,4655 120 11,6906 11,2880 139 2,21 1; 257 0,1387 -0,47 257 0,6380 FII 5: PERFORMING ARTS 14,3500 11,6472 120 16,1727 12,9838 139 2,27 1; 257 0,1335 -1,18 257 0,2386 FII 6: SCIENCE 13,1417 10,3211 120 15,3309 10,8183 139 0,66 1; 257 0,4174 -1,66 257 0,0984 FII 7: HISTORICAL 15,9000 10,2984 120 15,4101 10,7244 139 0,04 1; 257 0,8477 0,37 257 0,7092 FII 8: PUBLIC SPEAKING 15,9750 10,7144 120 21,3093 11,8333 139 0,38 1; 257 0,5379 -3,78 257 0,0002* FII 9: NUMERICAL 17,4250 10,4017 120 19,9712 11,4607 139 1,75 1; 257 0,1871 -1,86 257 0,0640 FII 10: SOCIABILITY 34,3083 8,1877 120 35,3525 9,3327 139 1,62 1; 257 0,2044 -0,95 257 0,3430 FII 11: CREATIVE THOUGHT 27,8333 8,8492 120 32,5755 8,5930 139 0,05 1; 257 0,8294 -4,37 257 <0,0001* FII 12: TRAVEL 31,5083 8,9902 120 32,7050 9,2544 139 0,00 1; 257 0,9852 -1,05 257 0,2940 FII 13: PRACTICAL-FEMALE 17,2500 9,9573 120 15,4532 10,9506 139 0,76 1; 257 0,3851 1,37 257 0,1710 FII 14: LAW 18,6750 12,2166 120 23,0288 13,6859 139 3,03 1; 257 0,0829 -2,68 257 0,0078* FII 15: SPORT 23,6500 12,5749 120 26,5827 12,9609 139 0,13 1; 257 0,7174 -1,84 257 0,0668 FII 16: LANGUAGE 16,2333 10,5899 120 17,7986 12,5682 139 4,88 1; 257 0,0280* -1,09 256,9 0,2778 FII 17: SERVICE 17,9417 9,2102 120 17,1007 8,0084 139 2,90 1; 257 0,0897 0,79 257 0,4326 FII 18: PRACTICAL-MALE 15,1667 11,4989 120 18,2086 12,7100 139 0,81 1; 257 0,3679 -2,01 257 0,0458* FII 19: BUSINESS 27,3917 11,2170 120 29,6547 11,8790 139 1,40 1; 257 0,2376 -1,57 257 0,1180 FII 20: WORK-HOBBY 14,6750 2,5771 120 14,1439 3,0158 139 0,38 1; 257 0,5402 1,51 257 0,1321 FII 21: ACTIVE-PASSIVE 10,5500 3,1962 120 9,8993 3,3195 139 0,21 1; 257 0,6442 1,60 257 0,1107
From Table 12 it is evident that the means of the two clusters differ statistically significantly in respect of the following factors of the CDQ:
Self-knowledge
Decision-making
Career information
Integration of self-knowledge and career information
Career planning
Cluster 2 has higher scoresthan Cluster 1 in respect of allthe factors. Persons with high scores on Autonomy and Internal Control, and low scoreson External Control are generally more
career maturethan persons with low scoreson Autonomy and
Internal Control, and high scoreson External Control.
Differences between the clusters in respect of the various fields of interest of the 19FII
The vectors of means of the two clusters were also compared in respect of the various fields of interest of the 19FII. The significance of the differences in means between the two clusters are given in Table 13.
Table 13 shows that the Hotelling T2-value is equal to 48,606 with an associated F-value (21 & 237) equal to 2,134; (p = 0,0035). The t-tests can therefore be interpreted with confidence.
From Table 13 it is clear that the means of the two clusters differ statistically significantly in respect of the following fields of the 19FII:
Social Work
Public Speaking
Creative Thought
Law
Practical-male
Cluster 2 has higher scores than Cluster 1 in respect of all the above-mentioned fields except Social Work. Persons with high scores on Autonomy and Internal Control, and low scores on External Control have a very strong interest in Creative Thought.
DISCUSSION
1. Primary objective of study. As far as the primary objective of the study is concerned, namely to construct a normativescale of locus of control for use with students and adults, the outcome was very positive. The LCI yielded three factors which were interpreted as Autonomy, Internal Control and External Control. Despite the fact that the three scales were quite shortthey nevertheless yielded acceptable reliabilities. Two contrasting groups (clusters) were formed by using the three scores of the LCI in a cluster analysis. The first cluster was low on Autonomy and Internal Control and average-plus on External Control, and the second cluster was high on Autonomy and Internal Control and average-minus on External Control.
2. The cognitive, interest and personality correlates of locus of control. In comparing the means of the two clusters, statistically significant differences were found in respect of a number of cognitive, interest and personality variables. Cluster 2 was consistently superiorto Cluster 1 in respect of Non-Verbal IQ, Verbal Comprehension, Pattern Completion, Spatial 2D and Spatial 3D. As far as personality make-up is concerned, Cluster 2 is emotionally mature, dominant, venturesome, astute and radical. Cluster 1, by contrast, is emotionally sensitive, apprehensive, self-sufficient and tense. As far as Personal, Home, Social and Formal relations are concerned Cluster 2 achieved consistently better scores than Cluster 1. Persons high on Autonomy and Internal Control are therefore better adjusted individuals than those high on External Control.
Cluster 2 also achieved consistently higher scores than Cluster 1 on all the subtests of the SSHA. All the differences were statistically highly significant. Persons high on Autonomy and Internal Control and low on External Control therefore have a very positiveattitude towards education.
As far as career developmentis concerned, Cluster 2 achieved consistently higher scores than Cluster 1. They have better self-knowledge, are better at decision-making, have better career information and are better at integrating their self-knowledge and career Information. They are also better at career planning. All the differences in favour of Cluster 2 are statistically highly significant.
As far as fields of interest are concerned, Cluster 2 obtained statistically significantly higher mean scores than Cluster 1 in respect of Public Speaking, Creative Thought, Law and Practical-male pursuits. Cluster 1 obtained a higher score than Cluster 2 on Social Work. However, it should be borne in mind that the sample is only representative of the Faculty of Economic and Business Sciences. The correlates of interestshould therefore be examined on a much wider sample.
From the foregoing it is clear that the LCI shows great promise, but needs to be extended in scope, and should be applied to a much larger and more representative sample. In particular it should also be applied to a sample of adults and multicultural groups. The second edition (1995) of the LCI has been revised and extended in scope. It is described in the next article in this publication.
ACKNOWLEDGEMENTS
I hereby wish to thank all the members of the Statistical consultation Service of the University of Johannesburg for all the hours of computational work done for me. I value it very highly.
A special work of thanks to Annetjie Boshoff and her assistant Afton Walters for the typing of the manuscript. Nobody can type tables better than Annetjie.
REFERENCES
Abramowitz, S.I. (1973). Internal-External control and social-political activism: A test of the dimensionality of Rotter’s Internal-External Scale. Journal of Consulting and Clinical Psychology, 40, 196-210.
Baron, R.A., Byrne, D. & Kantowitz, B.H. (1980).Understanding behavior(2nded.) New York: Holt, Rinehart and Winston. Cattell, H.B. (1989). The 16 PF: Personality in depth. Champaign,
Illinois: Institute for Personality and Ability Testing, Inc. Claassen, N.C.W., de Beer, M., Hugo, H.L.E. & Meyer, H. M.
(1998). Manual for the General Scholastic Aptitude Test. Pretoria: Human Sciences Research Council.
Clemans, W.V. (1966). An analytical and empirical examination of some properties of ipsative measures. Psychometric MonographNumber 14.
Collins, B.E. (1974). Four components of the Rotter Internal-External Scale: Belief in a difficult world, a predictable world, a just world, and a politically responsive world. Journal of Personality and Social Psychology, 29, 381-391. Duttweiler, P.C. (1984). The Internal Control Index: A newly
developed measure of locus of control. Educational and Psychological Measurement, 44, 209-221
Erwee, R. (1986). Achievement motivation and locus of control of Black university students. Journal of Industrial Psychology, 12, 1-9.
Ferguson, G.A. (1941). The factorial interpretation of test difficulty. Psychometrika, 6, 323-329.
Fouché, F.A. & Verwey, F.A. (1991. Manual for the Senior Aptitude Tests. Pretoria: Human Sciences Research Council.
Franklin R.D. (1963). Youth’s expectancies about internal versus external control of reinforcement related to N variables. Unpublished doctoral dissertation, Purdue University. Friedman, H.P. & Rubin, J. (1967). On some invariant criteria to
grouping data. Journal of American Statistical Association, 62, 1159-1178.
Furnham, A. (1986). Economic locus of control. Human Relations, 39, 29-43.
Langley, R., du Toit, R. & Herbst, D.L. (1996). Handleiding vir die Loopbaanontwikkelingsvraelys (LOV). Pretoria: Raad vir Geesteswetenskaplike Navorsing.
Levenson, H. (1974). Activism and powerful others: Distinctions within the concept of internal-external control. Journal of Personality Assessment, 38, 377-383.
Mirels, H.L. (1970). Dimensions of internal versus external control. Journal of Consulting and Clinical Psychology, 34, 226-228. Mischel, W. (1986). On the interface of cognition and
personality: Beyond the person-situation debate. American Psychologist, 34, 740-754.
Muller, M.W. (1975). A comparison of some clustering techniques. Unpublished M.Sc Dissertation. Johannesburg: University of the Witwatersrand.
Nowicki, S., Jr. & Strickland, B.R. (1973). A locus of control scale for children. Journal of Consulting and Clinical Psychology, 40, 148-154.
Procuik, T.J. & Lussier, R.J. (1975). Internal-external locus of control: an analysis and bibliography of two years of research (1973-1974). Psychological Reports, 37, 1323-1337. Roediger III, H.L., Capaldi, E.D., Paris, S.G. & Polivy, J. (1991).
Psychology(3rded). New York: Harper Collins Publishers. Rotter, J.B. (1966). Generalized expectancies for internal versus
external control of reinforcement. Psychological Monographs, 80, No. 1 (Whole No. 609).
Schepers, J.M. (1992). Toetskonstruksie: Teorie en praktyk. Johannesburg: RAU-Drukpers.
Sokal, R.R. (1974). Classification: Purposes, principles, progress, prospects. Science, 185, 1115-1123.
Tucker, L.R. (1956). Factor analysis of double centered score matrices. Research Memorandum(RM-56-3). Princeton, N.J.: Educational Testing Service.
Wallston, B.S., Wallston, K.A., Kaplin, G.D. & Maides, S.A. (1976). Development and validation of the Health Locus of Control (HLC) Scale. Journal of Consulting and Clinical Psychology, 44, 580-585.
Wallston, K.A., Wallston, B.S. & De Vellis, R. (1978). Development of the Multidimensional Health Locus of Control (MHLC) Scale. Health Education Monographs, 6, 160-170.