O R I G I N A L R E S E A R C H
Open Access
The cost-effectiveness of upfront
point-of-care testing in the emergency department:
a secondary analysis of a randomised,
controlled trial
Lara Nicole Goldstein
1,2*, Mike Wells
2and Craig Vincent-Lambert
2Abstract
Background:Time-saving is constantly sought after in the Emergency Department (ED), and Point-of-Care (POC) testing has been shown to be an effective time-saving intervention. However, when direct costs are compared, these tests commonly appear to be cost-prohibitive. Economic viability may become apparent when the time-saving is translated into financial benefits from staffing, time- and cost-time-saving. The purpose of this study was to evaluate the cost-effectiveness of diagnostic investigations utilised prior to medical contact for ED patients with common medical complaints.
Methods:This was a secondary analysis of data from a prospective, randomised, controlled trial in order to assess the cost-effectiveness of upfront, POC testing. Eleven combinations of POC equivalents of commonly-used special investigations (blood tests (i-STAT and complete blood count (CBC)), electrocardiograms (ECGs) and x-rays (LODOX® (Low Dose X-ray)) were evaluated compared to the standard ED pathway with traditional diagnostic tests. The economic viability of each permutation was assessed using the Incremental Cost Effectiveness Ratio and Cost-Effectiveness Acceptability Curves. Expenses related to the POC test implementation were compared to the control group while taking staffing costs and time-saving into account.
Results:There were 897 medical patients randomised to receive various combinations of POC tests. The most cost-effective combination was the i-STAT+CBC permutation which, based on the time saving, would ultimately save money if implemented. All LODOX®-containing permutations were costlier but still saved time. Non-LODOX® permutations were virtually 100% cost-effective if an additional cost of US$50 per patient was considered acceptable. Higher staffing costs would make using POC testing even more economical.
Conclusions:In certain combinations, upfront, POC testing is more cost-effective than standard diagnostic testing for common ED undifferentiated medical presentations–the most economical POC test combination being the i-STAT + CBC. Upfront POC testing in the ED has the potential to not only save time but also to save money. Trial registration:ClinicalTrials.gov:NCT03102216.
Keywords:Point-of-care systems, Point-of-care testing, Emergency department, Economic analysis
© The Author(s). 2019Open AccessThis article is distributed under the terms of the Creative Commons Attribution 4.0 International License (http://creativecommons.org/licenses/by/4.0/), which permits unrestricted use, distribution, and reproduction in any medium, provided you give appropriate credit to the original author(s) and the source, provide a link to the Creative Commons license, and indicate if changes were made. The Creative Commons Public Domain Dedication waiver (http://creativecommons.org/publicdomain/zero/1.0/) applies to the data made available in this article, unless otherwise stated. * Correspondence:[email protected]
1Division of Emergency Medicine, Faculty of Health Sciences, University of the Witwatersrand, Johannesburg, South Africa
Introduction
Point-of-Care (POC) tests – diagnostic tests that are performed at or near the patient’s bedside– have been touted as potential time-saving interventions to decrease waiting times in the Emergency Department (ED) [1–3]. These tests can decrease the turnaround time of special investigations thereby reducing delays which can cause prolonged patient times in the ED [2, 4]. While these POC time-savers are mostly reported in the literature as being cost-prohibitive to implement when their direct costs are compared to the traditional diagnostic testing, the POC system costs have conversely also been re-ported as being less expensive than central laboratory costs in other studies [2,5–7]. Recouping the personnel costs from the time that is saved, however, may paradox-ically mean that the more expensive POC tests have fi-nancial benefit and therefore become an economically viable option [2,5]. The improved overall processing of the patient as a result of the reduced turnaround times, more rapid diagnosis and disposition could potentially allow for fewer staff members to manage the same num-ber of patients in the same time as using a conventional system [2, 5, 8]. This would be an important potential consideration when planning and optimising ED staffing. Conventionally, special investigations such as blood tests, electrocardiograms (ECGs) and radiological inves-tigations take place after an ED doctor has evaluated a patient. Both the patient and the doctor then need to wait for the results of these tests before the doctor can make a disposition decision for the patient. When con-ventional testing is replaced with POC tests performed upfront prior to doctor assessment, significant time-saving has been demonstrated – this was our rando-mised, controlled trial that provided the data on which this secondary analysis is based [9]. Whether the time-saving from this intervention could translate into money-saving is important to determine. This informa-tion would be useful for policy- and decision-makers with regards to deciding whether to implement upfront, POC testing in their EDs.
The aim of this study was to evaluate the cost-effectiveness of common diagnostic investigations, in the form of POC tests, performed prior to doctor assess-ment, for patients presenting to the ED as a secondary analysis of data obtained from our randomised con-trolled trial [9].
Methods
Study design and setting
This was a secondary analysis of data from an investigator-initiated prospective, randomised, controlled trial. The original trial evaluated the time-saving poten-tial of upfront, POC tests in the ED [9]. This secondary analysis was conducted in order to assess the
cost-effectiveness of the upfront POC testing. The trial was conducted in the ED of a tertiary, academic hospital in a metropolitan area of Johannesburg, South Africa. The ED sees approximately 65,000 patients annually. The hospital is a government-funded, public sector hospital serving a region with a population of approximately one million medium- to low-income people.
The study took place between 13 February and 29 June 2017.
Permission to conduct the study was granted by the Research Ethics Committee of the Faculty of Health Sci-ences of the University of Johannesburg (REC-01-185-2016); the Human Research Ethics Committee of the University of the Witwatersrand (M171086); South Afri-can National Health Research Ethics Council (DOH-27-0117-5628); and was registered as a clinical trial with the South African National Health Research Database (GP_ 2017RP57_655) as well as with clinicaltrials.gov (NCT03102216). Written informed consent was ob-tained from all patients. Patients were not paid for their participation in this study nor did they incur any ex-penses related to the study.
Selection of participants
During weekdays, all adult patients older than 18 years who presented to the ED with various common medical symptoms were eligible for inclusion in the study. The medical symptom groups included were typical of the so-called undifferentiated patient that may present to the ED viz.
“abdominal group” –patients who presented with any form of abdominal pain and/or vomiting
“chest group” –patients who presented with dyspnoea, chest pain, cough and/or syncope
“generalized body pain/weakness group” –patients who presented with generalized body pain and/or weakness
“psychiatric group” –patients who presented with psychosis, aggression, hallucinations and/or having taken a drug overdose
Patients who required immediate resuscitation or who were pregnant were not considered for inclusion.
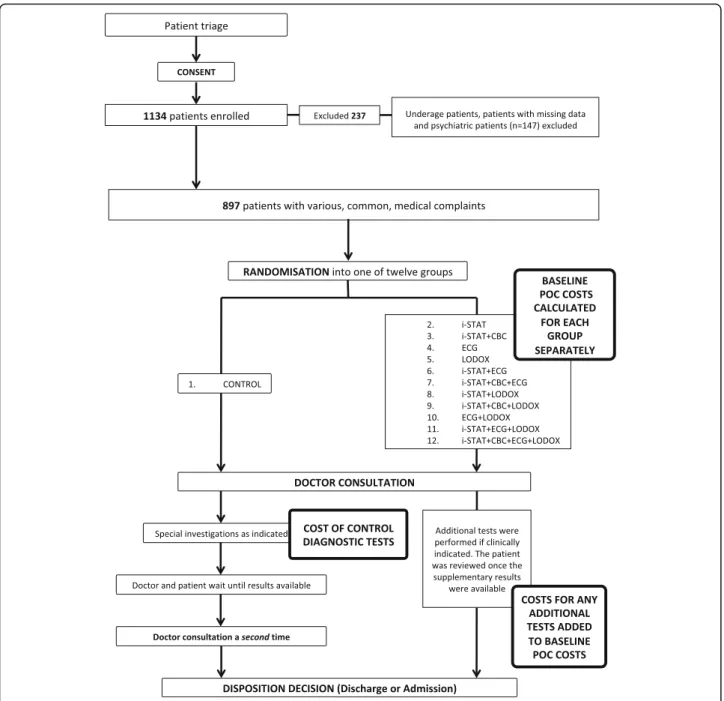
Figure 1 demonstrates the methodology followed in the study, showing the normal ED pathway compared to the eleven POC pathways utilised during the study period.
symptoms groups (Fig. 1). Based on the block ran-domisation, data collection sheet sets were placed upside-down in the order generated. After the patient signed consent, either the research doctor or the re-search assistant took the next data collection sheet in the order supplied.
The patients were randomised to receive either the normal ED workflow pathway (i.e. the control) or one of the other eleven intervention POC pathways with various combinations of one, two, three or four POC tests (see Fig. 1). This was done in order to ascertain whether any particular individual POC test or if
certain combinations of POC tests could provide the most benefit.
In the control pathway, after triage, consent and randomisation, a doctor evaluated the patient. If diagnostic tests were required, they were ordered as indicated. All blood tests were performed according to standard procedures in the on-site hospital la-boratory and if the patient required a blood gas ana-lysis, the doctor would perform this on one of two blood gas analysers available in the ED (Cobas B 221 POC system, Roche Diagnostics or ABL800 Flex, Radiometer). X-rays were performed in the radiology
department and the ED staff performed ECGs as required.
The doctor would review the patient a second time once the results of the diagnostic tests were available. This was followed by the disposition decision.
In the enhanced, intervention POC pathways, if the doctor deemed additional investigations over and above the POC tests necessary, those tests were then per-formed according to the ED standard procedures. Once the additional results were subsequently available, the patients were reviewed.
Patients were not subjected to any form of diagnostic investigation that they would not most likely have re-ceived by following the control pathway for each par-ticular symptom group. The main difference between the control workflow pathway and the enhanced, inter-vention POC workflow permutations was that the tests were performed in the ED at the so-called point-of-care priorto the patient seeing the doctor for the first time.
Patient throughput time in the ED consists of adminis-trative time and treatment time [10]. Table 1 contains the definitions, possible confounders and solutions employed in this study to overcome them in order to ac-curately evaluate the effects of the POC tests on patient time in the ED and therefore the impact on the cost-effectiveness.
POC tests
The POC equivalents of commonly used special investi-gations in the ED were chosen–details are provided in Table2. The POC testing was performed in a private cu-bicle where the LODOX® (LOw-DOse X-ray) machine was located within the ED. All other testing was done as per standard procedure in the ED. Details of the direct cost comparisons of the diagnostic tests and their POC equivalents are depicted in Table2.
POC costs
Costs for the POC blood tests were obtained from the supplier. Capital and maintenance costs of equipment were included in the prices of all tests whether POC or control diagnostic tests therefore no indirect costs were added. Discounting was not applied. Prices for the
control pathway investigations were obtained from the hospital laboratory (blood tests) and radiology depart-ment (X-rays/LODOX®). The cost of the ECG was equivalent in both pathways.
When comparing the costs of the intervention permu-tations to the control group, the costs were calculated as follows:
Control group
All tests as ordered by the doctors were included e.g. if the doctor ordered an ECG and a blood gas, only the costs of those two tests were included for that particular patient.
Intervention POC permutation groups
The costs of the POC tests specific to the group PLUS any additional tests that were ordered by the doctors were included in the total cost e.g. If the doctor ordered an x-ray for a patient who was in the i-STAT + CBC group, the cost of the x-ray was then added to the total cost for that patient.
Staffing costs
The cost calculations were performed as per Schilling’s recommendation [5]. Staffing was considered as evenly distributed throughout the year and calculated using doctor and nursing costs only. Using this method, the cost of one minute of ED staffing was calculated to be US$5.37, which is equivalent to US$0.75 per patient per minute in our ED.
Sample size calculation
The sample size estimation was based on the determin-ation of the effect of workflow pathways within each symptom group that were initially analysed. This re-quired a two-way Analysis of Variance (ANOVA). Based on the detection of at least a medium effect size (f = 0.25 or a 20% difference in times between groups) with 80% power at the 5% significance level, a sample size of 864 patients was required.
Table 1Time frame definitions in the ED
Administrative time Treatment time
Time from patient arrival to doctor evaluation Time from doctor evaluation to disposition decision
All patients go through the same process of opening a file and registering on the hospital system in our ED.
After a disposition decision is made, the patient may or may not timeously leave the ED.
The administrative process can be substantially longer on some days than on other days. This would change the wait-times for the patients prior to them presenting to the doctor and would confound the time measurements overall and therefore impact on the cost analysis.
Exit block may lead to a delay in the patient leaving the ED even if a timeous disposition decision is made.
Outcomes
Treatment time was the main outcome measure for assessing the effectiveness of POC interventions. A dif-ference in treatment time of 20% was considered to be clinically significant –this is higher than that utilised in previous studies (9–18%) [2,9].
The main outcome measure for the cost-effectiveness of upfront, POC tests was the incremental cost effective-ness ratio (ICER).
The ICER was expressed as
ICER¼C1C2=E1E2
where C1 and E1 are the cost and effect (time) in the intervention group and C2 and E2 are the cost and effect in the control group [13].
Statistical analysis
A cost-effectiveness plane was constructed by plotting the effects on the horizontal axis and costs on the verti-cal axis. Further analysis utilised a non-parametric boot-strapping model. This model used the observed data for each permutation which was inserted into an excel tem-plate supplied by Barton et al [14]. For each bootstrap sample, the mean incremental costs and effects were cal-culated and repeated 1000 times. Incremental cost-effectiveness acceptability curves were then calculated from the bootstrap data across a range of increasing po-tentially acceptable costs. This analysis excluded the ef-fects of potential cost-saving related to staffing expenses. Data analysis was carried out using SAS (version 9.4 for Windows). The 5% significance level was used for all statistical analyses.
Results
There were 1134 patients enrolled in the trial. Consecu-tive patients were included during the patient enrolment periods – there was no patient selection. Five patients refused to participate in the study. After exclusions, 1044 patients were randomised. Figure1summarises the patient flow.
During data collection for the primary study, the out-comes in the“psychiatric group”(n= 147) were found to be very different from the other three symptom groups in an interim analysis. The psychiatric patients were seen almost immediately in most cases based on their “ or-ange” triage scores and commonly only needed a single investigation viz. a blood gas analysis. From an ED-throughput perspective it was already functioning opti-mally and the extra testing was not required. Their data was therefore excluded as it would have skewed the re-sults from both a time- and cost perspective. Therefore, 897 patients were included in the analysis.
Ten patients presented to the ED on more than one occasion during the study period and agreed to be en-rolled a second time. They were treated no differently from patients who were seen for the first time. They all signed a new consent form and were randomised yet again. Their inclusion was therefore unlikely to have in-fluenced the study outcomes.
Patient characteristics
A comparison of patient characteristics based on work-flow allocation is tabulated in Table 3. There were no significant differences in age, triage category or Table 2POC tests employed and cost comparisons between
the control pathway tests and their POC equivalents Abbott Point-of-Care i-STAT® System
The i-STAT System utilises single-use i-STAT test cartridges (i-STAT, Ab-bott Point of Care, Princeton, NJ, USA) with a handheld POC blood ana-lyser. The CHEM8+ (sodium, potassium, chloride, total carbon dioxide, ionised calcium, glucose, urea, creatinine, haematocrit, haemoglobin and anion gap) and CG4+ (Lactate; pH; partial pressure carbon dioxide (PCO2); partial pressure of oxygen (PO2); total carbon dioxide; bicarbon-ate; base excess and oxygen saturation) were performed on venous blood specimens.
Abbott CEL-DYN Emerald 22 benchtop haematology system
The CEL-DYN Emerald 22 benchtop haematology system was used. It is capable of providing a POC Complete/Full Blood Count as well as a white blood cell differential count.
ECG
Philips Pagewriter TC30 ECG machines were utilised to obtain the ECGs. All patients randomised to receive an ECG received a standard 12-lead ECG as well as a right-sided (V1R-V6R) and posterior (V7-V9) ECG. The cost of the ECG was the same in both the control and the intervention groups.
LODOX®
A Lodox Xmplar-dr was used by a radiographer to perform the LODOX® (LOw-DOse X-ray) radiographs (chest and abdomen, antero-posterior and lateral). The radiation exposure was approximately 339uGy per pa-tient versus a standard chest and abdomen radiograph of approximately 5200uGy [11]. LODOX® is the radiological equivalent of a POC test as it can provide a full body X-ray within 19 s without the patient leaving the ED. Its utility in trauma patients is reasonably well-known but its use as a diagnostic tool for non-trauma patients in the ED has not been evalu-ated previously [12].
Diagnostic tests Cost Point-of-Care equivalent Cost
Complete Blood Count 4.57 CBC (CEL-DYN Emerald 22)
2.33
Urea, Creatinine, Electrolytes Blood Gas
17.89 i-STAT Chem8 CG4+ 27.61
X-ray 121.58 LODOX® 104.17
TOTAL $ 144.04a TOTAL $ 134.11a
$ Costs shown in US dollars for each individual test
CBCComplete Blood Count,ECGelectrocardiogram,i-STATi-STAT POC tests, LODOX® Low-dose x-ray
a
disposition between the patients enrolled into the con-trol or POC intervention groups.
Treatment times
A 20% reduction in treatment time was exceeded by all POC workflow permutations, except ECG alone and LODOX® alone groups.
With regards to disposition decision, there were no significant differences in treatment times between pa-tients who were ultimately admitted or discharged within particular workflows, or between admission and discharge within particular symptom groups (p= 0.091).
Time taken for POC testing and patient waiting times The patient waiting time to see a doctor after arrival in the ED was on average between 57 and 152 min. It took between 4 and 23 min to obtain the results of the POC tests. This included the time taken for phlebotomy, spe-cimen processing and results printing for the i-STAT and CBC permutations. The blood tests could generally be performed concurrently, however, the LODOX® and ECGs had to be performed sequentially.
Investigation utilisation in the control pathway
There were 78.7% (59/75) patients in the control group who had blood tests and/or a blood gas
analysis. Twenty-four per cent (36/75) had a blood gas analysis only. X-rays were performed in 58.7% (44/75) of patients and 64% (48/75) had ECGs performed.
Costs of investigations
Table 2 lists the costs for the individual investigations. Overall, POC equivalent tests cost US $9.93 less than the standard control investigations if all the tests were performed in a patient.
The time-saving and costs for each workflow is pre-sented in Table4.
Cost effectiveness analysis
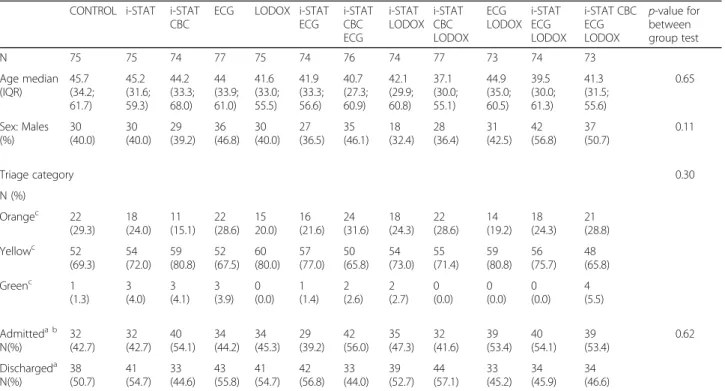
Figure 2 exhibits the Cost Effectiveness Plane (2A), which is a graphical representation of the cost effective-ness analysis as well as the cost-effectiveeffective-ness acceptabil-ity curve (2B).
LODOX®-containing permutations (dashed lines) and non-LODOX®-containing pathways (solid lines) are dem-onstrated using different values for funder willingness-to-pay (λ). Non-LODOX® permutations were virtually 100% cost-effective if an additional cost of US$50 per patient was considered acceptable.
Table 3Patient characteristics based on the twelve workflow allocations
CONTROL i-STAT i-STAT CBC
ECG LODOX i-STAT ECG i-STAT CBC ECG i-STAT LODOX i-STAT CBC LODOX ECG LODOX i-STAT ECG LODOX i-STAT CBC ECG LODOX
p-value for between group test
N 75 75 74 77 75 74 76 74 77 73 74 73
Age median (IQR) 45.7 (34.2; 61.7) 45.2 (31.6; 59.3) 44.2 (33.3; 68.0) 44 (33.9; 61.0) 41.6 (33.0; 55.5) 41.9 (33.3; 56.6) 40.7 (27.3; 60.9) 42.1 (29.9; 60.8) 37.1 (30.0; 55.1) 44.9 (35.0; 60.5) 39.5 (30.0; 61.3) 41.3 (31.5; 55.6) 0.65 Sex: Males (%) 30 (40.0) 30 (40.0) 29 (39.2) 36 (46.8) 30 (40.0) 27 (36.5) 35 (46.1) 18 (32.4) 28 (36.4) 31 (42.5) 42 (56.8) 37 (50.7) 0.11
Triage category 0.30
N (%)
Orangec 22 (29.3) 18 (24.0) 11 (15.1) 22 (28.6) 15 20.0) 16 (21.6) 24 (31.6) 18 (24.3) 22 (28.6) 14 (19.2) 18 (24.3) 21 (28.8)
Yellowc 52 (69.3) 54 (72.0) 59 (80.8) 52 (67.5) 60 (80.0) 57 (77.0) 50 (65.8) 54 (73.0) 55 (71.4) 59 (80.8) 56 (75.7) 48 (65.8)
Greenc 1 (1.3) 3 (4.0) 3 (4.1) 3 (3.9) 0 (0.0) 1 (1.4) 2 (2.6) 2 (2.7) 0 (0.0) 0 (0.0) 0 (0.0) 4 (5.5)
Admitteda b N(%) 32 (42.7) 32 (42.7) 40 (54.1) 34 (44.2) 34 (45.3) 29 (39.2) 42 (56.0) 35 (47.3) 32 (41.6) 39 (53.4) 40 (54.1) 39 (53.4) 0.62 Dischargeda N(%) 38 (50.7) 41 (54.7) 33 (44.6) 43 (55.8) 41 (54.7) 42 (56.8) 33 (44.0) 39 (52.7) 44 (57.1) 33 (45.2) 34 (45.9) 34 (46.6)
CBCComplete Blood Count,ECGElectrocardiogram,IQRinter-quartile range,i-STATi-STAT POC tests,LODOX® Low-dose x-ray a
8.2% of all patients were referred to another speciality as their disposition plan (i.e. neither admitted nor discharged) b
The overall admission rate for this ED is usually 30–35%. This includes all patient presentations e.g. trauma, general surgery, orthopaedics, otorhinolaryngology etc. The medical subgroup of patients typically has a higher admission rate than other patients
c
Discussion
Saving time is an ever-present goal in the ED. However, for upfront POC testing to be viable in the ED, the time-saving benefit needs to be weighed against the cost.
Costs of investigations and cost effectiveness analysis Variations have been reported with respect to the net cost of POC testing [5, 8, 13]. In Sweden, POC was found to be substantially cheaper than the costs of simi-lar tests performed in a laboratory [5]. In Australia, how-ever, test costs were higher in the POC group [6]. Costs have previously been calculated using the direct differ-ences between that of the POC tests and the laboratory
costs without taking the expense of personnel into ac-count [8]. The cost of staffing needs to be taken into ac-count as decreases in test turnaround time could be translated into savings in staffing due to an improved overall processing of the patient from decreased turn-around times as well as quicker diagnosis and ultimately more rapid patient disposition [2,5,8].
In our study, direct head-to-head cost comparison be-tween the POC tests compared to standard laboratory and radiological expenses in our study surprisingly showed a saving of US$9.93 if all the tests had been per-formed on all patients compared to using standard diag-nostic tests. This was mainly as a result of the lower cost of the LODOX® compared to the x-ray and the lower Table 4Costs and time-saving analysis ranked according to net additional cost per patient
Total Average Group Costa (US$ pp)
Difference between costs of POC tests and control
(US$ pp)
Time Saved–Difference between control group time and POC group time
(min)
Staffing costs saved (US$ pp)
ICER - Incremental Cost Effectiveness Ratio
(US$ / min)
Net additional cost per patient in POC group
(US$ pp)
CONTROL 81.86 – – – – –
i-STAT + CBC
82.86 1.00 31 23.21 0.03 −22.21
ECG ONLY 75.96 −5.90 9 6.74 −0.65 −12.63
i-STAT + CBC + ECG
90.73 8.87 26 19.47 0.34 −10.60
i-STAT 92.59 10.73 21 15.72 0.51 −4.99
i-STAT + ECG
95.36 13.50 21 15.72 0.64 −2.22
ECG + LODOX
127.48 45.62 25 18.72 1.82 26.90
i-STAT + ECG + LODOX
143.11 61.25 32 23.96 1.91 37.29
ALL POC TESTS
144.10 62.24 31 23.21 2.01 39.03
i-STAT + LODOX
142.56 60.70 25 18.72 2.43 41.98
i-STAT + CBC + LODOX
146.74 64.88 27 20.22 2.40 44.67
LODOX ONLY
142.09 60.23 9 6.74 6.69 53.49
$ Costs shown in US dollars for each permutation
A negative number indicates a lower cost with the POC test permutation than traditional diagnostic testing
CBCComplete Blood Count,ECGelectrocardiogram,ICERincremental cost effectiveness ratio,i-STATi-STAT POC tests,LODOX® Low-dose x-ray,ppper patient a
cost of the POC CBC compared to the laboratory CBC. Although this comparison of total costs appeared prom-ising, it was necessary to look at the cost-effectiveness of the individual permutations.
When evaluating the cost:benefit ratio for POC testing, it is essential to include the disbursements on staffing. The time a doctor spends with the patient has a cost–if this time can be decreased with POC testing then the
Fig. 2aCost Effectiveness Plane. Permutations in the south-east quadrant were less costly and more effective (also referred to asdominant) [13]. Permutations in the north-east quadrant were still more effective but were also costlier.bEffectiveness Acceptability Curve.
cost of the doctor needs to be included in the cost-effectiveness evaluation [2, 5, 8]. When personnel costs and time-saving were both considered, the net additional savings increased further, with the true benefit of certain test combinations being highlighted.
In Fig. 2, it can be seen that all LODOX®-containing permutations fell into the north-east “more costly but more effective” quadrant. X-ray and LODOX® costs formed the bulk of the expenses related to the diagnostic testing combinations making all the LODOX®-containing options more costly. LODOX® therefore added substan-tially to the cost, without much additional time-saving. Also, only 58.7% of the control group had an x-ray per-formed while 100% of the participants in the respective LODOX® permutations received an x-ray. This lead to an overall additional comparative cost per patient com-pared to the control group despite LODOX® being more inexpensive than a standard x-ray. The addition of a LODOX® in a protocolised fashion may need to be re-evaluated and may perhaps be more valuable if intro-duced only after an admission decision is made. Indis-criminate use of LODOX® on all patients irrespective of whether they require hospital admission would lead to over-testing and unnecessary radiation exposure even if it is relatively low-dose radiation. Some patients also re-ceived a formal x-ray in addition to their LODOX® which increased costs and so was a confounder for the LODOX®-containing groups overall.
While the ECG only group was cost-effective because of a direct saving of US$5.90 per patient, the lack of sig-nificant time-saving makes it ineffectual to assist with ED throughput.
The most cost-effective combination, which ultimately would save money based on the time-saving, was the i-STAT + CBC permutation. It was second in time-saving to i-STAT + ECG + LODOX® by one minute and equiva-lent in saving time to the combination where the pa-tients had all the tests performed. The latter two permutations would require additional spending in order for them to be implemented. With one-third of patients having laboratory testing in general in the ED, the i-STAT + CBC option would fulfil the dual purpose of de-mand and cost-effectiveness [15,16].
The impact of staffing costs
Staffing costs play a significant role in the calculation of cost effectiveness. In a Swedish ED, Schilling showed a significantly higher cost saving than in our study. This was largely due to their higher cost of staffing (US$24.08/min versus our US$5.37/min) [5]. A higher staffing cost would mean that time saved using POC testing is ultimately even more economical. The time-saving could potentially also be used to offset staffing costs. There may be an opportunity to reduce staffing
levels based on reduced treatment times offered by the POC tests. Optimisation of patient processing means that the costs of staffing need to be taken into consider-ation [5].
Value for money–cost-effectiveness acceptability Permutations in the north-east quadrant of the cost-effectiveness plane were more effective than the control but were also costlier. The determination of whether an intervention offers “good” value for money depends on the funder’s willingness to pay (λ) [17]. The range of po-tential amounts that the funder may be considering are displayed on the x-axis of the cost-effectiveness accept-ability curve and can be judged according to the relative probability that an intervention will be cost-effective shown on the y-axis. Figure 2B demonstrates this con-cept with the majority of the permutations still most likely to be cost-effective at a willingness to pay thresh-old of US$50, except for those permutations containing LODOX®.
Non-LODOX® permutations were virtually 100% cost-effective if an additional cost of US$50 per patient was considered acceptable by funders.
This model has been used in previous studies on healthcare cost-effectiveness [13, 14, 17]. It is tool that allows decision-makers to balance up costs against non-quantifiable benefits. For example, a reduced waiting time might not have any direct cost implications, but will increase patient satisfaction. A funder might be will-ing to pay a small additional amount for this but not a large amount. This tool therefore allows the potential funder to better balance the benefits and costs. It also al-lows the funder to balance quantifiable costs e.g. the de-cision whether to close a diagnostic laboratory at night in favour of utilising POC tests.
Waiting times and special investigation use in the ED Waiting for the results of special investigation such as blood tests, ECGs and radiographs commonly takes two-thirds of a patient’s entire ED length of stay [15]. A sub-stantial amount of time could potentially be saved if these test results were available prior to the doctor’s ini-tial evaluation of the patient. In this study, waiting for results of the intervention POC tests was concurrent with the patients’wait to be seen by a doctor (minimum waiting time 57 min). This meant that the time taken to perform the POC tests (maximum 23 min) did not cause any significant delays for the patients as it took place during non-valued added time when the patients were waiting to see the doctor.
These interventions were associated with longer lengths of stay [15]. In the USA, Gardner et al. found that 33% of patients had laboratory investigations (increasing length of stay by 35.4 to 40.1 min) and 36% had x-rays (increased by 5 to 15 min) [18]. Thirty per cent of dis-charged patients in a Finnish study by Kankaanpää et al. needed laboratory testing [19]. The laboratory usage in our control group of 30% (excluding patients who had blood gas analyses alone) is similar to the utilisation in these other EDs. The x-ray utilisation rate was higher, however. This may have been due to the higher admis-sion rate at our hospital of 42.7% (versus 11% in the Gardner study) as all patients admitted to the internal medicine service receive an x-ray.
All patients in an i-STAT-containing subgroup in our study showed a decreased treatment time. Although the performance of a LODOX® scan took only on average four and a half minutes, time-saving was only achieved when it was combined with other POC tests. This was similar to the time-saving gained by the performance of an upfront ECG. Gardner et al. found that ECGs only saved time (2.7 min) in those patients who were admit-ted but added time in patients who were ultimately dis-charged [18]. In our study, there was no difference in the number of tests performed regardless of disposition decision i.e. whether a patient was ultimately admitted to the hospital or discharged.
Standing orders versus upfront POC testing and“ over-testing”
In the ED, standing orders have been shown to improve patient throughput by reducing disposition time by up to 16.9% [20]. However, these orders are usually only actioned if the ED is full; have had variable uptake by the nursing staff resulting in both over- and under-testing and have not made use of POC devices [16, 20]. Over-testing is frequently quoted as a danger when standing orders are in place or when POC testing is made easily available. There is, however, no evidence to support this [16, 21–23]. In Retezar’s study evaluating triage standing orders, those patients who received the full gamut of tests had a 16% reduction in their mean treatment times. The hypothesis that upfront, protoco-lised testing leads to over-testing is nullified by her study findings where 98 % of the patients who did not receive the standing orders went on to receive similar investiga-tions once they were seen by a doctor [24]. The cost of POC usage would therefore be unlikely to be exagger-ated compared to standard diagnostic test utilisation. In our study, over-testing was possible in the patients who were ultimately admitted to the internal medicine ser-vice. Blood tests are commonly performed as a courtesy for those patients even if the results do not impact on
the ED disposition decision. These were extra standard blood tests and not POC tests.
Other potential cost implications
Besides these direct costs, there is also the potential for further cost-saving that may be possible by reducing ad-mission rates. In Fitzgerald et al’s RATPAC trial, which focussed on patients with chest pain in suspected myo-cardial infarction, POC testing was associated with higher ED costs but lower general inpatient costs [7].
Other non-fiscal “cost savings” should also be evalu-ated in future POC cost-effectiveness analyses. Although we did not collect data on the patient experience, we ac-knowledge that their input would have been useful as part of the overall impact of the intervention. The very low refusal rate may have suggested that patients favoured this system, but no direct data were collected.
The doctors’ perceptions of the effectiveness and ap-propriateness of the upfront POC testing were evaluated as part of this study. They were strongly supportive of the intervention [25].
Further possible positive effects which need to be quantified include the beneficial knock-on effects of de-creases in patient complaints due to excess waiting times, increases in staff satisfaction, and the potential for fewer patients leaving the ED without being seen. This will require future investigation.
Patient sub-groups that could benefit from upfront POC testing
Although the symptom groups originally included in the study characterised typical categories of undifferentiated pa-tients that present to the ED, interim analysis highlighted that the “psychiatric group” was already functioning opti-mally based on their high acuity triage scores as well as the limited special investigations that they required for safe pa-tient disposition. The use of upfront POC testing in this group of patients would therefore have no time- or cost benefit. Upfront testing appeared to be most appropriate for the undifferentiated medical patient and the ultimate cost-effectiveness in any ED would depend on the case mix presenting to that ED.
Hospital admission rates and patient acuity
more ill than the non-medical patient population. They are also the patient group that would potentially benefit most from upfront POC testing. Therefore, it is unlikely that the high level of significant illness was an important source of bias in this study. There was a range of triage categories within each group (not significantly different) that further suggests that this was not an important bias. Furthermore, upfront POC testing is not suggested to be used in all patients presenting to the ED. Clearly some patients would not benefit (e.g.minor orthopaedic injur-ies), but it would be best applied to patients with undif-ferentiated medical presentations. This does mean, however, that EDs that see very few sick patients would benefit less from upfront POC testing.
Limitations
This single-centre study evaluated the impact of POC on the treatment time but there was no data collected nor as-sessment of the effect on patient outcome and potential ad-verse effects of universal testing. However, in previous POC studies, there has been no evidence to support the theory of over-testing [16, 21–23]. The patient medical complaints were heterogeneous. Whilst they were common symptoms in our ED, they may not be representative of other EDs. This was notable with regards to the low incidence of acute coronary syndrome-related chest pain. POC troponin was originally included as one of the i-STAT tests used in our study. Although troponin has been shown to be useful for patients with chest pain or suspected acute coronary syn-drome in the ED as well as the presence of raised troponin levels having an association with worse short-term clinical outcomes, we ultimately excluded it for the cost-effectiveness analysis as there would be no benefit for our ED population and would have resulted in over-testing [26, 27]. Similarly, the indiscriminate use of D-dimer testing in this heterogenous population without employing pre-test probability scoring could potentially have been harmful and could also have resulted in over-testing. Therefore D-dimer testing was not included in the upfront testing. As the ED doctors were not blinded to which patients received the up-front POC tests, a Hawthorne-type effect was considered, but there was no evidence to support it. However, as the doctors themselves were recording all the times (and not an impartial observer), this could have been a potential source of error. Due to the funding of allied hospital staff being managed separately, staffing costs were calculated using doctor and nursing costs only. The costs related to x-rays and LODOX® were based on the standard prices charged per patient per investigation as opposed to calcula-tions based on the equipment amortisation costs. The dif-ferent setup costs of a laboratory and of a POC system were also not taken into account. The performance of“ ad-mission tests” for the internal medicine service may have
also confounded the diagnostic test utilisation. This may have lead to duplication of tests if the patient was admitted.
Conclusion
POC testing in the ED was more cost-effective, in certain combinations, than standard diagnostic tests when utilised upfront for patients with undifferenti-ated common medical complaints in non-resuscitation triage categories. The most economical POC test combination was i-STAT + CBC, which not only saved time, but, also saved the most money per pa-tient. Besides these direct costs, there is also the po-tential for further cost-saving that may be possible by reducing hospital admission rates as well as the other non-fiscal “cost savings”. These should be evaluated in future POC cost-effectiveness analyses.
Abbreviations
ANOVA:Analysis of Variance; CBC: Complete Blood Count; CG4+: i-STAT test which includes Lactate; pH; partial pressure carbon dioxide (PCO2); partial pressure of oxygen (PO2); total carbon dioxide; bicarbonate; base excess and oxygen saturation; CHEM8+: i-STAT test which includes sodium, potassium, chloride, total carbon dioxide, ionised calcium, glucose, urea, creatinine, haematocrit, haemoglobin and anion gap; ECG: Electrocardiogram; ED: Emergency Department; ICER: incremental cost effectiveness ratio; IQR: inter-quartile range; i-STAT: i-STAT system point-of-care tests;λ: funder willingness-to-pay; LODOX®: Low-dose x-ray; POC: Point-of-Care; pp: per patient
Acknowledgements
We appreciate the support of Mxolisi Ncube, Abbott Point-of-Care, South Af-rica and the commitment of our research assistant, Helen de Vos. We are thankful to the medical and allied staff in the Emergency Department at Helen Joseph Hospital for their assistance.
Authors’contributions
LG conceptualized the study, designed the trial and obtained research funding. CVL assisted with research funding and University approval. LG supervised the conduct of the trial and data collection. LG and MW were involved in the statistical analysis and interpretation of data. LG drafted the initial version of the manuscript. All authors revised, edited and contributed substantially to the critical revision of the manuscript. Final approval of the version to be published is made by all authors who agree to be accountable for all aspects of the work in ensuring that questions related to the accuracy or integrity of any part of the work are appropriately investigated and resolved. LG takes responsibility for the paper as a whole.
Funding
Abbott Point-of-Care (Princeton, NJ, USA) provided the i-STAT machines, car-tridges and sponsorship for the research assistant for 6 months as well as stationery costs. Abbott Diagnostics (Abbott Laboratories SA (Pty) Ltd) pro-vided the Emerald CBC machine and consumables. LODOX Critical Imaging Technology provided the radiographers to perform the LODOX x-rays. Philips SA loaned us 2 ECG machines for the duration of the data collection. The manufacturers had no role in the study design, the conduct of the study, the data analysis or the preparation of the manuscripts.
Availability of data and materials
The datasets used and/or analysed during the current study are available from the corresponding author on reasonable request.
Ethics approval and consent to participate
Permission to conduct the study was granted by the Research Ethics Committee of the Faculty of Health Sciences of the University of
Research Ethics Council (DOH-27-0117-5628); and was registered as a clinical trial with the South African National Health Research Database
(GP_2017RP57_655) as well as with clinicaltrials.gov (NCT03102216). Written informed consent was obtained from all patients.
Consent for publication Not applicable.
Competing interests
The authors declare that they have no competing interests.
Received: 8 July 2019 Accepted: 20 November 2019
References
1. Hoot NR, Aronsky D. Systematic review of emergency department crowding: causes, effects, and solutions. Ann Emerg Med. 2008;52(2):126–36.
https://doi.org/10.1016/j.annemergmed.2008.03.014.
2. Lee-Lewandrowski E, Corboy D, Lewandrowski K, Sinclair J, McDermot S, Benzer TI. Implementation of a point-of-care satellite laboratory in the emergency department of an academic medical center. Arch Pathol Lab Med. 2003;127(4):456–60.https://www.ncbi.nlm.nih.gov/pubmed/12683874. 3. Boyle A, Beniuk K, Higginson I, Atkinson P. Emergency department
crowding: time for interventions and policy evaluations. Emerg Med Int. 2012;2012:838610.https://doi.org/10.1155/2012/838610.
4. Rooney KD, Schilling UM. Point-of-care testing in the overcrowded emergency department--can it make a difference? Crit Care. 2014;18(6):692.
https://doi.org/10.1186/s13054-014-0692-9.
5. Schilling UM. Time is money—the economic impact of point of care on the emergency Department of a Tertiary Care University Hospital. Point Care. 2014;13(1):21–3.https://doi.org/10.1097/poc.0000000000000003. 6. Asha SE, Chan ACF, Walter E, et al. Impact from point-of-care devices on
emergency department patient processing times compared with central laboratory testing of blood samples: a randomised controlled trial and cost-effectiveness analysis. Emerg Med J. 2014;31:714–9.https://doi.org/10.1136/ emermed-2013-202632.
7. Fitzgerald P, Goodacre SW, Cross E, Dixon S. Cost-effectiveness of point-of-care biomarker assessment for suspected myocardial infarction: the randomized assessment of treatment using panel assay of cardiac markers (RATPAC) trial. Acad Emerg Med. 2011;18(5):488–95.https://doi.org/10.1111/ j.1553-2712.2011.01068.x.
8. Singer AJ, Williams J, Taylor M, Le Blanc D, Thode HC Jr. Comprehensive bedside point of care testing in critical ED patients: a before and after study. Am J Emerg Med. 2015;33(6):776–80.https://doi.org/10.1016/j.ajem. 2015.03.034.
9. Goldstein LN, Wells M, Vincent-Lambert C. A randomized controlled trial to assess the impact of upfront point-of-care testing on emergency department treatment time. Am J Clin Pathol. 2018;150(3):224–34.https:// doi.org/10.1093/ajcp/aqy042.
10. Wiler JL, Gentle C, Halfpenny JM, et al. Optimizing emergency department front-end operations. Ann Emerg Med. 2010;55(2):142–60.e1.https://doi.org/ 10.1016/j.annemergmed.2009.05.021.
11. Potgieter JH, de Villiers M, Scheelke M, de Jager G. An explanation for the extremely low, but variable radiation dosages measured in a linear slit scanning radiography system. Proceed SPIE. 2005;5745:1138–45.https://doi. org/10.1117/12.595216.
12. Yang L, Ye LG, Ding JB, Zheng ZJ, Zhang M. Use of a full-body digital X-ray imaging system in acute medical emergencies: a systematic review. Emerg Med J 2014;0:1–8. doi:https://doi.org/10.1136/emermed-2014-204270. 13. St John A, Price CP. Economic Evidence and Point-of-Care Testing. Clin
Biochem Rev. 2013;34(2):61–74 PMCID: PMC3799220 PMID: 24151342. 14. Barton GR, Briggs AH, Fenwick EA. Optimal cost-effectiveness decisions: the
role of the effectiveness acceptability curve (CEAC), the cost-effectiveness acceptability frontier (CEAF), and the expected value of perfection information (EVPI). Value Health. 2008;11(5):886–97.https://doi. org/10.1111/j.1524-4733.2008.00358.x.
15. Yoon P, Steiner I, Reinhardt G. Analysis of factors influencing length of stay in the emergency department. CJEM. 2003;5(3):155–61.https://doi.org/10. 1017/s1481803500006539.
16. Jang JY, Shin SD, Lee EJ, Park CB, Song KJ, Singer AJ. Use of a
comprehensive metabolic panel point-of-care test to reduce length of stay
in the emergency department: a randomized controlled trial. Ann Emerg Med. 2013;61(2):145–51.https://doi.org/10.1016/j.annemergmed.2012.07.021. 17. Fenwick E, Marshall DA, Levy AR, Nichol G. Using and interpreting
cost-effectiveness acceptability curves: an example using data from a trial of management strategies for atrial fibrillation. BMC Health Serv Res. 2006;6:52.
https://doi.org/10.1186/1472-6963-6-52.
18. Gardner RL, Sarkar U, Maselli JH, Gonzales R. Factors associated with longer ED lengths of stay. Am J Emerg Med. 2007;25(6):643–50.https://doi.org/10. 1016/j.ajem.2006.11.037.
19. Kankaanpää M, Raitakari M, Muukkonen L, et al. Use of point-of-care testing and early assessment model reduces length of stay for ambulatory patients in an emergency department. Scand J Trauma Resusc Emerg Med. 2016; 24(1):125.https://doi.org/10.1186/s13049-016-0319-z.
20. Hwang CW, Payton T, Weeks E, Plourde M. Implementing Triage Standing Orders in the Emergency Department Leads to Reduced Physician-to-Disposition Times. Adv Emerg Med. 2016;7213625:6.https://doi.org/10.1155/ 2016/7213625.
21. Goodacre SW. Point-of-care testing may reduce length of stay but not emergency department crowding. Ann Emerg Med. 2013;61(2):153–4.
https://doi.org/10.1016/j.annemergmed.2012.09.001.
22. Hoffman JR, Cooper RJ. Overdiagnosis of disease: a modern epidemic. Arch Intern Med. 2012;172(15):1123–4.https://doi.org/10.1001/archinternmed. 2012.3319.
23. Begaz T, Elashoff D, Grogan TR, Talan D, Taira BR. Initiating diagnostic studies on patients with abdominal pain in the waiting room decreases time spent in an emergency department bed: a randomized controlled trial. Ann Emerg Med. 2017;69(3):298–307.https://doi.org/10.1016/j.
annemergmed.2016.06.040.
24. Retezar R, Bessman E, Ding R, Zeger SL, McCarthy ML. The effect of triage diagnostic standing orders on emergency department treatment time. Ann Emerg Med. 2011;57(2):89–99.e2.https://doi.org/10.1016/j.annemergmed. 2010.05.016.
25. Goldstein LN, Wells M, Vincent-Lambert C. Doctors’perceptions of the impact of upfront point-of-care testing in the emergency department. PLoS One. 2018;13(12):e0208655.https://doi.org/10.1371/journal.pone.0208655. 26. Singer AJ, Ardise J, Gulla J, Cangro J. Point-of-care testing reduces length of
stay in emergency department chest pain patients. Ann Emerg Med. 2005; 45(6):587–91.https://doi.org/10.1016/j.annemergmed.2004.11.020. 27. Meigher S, Thode HC, Peacock WF, Bock JL, Gruberg L, Singer AJ. Causes of
elevated cardiac troponins in the emergency department and their associated mortality. Acad Emerg Med. 2016;23(11):1267–73.https://doi.org/ 10.1111/acem.13033.
Publisher’s Note
![Fig. 2 a Cost Effectiveness Plane. Permutations in the south-east quadrant were less costly and more effective (also referred to as dominant) [13].](https://thumb-us.123doks.com/thumbv2/123dok_us/8111084.2150847/8.892.90.804.133.867/effectiveness-plane-permutations-quadrant-costly-effective-referred-dominant.webp)
