Original Research Article
What affect heart in SAM: structure or function
Ashutosh Kumar Sharma, Ajay Gaur*, Neetu Sharma Agrawal
INTRODUCTION
It has been estimated that in India, 65% i.e. nearly 80 million children under five years of age suffer from varying degrees of malnutrition. The prevalence of malnutrition varies across states; with Madhya Pradesh recording the highest rate (55 per cent).1
The NFHS (2006) put the number of malnourished children in this central Indian state (Madhya Pradesh) at a whopping 6 million which is over 60 per cent of its total number of children under 5 years of age. Out of these 6 million malnourished children, 1.3 million have Severe
Acute Malnutrition (SAM).2 According to the National
Family Health Survey (NFHS-4) carried out in 2015-16, child malnutrition rates in India are disproportionately high. The NFHS-4 is the 4rth pan-India survey conducted since 1992 covering 200,000 people from 15-54 years, and the definitive guide to Indian health statistics. The results are sobering: 42.8 percent of children under three are underweight, compared with 28 per cent in Sub-Saharan Africa. In addition to the 42.8 percent who are underweight, 42 percent are stunted, 20 percent severely malnourished and 68.9 percent anaemic. According to NFHS 4 data 25.8 percent of total under 5-year children are wasted in which 9.2 % are severely wasted.3 The
ABSTRACT
Background: Objective of present study was to assess structural and functional cardiac changes in children with severe acute malnutrition between the age of 6 month to 59 months. Setting: The study conducted in Department of paediatrics, Kamla Raja Hospital, Gajra Raja Medical College, Gwalior. A prospective case control study. Participants: 100 cases and 100 controls enrolled based on the selection criteria, Control group was selected from patient came in Out Patient Department. Children from 6 months to 59 months of age with weight for height ranging <-3SD and/or Mid Upper Arm Circumference (MUAC) <11.5 cm and/or edematous malnutrition and/or visible severe wasting). Selection of cases and control were done through random sampling method.
Methods: All enrolled admitted children were stabilised after admission as per WHO protocol of management. After that they undergone echocardiographic and electrocardiographic evaluation and data were collected and Analysed.
Results: In this study, study group show decrease in dimension of heart i.e. IVSd value-0.02413), LVEDd (p-value-0.0000017), PLVWd (p-value-0.01493), LVEDs (p-value-0.0000263), PLVWs (p-value-0.0000254) more affected during diastole than systole, increased HR (p-value-0.0044), shorten PR intervals (p-value-0.0001) and shorten P wave(p-value-0.000385), QT (p-value-0.044) and QTc (p-value-0.00968) as compared to control group. Pericardial effusion found in 16 cases in study group (8 mild and 8 trace).
Conclusions: Early evaluation of cardiac function in malnourished child will significantly affect the management of Severe Acute Malnutrition to prevent deaths from Severe Acute Malnutrition.
Keywords: Ejection fraction, Fraction shortening, Interventricular septum, Left ventricular end diastolic diameter, Mid upper arm circumference, Posterior left ventricular wall thickness
Department ofPediatrics, Gajra Raja Medical College, Gwalior, Madhya Pradesh, India
Received: 29 June 2017
Accepted: 03 July 2017
*Correspondence:
Dr. Ajay Gaur,
E-mail: [email protected]
Copyright: © the author(s), publisher and licensee Medip Academy. This is an open-access article distributed under the terms of the Creative Commons Attribution Non-Commercial License, which permits unrestricted non-commercial use, distribution, and reproduction in any medium, provided the original work is properly cited.
prevalence of malnutrition varies across states, with Madhya Pradesh recording the highest rate (55 per cent) and Kerala among the lowest (27 per cent).
Severe Acute Malnutrition (SAM), is defined as weight-for-height below - 3SD of the median WHO growth reference and/or MUAC <11.5 cm, visible severe wasting, presence of symmetrical bipedal edema.
Severe Acute Malnutrition (SAM) affects tissue protein throughout the body and causes pronounced wasting of skeletal muscles. In view of this, it is surprising that little attention has been paid to the probability of getting the heart muscle affected and the possibility of compromising the cardiac functions. By the general atrophy of all muscular tissues, the heart also gets affected but less severely. Although the heart is usually normal or small in size radiologically, cardiomegaly has been found in nonedematous SAM infants.4 On the
contrary, the heart is underweight if it is edematous SAM. Early literature describes the appearance of the heart in wasting diseases as having “brown atrophy" with emphasis on the smallness of heart shadow on X-rays. Other changes include myocardial fiber atrophy with variations in fiber size, vacuolations within the cells, fading of the striations, and changes in nuclei. These changes are mostly found in the left ventricle and the conducting tissue. All these pathological changes lead to disturbed cardiac functions in the electrical activity of the heart that may be reflected in the electrocardiogram (ECG).5 However, studies on electrocardiographic and
echocardiographic changes in Malnutrition are scant. To a great extent, SAM is one of the leading causes of mortality and morbidity in the pediatric population in developing countries.6
It is prevalent in the Gwalior district of Madhya Pradesh in India having a high incidence of low birth weight babies, low literacy rate, and poverty. There are still gaps in our knowledge regarding Severe Acute Malnutrition especially with regard to cardiac functions. An attempt has been made in this study to analyze the cases of Severe Acute Malnutrition, especially with regard to echocardiographic and electrocardiographic changes, and to correlate these changes in relation to the clinical picture and cardiac status.
METHODS
The present study was conducted in Department of paediatrics, Kamla Raja Hospital, Gajra Raja Medical college of Gwalior from July 2015- August 2016. Ethical approval for this study was obtained from Institutional Ethical Committee of G.R. Medical college, Gwalior. The study was conducted in children 6 months to 5 years. SAM cases and controls were taken randomly from admitted patient using WHO diagnosis. Written and informed consent was obtained from the parents or legal guardians prior to study. All Children in the study were examined and relevant baseline characteristics
(anthropometric measurements, dietary history regarding breast feeding, socioeconomic status, birthweight, gestation age, type of delivery, place of delivery, primary care provider, immunization) were taken. All enrolled admitted children were stabilized after admission as per WHO guidelines for SAM management. After that they undergone echocardiographic and electrocardiographic evaluation and data were collected. Conclusion was drawn statistically to correlate outcome. Statistical analysis was done using SPSS 20 software and Microsoft Excel.
RESULTS
This study was done in 100 children with SAM in case group as well 100 children in control group. Various baseline parameter and anthropometric measurements are taken comparable in both case group and control group (Table 1).
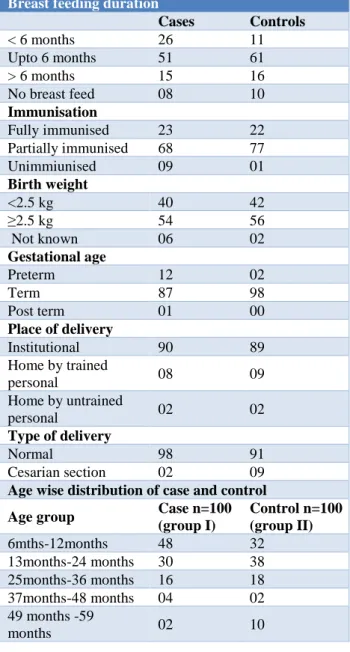
Table 1:Distribution of causative risk factors of SAM.
Breast feeding duration
Cases Controls
< 6 months 26 11
Upto 6 months 51 61
> 6 months 15 16
No breast feed 08 10
Immunisation
Fully immunised 23 22
Partially immunised 68 77
Unimmiunised 09 01
Birth weight
<2.5 kg 40 42
≥2.5 kg 54 56
Not known 06 02
Gestational age
Preterm 12 02
Term 87 98
Post term 01 00
Place of delivery
Institutional 90 89
Home by trained
personal 08 09
Home by untrained
personal 02 02
Type of delivery
Normal 98 91
Cesarian section 02 09
Age wise distribution of case and control
Age group Case n=100 (group I)
Control n=100 (group II)
6mths-12months 48 32
13months-24 months 30 38
25months-36 months 16 18
37months-48 months 04 02
49 months -59
Present study shows 51% of study group are exclusively breast feeded as compared to control group i.e. 61%, while 68% of study group are partially immunized as compared to control 77%, birth weight >2.5kg found in 54% of cases as compared to control 56%, while birth weight <2.5kg found in 40% of study group as compared
to 42% in control, while 90% of study group born term as compared to control 98%. 90% child in study group born in institution as compared to control 89%, while 98% of study group born normal as compared to control group 91%.
Table 2: Comparison of echocardiographic parameter.
Parameter Cases (SAM) n=100; (mean±SD) Control n=100; (mean±SD) P value
IVSD(cm) 0.5105±0.1547 0.5565±0.13039 0.02413
LVEDD(cm) 2.216±0.7320 2.647±0.13039 0.0000017
PLVWD(cm) 0.7165±0.5846 0.568±0.13734 0.01493
IVSS(cm) 0.8676±0.3963 0.8055±0.1527 0.1475
LVEDS(cm) 1.4106±0.5429 1.6875±0.3342 0.0000263
PLVWS(cm) 0.7368±0.1659 0.8355±0.1565 0.0000254
FS 36.01±5.5695 37.19±5.34 0.1281
EF 67.45±7.2771 68.86±6.91 0.1617
Pericardial effusion 16 00
(p<.001-highly significant, p<.05-significant, p>.05-insignificant)
Table 3: Comparison of electrocardiographic parameter.
ECG parameter
Rate (per min)
PR interval (sec)
RR (sec) P wave (sec)
QRS
(sec) QT (sec)
QTc (sec)
ST segment (sec)
T (sec)
Cases (SAM) n=100 (mean±SD)
131.88± 21.62
0.1148± 0.017
0.4687± 0.9224
0.058± 0.199
0.0416± 0.9224
0.2712± 0.0423
0.3974± 0.053
0.0784± 0.028
0.1404± 0.0403
Control n=100 (mean±SD)
123.61± 18.92
0.1252± 0.01920
0.4784± 0.0789
0.068± 0.0184
0.04784± 0.0789
0.2844± 0.0495
0.4182± 0.059
0.0816± 0.2269
0.148± 0.2814
P value 0.0044 0.0001 0.4253 0.000385 0.4253 0.044 0.00968 0.379 0.1244
p<.001-highly significant, p<.05-significant, p>.05-insignificant
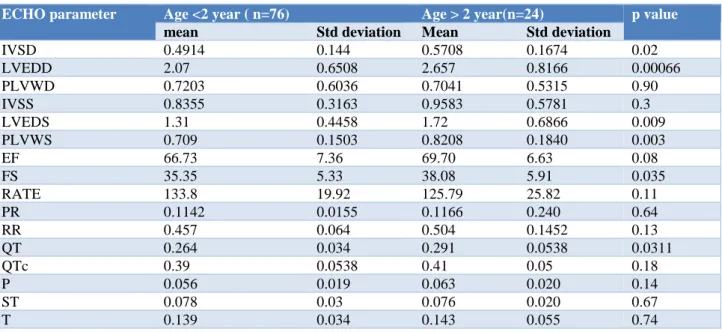
Table 4: Correlation of age and cardiac size and function.
ECHO parameter Age <2 year ( n=76) Age > 2 year(n=24) p value
mean Std deviation Mean Std deviation
IVSD 0.4914 0.144 0.5708 0.1674 0.02
LVEDD 2.07 0.6508 2.657 0.8166 0.00066
PLVWD 0.7203 0.6036 0.7041 0.5315 0.90
IVSS 0.8355 0.3163 0.9583 0.5781 0.3
LVEDS 1.31 0.4458 1.72 0.6866 0.009
PLVWS 0.709 0.1503 0.8208 0.1840 0.003
EF 66.73 7.36 69.70 6.63 0.08
FS 35.35 5.33 38.08 5.91 0.035
RATE 133.8 19.92 125.79 25.82 0.11
PR 0.1142 0.0155 0.1166 0.240 0.64
RR 0.457 0.064 0.504 0.1452 0.13
QT 0.264 0.034 0.291 0.0538 0.0311
QTc 0.39 0.0538 0.41 0.05 0.18
P 0.056 0.019 0.063 0.020 0.14
ST 0.078 0.03 0.076 0.020 0.67
While 48 % of study group belong to 6 months to 12 months of age, 30% between age 13 months to 24 months as compared to control 32 % belong to 6 months to 12 months, 38% between age of 13 months to 24 months. Fifty seven percent belong to kuppuswamy scale 5 in study group as compared to 31% in control.
In this study, (Table 2) study group shows decrease in dimension of heart i.e. IVSd (p-value-0.02413), LVEDd (p-value-0.0000017), PLVWd (p-value-0.01493), LVEDs (p-value-0.0000263), PLVWs (p-value-0.0000254) more affected during systole than diastole, increased HR(p-value-0.0044), shorten PR intervals (p-value-0.0001) and shorten P wave(p-value-0.000385), QT (p-value-0.044) and QTc (p-value-0.00968) as compared to control group (Table 3). Pericardial effusion found in 16 cases in study group (8 mild and 8 trace).
In age, wise analysis done in study group. 76 children which are less than 2 year shows IVSD (p-value-0.02), LVEDd (p-value-0.00066), LVEDs (p-value-0.009), PLVWs value0.003), FS value -0.035), QT (p-value-0.03) as compared to study group child more than 2 year (24 case) (Table 4).
DISCUSSION
The results of the cardiac assessment of Malnourished patients in the present study revealed many significant ECG and echocardiographic abnormalities compared to the controls. As regards the ECG recordings, the PR interval which represents the intra-atrial as well as atrioventricular conduction time was found to be shorter in study groups (0.114±0.017) compared to the controls (0.125±0.019) but this represents the function of the specialized, myofibrils of the conduction pathway which could be disturbed due to the decrease in muscle mass.7
In the present study group After rehabilitation, there was significant decrease in QTc interval (0.3974±0.053) in edematous and nonedematous SAM groups indicating improvement of the myocardial ability to repolarize as compared to control group (0.4182±0.059). In contrast, no prolongation of QT interval was detected in the study performed by Bergman et al.9 While in earlier study ECG
recording done on the day of admission shows prolongation of QTc interval. Similar results were recorded by Olowonyo et al.6 Smythe et al also
documented the prolongation of QTc in his study on malnourished children.10 Moreover, Isner et al confirmed
this observation and further implicated QT prolongation as a factor predisposing for sudden death, but they could not show this consistently in their patients who subsequently died.
The echocardiography evaluation revealed reduction in the LV end-diastolic volume in proportion to decrease in body size in study group patients (2.21±0.73) cm compared to the control group (2.64±0.13) cm. Similar results were recorded by Kothari et al and Singh et al.4,11
The present study also showed that the parameters of LV systolic function which are the ejection fraction (67.45±7.27), fraction shortening (36.01±5.56) were not significantly affected in patients as compared to the controls ejection fraction (68.86±6.91) (p-value 0.1617), fraction shortening (37.19±5.34) (p-value 0.1281). However, some patients showed borderline systolic function. This is in agreement with Ocal et al.12
The present work showed that children with SAM either edematous or nonedematous had significantly smaller cardiac mass as compared to well-nourished children.
Cunha et al recorded that malnourished individuals have lighter hearts.13 Ocal et al stated that the most significant
reduction in LV mass, septal and postwall thickness was found in edematous SAM group.12 In addition, the
cardiac involvements in patients with non-edematous and edematous SAM were similar in the study conducted by Kothari et al and Bergman et al stated that, although primary myocardial dysfunction is not present in edematous SAM, there is a decreased myocardial mass, which may lead to an inability of the ventricles to respond to increases in ventricular preload.4,9 Moreover,
Shoukry et al reported similar findings to present study, namely the reduced myocardial mass in Malnutrition.14
Phornphatkul C et al observed decrease cardiac mass among children with SAM during admission to the hospital and recovered subsequent to nutritional therapy.5
All children had echocardiographic and Doppler measurements indicative of impaired ventricular function which significantly improved during the course of hospitalization, as evidence in part by the change in fractional shortening, (P=0.015) mean velocity of circumferential fibre shortening, (P=0.038) and systolic time interval (P=0.03). They concluded that children with severe Acute malnutrition not only have cardiac mass wasting, but also have inherent ventricular dysfunction as the result of severe malnutrition that respond to nutritional therapy
Olowonyo MT et al recorded ECG, serum electrolyte, serum albumin, hematocrit and cardiothoracic ratio in 19 Nigerian children with edematous SAM and 90 age and sex matched controls.6 The ECG abnormalities observed
good (p<0.001). These finding suggest that ECG changes in edematous SAM are due to myocardial atrophy.
Children with severe Malnutrition have a smaller and thinner heart and a lower stroke volume.15 The inability
of the kidneys to adequately excrete excess fluid and sodium in marasmic-kwashiorkor and kwashiorkor also adversely affects the heart. Thus, the circulation is overloaded more easily than usual. The cell membranes of the heart become leaky because of oxidative damage.15
The number of Na-K pumps in the cell membrane is reduced so as to conserve energy and the remaining pumps work more slowly. Thus, intracellular sodium accumulation and potassium leakages occur, leading to electrolyte and fluid imbalance.15
Ogunkunle OO et al performed Echocardiography, ECG and chest radiography in 44 children with edematous SAM, and 44 age and sex matched controls.16 In patient
with edematous SAM, mean values obtained for end diastolic dimension and systolic dimension, posterior ventricular wall thickness and shortening fraction was significantly smaller than the corresponding values obtained in the controls. Similarly, mean cardiothoracic ratio and QRS amplitude were significantly smaller in subjects than controls (P<0.001). In these subjects, there were very good correlation between the posterior wall thickness and cardiothoracic ratio, and also between estimated left ventricular mass and SI + R6 amplitude (p<0.01).
During recovery, cardiac abnormality is common.17 In
one test series of Smythe et al out of 98 infants with PEM died during therapy.13,17 Hypervoluemia associated with
mobilization of edema fluid and severe anaemia imposed excessive loads on the atrophic myocardium.17 A
hypermetabolic state accompanied by an increase in heart rate, blood pressure, cardiac output ensued.17 Large blood
transfusion and high sodium diet may also have contributed to the heart failure.17 Wharton et al also
reported increased heart rate in malnourished child during recovery. Congestive cardiac failure is common during first week of treatment.17
Table 5: What is already known?
What is already known?
Myocardial mass is reduced in malnourished children. Systolic function is more affected than diastolic function during admission.
What the study adds?
Pericardial effusion found in significant number in study group as compared to control, pediatricians should be aware of Pericardial effusion as a complication of SAM.
Present study shows systolic function are more affected after stabilisation.
Though SAM child is stabilised in first 24 hours, but Heart preferably systolic function needs monitoring
Funding: No funding sources Conflict of interest: None declared
Ethical approval: The study was approved by the Institutional Ethics Committee
REFERENCES
1. National family health survey 3 (2006). Avaialble at http://www.rchiips.org/nfhs/nfhs3.shtml. Accessed on 02/11/14.
2. Malnutrition in Madhya Pradesh - An Overview.
Available at www.malnourishedkids.
blogspot.in/2012/10. Accessed on 3/11/14
3. National family health survey 4 (2015) data. Available at rchiips.org/nfhs/factsheet_nfhs-4.shtml Accessed on 20/05/13.
4. Kothari SS, Patel TM, Shetalwad AN, Patel TK. Left ventricular mass and function in children with severe protein energy malnutrition. Int J Cardiol. 1992;35:19-25.
5. Phornphatkul C, Pongprot Y, Suskind R, George V, Fuchs G. Cardiac function in malnourished children. Clin Pediatr (Phila). 1994;33:147-54.
6. Olowonyo MT, Akinbami FO, Ogunkunle OO,
Jaiyesimi F. The electrocardiographic changes in kwashiorkor. Ann Trop Paediatr. 1993;13:293-8. 7. De Onis M, Monteiro C, Akré J, Glugston G. The
worldwide magnitude of protein-energy
malnutrition: an overview from the WHO global database on child growth. Bull World Health Organ 1993;71:703-12.
8. El-Sayed HL, Nassar MF, Habib NM, Elmasry OA,
Gomaa SM. Structural and functional affection of the heart in protein energy malnutrition patients on admission and after nutritional recovery. Eur J Clin Nutr. 2006;60(4):502-10.
9. Bergman JW, Human DG, De Moor MM, Schulz JM. Effect of kwashiorkor on the cardiovascular system. Arch Dis Child. 1988;63:1359-62.
10. Smythe PM, Swanepoel A, Campbell JA. The heart in kwashiorkor. BMJ. 1962;13:67-73.
11. Singh GR, Malathi KE, Kasliwal RR, Ommar A, Padmavati S, Ramji S. An evaluation of cardiac function in malnourished children by non-invasive methods. Indian Pediatr. 1989;26:875-81.
12. Ocal B, Unal S, Zorlu P, Tezic HT, Oguz D. Echocardiographic evaluation of cardiac functions and left ventricular mass in children with malnutrition. J Paediatr Child Health. 2001;37:14-7. 13. Cunha DF, Cunha SF, Reis MA, Teixeira V de P.
Heart weight and heart weight/body weight coefficient in malnourished adults. Arg Bras Cardiol. 2002;78:382-7.
15. Ahmad S, Ellis J, Nesbitt A, Molyneux E. Pericardial effusions in children with severe protein energy malnutrition resolve with therapeutic feeding: a prospective cohort study. Archives of disease in childhood. 2008;93(12):1033-6.
16. Olowonyo MT, Ogunkunle OO, Akinbami FO,
Jaiyesimi F. The echocardiographic findings in kwashiorkor. J Trop Pediatr. 1995;41(2):74-6.
17. Nutrition and Heart Diseases: Causation And Prevention: Edited By Ronald Ross Watson And Wictor R. Preedy; 2003:142.