International Journal of Communication Networks and Information Security (IJCNIS) Vol. 5, No. 1, April 2013
Combined-order Algorithm using Promethee
Method Approach and Analytic Hierarchy Decision
for Chunk Allocation in LTE Uplink Systems
Arfianto Fahmi
1, Muhamad Asvial
2, Dadang Gunawan
31,2,3
Electrical Engineering Department, University of Indonesia, Depok, Indonesia [email protected], [email protected], [email protected]
Abstract: The problem of chunk-based resource allocation for
the uplink of Long Term Evolution is investigated. In this paper, a combined order using the promethee method and analytic hierarchy decision for chunk allocation algorithm is proposed.The utility of each order is sorted based on promethee method approach so that the utility of each order could be approximated as the average of all criteria on each order. To decide the best allocation, analytic hierarchy process score is assigned to its order based on their decision criteria weighting factor to find the best allocation. Using a particular weighting factor, the proposed algorithms outperform the previous mean greedy algorithms which use user-order allocation in term of spectral efficiency and data rate fairness without increase the time complexity. It also outperform iterative swapping chunk algorithm in term of data rate fairness.
Keywords: chunk-order, promethee, analytic, hierarchy, uplink.
1.
Introduction
SC-FDMA (Single Carrier Frequency Division Multiple Access) is a radio access technique which has been proposed to be used in uplink of third-generation partnership project-long term evolution (3GPP-LTE)[1]. It is developed from OFDMA (Orthogonal Frequency Division Multiple Access)-based technique which uses precoded-DFT (Discrete Fourier Transform) encoder to reduce the PAPR (Peak to Average Power Ratio) due to power limitation in a user terminal [1-2]. Like in OFDMA, SC-FDMA is also designed to provide multiple users transmissions based on multicarrier technique which dividing wide transmission bandwidth into multiple narrow band orthogonal subcarriers experiencing flat fading[3].
In wireless multiuser systems, the phenomena of time varying frequency selective channels occur on different users at different time. Multiuser diversity is a result from independent fading channels across different users[4]. To improve system performance over wireless channels, the multiuser diversity should be exploited by allocating the radio resources to users properly according to the instantaneous channel conditions of active users [4]. As an advanced of uplink scheme, these phenomena are accommodated in LTE system by dynamically allocating radio resources such as subcarrier and power to different users every time transmission interval (TTI)[4-5]. On the instantaneous time or it is called time transmission interval, the resource allocation of LTE systems can be formulated as an optimization problem to maximize or minimize the quality of services of the system with one or more
constraints. The resource allocation schemes are solutions of their optimization problem based on their objective and constraints.
The latest works of downlink resource allocations for OFDMA systems are developed based on greedy-based algorithms. They have been proposed by [4,6-9]. Waterfilling-based power allocation and subcarrier allocation with linear complexity in [6] is proposed to maximize the capacity. To reduce the complexity, suboptimum algorithms using chunk-based subcarrier allocation in [4,7-9] are proposed by allocating a set of contiguous subcarriers to all users. In downlink, it is allowed to exploit power allocation using waterfilling-based since there is only one power constraint in optimization problem. Thus, the complexity problem of waterfilling-based power allocation can be accepted as long as it achieves optimum allocation.
Unlike in downlink, there are power constraints as many as the number of users in uplink. So using waterfilling-based on uplink power allocation is more complex than those on downlink. In [10-13], optimal power and subcarrier allocation is proposed. Their optimizations are to maximize the spectral efficiency [10-11], data rate fairness [12] and sistem utility [13]. Power allocation and subcarrier allocation are performed using waterfilling-based and greedy-based, respectively. They can achieve optimum performance even they have high complexity since there are power constraints as many as the number of users.
To reduce the complexity, equal power allocations are proposed in[14-20]. Using this scheme, the problem of resource allocation becomes the problem of subcarrier allocation. In [16,18], subcarrier allocations are performed on subcarrier by subcarrier and in [14-15,17,19-20] are performed on chunk by chunk basis so that the complexity is reduced. The optimization problem of those are to maximize spectral efficiency [14,16-18,20] and to maximize the data rate fairness [15,19]. In [21-22], chunk-based allocation algorithms using waterfilling-based power allocation are investigated where in [22] fractional power control is used to limit transmit power of each user. These schemes can achieve the optimum spectral efficiency and fairness performances while increase the complexity. In [14-15,17-18], chunk allocations are performed using greedy-based searching with exhausting time of search.
International Journal of Communication Networks and Information Security (IJCNIS) Vol. 5, No. 1, April 2013 performance. SMEG algorithm performs single average
calculation instead of MEG algorithm which performs it on each allocation however the derivation to rank all users based on their average utility is not derived. In MCRG algorithm, users are ranked according to multiple criteria of utility such as mean, standard deviation and minimum utility threshold. A user with the lowest average of utilities obtains a chunk first using the concordance value of the promethee method. The promethee method is a sorting method which is widely used in a variety of research disciplines including industrial engineering and operations research. The advantages of this method is that it can ranks the multidimensional alternatives by considering the criteria from all dimensi[23-24].
The Analytic Hierarchy Process is a decision-making tool that has been used in almost all the applications related to decision theory such as selecting a best alternative, resource allocation and optimization[25]. The speciality of AHP is its flexibility to be integrated with different techniques like Linear Programming, Fuzzy Logic, Quality Funtion Deployment, etc. It can extracts the benefits from all the combined methods and achieve the desired goal in a better way[25].
In this paper, we focus on designing chunk allocation using mean greedy-based algorithm. The allocation is classified into user-order and chunk-order allocations. In each iteration, it is important to obtain the prioritized user out of the user-order and the prioritized chunk out of the chunk-order. This is derived by performing the aggregated preference indices and negative outrangking flow of promethee method [23-24]. Using these approaches, They are sorted based on the average of their utility criteria on each order. The utility criteria are chunk’s spectral efficiency in user-order and user’s spectral efficiency in chunk-order, respectively. To sort them, negative outrangking flow procedure is performed by choosing the highest aggregated preference indices on each iteration of each order. To find the best allocation, Analytic Hierarchy Process Decision [25-26] is performed to decide one order by assigning the AHP score to both orders. This score depend on the decision criteria and the weighting factor of decision criteria. Using AHP decision to choose the best allocation has not been used in previous studies of chunk allocation problem.
We organize this paper in five sections. After introducing the background in section 1, in section 2 we describe the system model and problem formulation. In section 3, the proposed algorithms and their time computational complexities are determined and compared with the previous works. The simulations of the proposed algorithms are described in section 4 and followed by conclusions in section 5.
2.
Model and Formulation
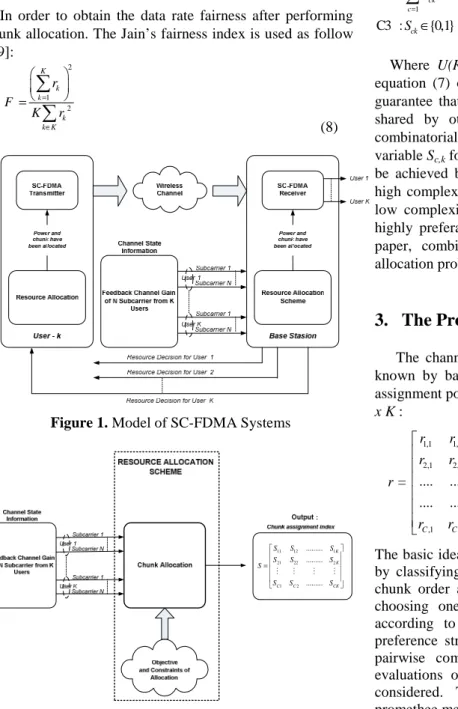
The model of SC-FDMA system is shown in figure 1. It is assumed that there are N available subcarriers and K active users. The channel state information (CSI) of all K users which consist the channel gain of N subcarriers are perfectly known by base stasion. In base station, nc contiguous subcarriers are grouped into a chunk according to L-FDMA (Localized-Frequency Division Multiple Access) method in
[3,27]. The quality of a user-chunk pair is determined using MMSE (Minimum Mean Square Equalizer) equalization and given by [14] :
1
, .
,
. 1 ,
1
1 1
1
c c
c
c k i n n
n k n i n
c n k
n
γ γ
γ
−
+
= +
= −
+
∑
(1)
γc,k is SNR if chunk-c is allocated to user-k with
i=0,1,2,....C-1. It is determined for k=1,2,....K and
γn,k=pn,k.Hn,k/σn2. γn,k is signal to noise ratio (SNR) if subcarrier-n is allocated to user-k. To guarantee fairness among users, a chunk is allocated to a user and can not be shared by other users. It is defined that Ck is a chunk allocated to the user k. Since equal power allocation is performed to each subcarrier within a chunk, the modulation scheme and bit per symbol on each subcarrier within a chunk are also the same. Using Shannon’s formula, the achievable of data rate if chunk-c is allocated to user-k has the upper bound as [14] :
, log 12 ,
c k c k
R =b +γ (2) Where b is bandwidth per chunk and we define that b=B/C,
B is bandwidth of system. In practical modulation schemes,
the signal-to-noise ratio have to be adjusted according to the required BER. The approximate expression is used for Bit Error Rate (BER) by considering SNR gap (Γ ) namely the difference between the SNR needed to achieve a certain transmission data rate for a practical system and the theoretical limit as follow[28]:
ln(5 ) 1.5
BER
− Γ =
(3)
Equation (3) has been approximated for the number of bits per simbol ≥ 2 and BER ≤ 10−3[28]. Using its approximation, the achievable of data rate if chunk-c is allocated to user-k becomes :
, , log 12
c k c k
R =b +γ
Γ
(4)
We define the spectral efficiency if chunk-c is allocated to user-k as :
(5) In our optimization problem, a chunk is only allocated to a user. Then, the achievable of the spectral efficiency of user-k after performing chunk allocation has the upperbound as follow :
(6)
, ,
, log 12
c k c k
c k
R r
b
γ
= = + Γ
, , , ,
1 1
1 1
: 1
C C
c k k c k c k c k
c c
C
ck c
r S r S
subject to S k K
γ
= =
=
= = +
Γ
= ∀ ∈
∑
∑
International Journal of Communication Networks and Information Security (IJCNIS) Vol. 5, No. 1, April 2013 Where rk is spectral efficiency of user-k, Sc,k is the
assignment index indicating whether cth chunk is allocated to the kth user. If the cth chunk is allocated to kth user, Sc,k = 1, otherwise Sc,k = 0. The total spectral efficiency of the system can be expressed as follow :
1
, , 1 1
= 1
K
T k
k K C
c k c k k c
R r
S γ
=
= =
=
+
Γ
∑
∑∑
(7)
In order to obtain the data rate fairness after performing chunk allocation. The Jain’s fairness index is used as follow [29]:
(8)
Figure 1. Model of SC-FDMA Systems
11 12 1 21 22 2
1 2 ... ...
...
K K C C CK
S S S
S S S
S
S S S
=
M M M M
Figure 2. Resource Allocation Model
The problem of chunk allocation in base station is to determine the elements of matrix Sc,k specifying chunk
assignment index. It indicates which chunk should be assigned to which user such that the objective of system is maximized. The optimization formulation of chunk allocation is presented in figure 2 and it can be written as :
Objective : : ( )
k
Max U r
Subject to :
1
C1 : 1
K ck k
S c C
=
= ∀ ∈
∑
1
C2 : 1
C
ck c
S k K
=
= ∀ ∈
∑
C3 :Sck∈{0,1} (9) Where U(Rk) is the objective of optimization based on equation (7) or (8). Constraint (C1) until (C3) are used to guarantee that each user uses only a chunk and can not be shared by other users. Optimization problem in (9) is combinatorial optimization problem and it involves binary variable Sc,k for chunk assignment. The optimum solution can be achieved based on linear integer programming[30] with high complexity and it is difficult to implement. Therefore, low complexity algorithms with accepted performance are highly preferable than complex optimal algorithms. In this paper, combined allocation is proposed to solve chunk allocation problem with many constraints of optimization.
3.
The Proposed Allocation
The channel state information of all users are perfectly known by base station, thus the spectral efficiency of all assignment posibilities can be expressed as a matrix of size C
x K :
1,1 1,2 1,
2,1 2,2 2,
,1 ,2 ,
.... .... .... .... .... .... .... .... .... =
.... .... .... .... .... .... ....
K
K
C C C K
r r r r r r r
r r r
(10)
The basic idea of this work is to obtain the user-chunk pairs by classifying the allocation into user-order allocation and chunk order allocation. The best allocation is obtained by choosing one of them. In each order, the sorting step according to the promethee method is performed. The preference structure of the promethee method is based on pairwise comparisons which the deviation between the evaluations of two alternatives on a particular criteria is considered. The aggregated preference indices of the promethee method is used as follow[23-24]:
(11) Where
(12) 2
1 2 K
k k
k k K
r F
K r
=
∈
=
∑
∑
1
1
, , :
( , ) ( , )
( , ) ( , )
J
j j
j J
j j
j Let a b A and let
a b f a b w
b a f b a w π
π
=
=
∈
=
=
∑
∑
( )
( )
( )
( )
( )
( )
, ,
j j j j j
j j j j j
f a b F g a F g b
f b a F g b F g a
= −
International Journal of Communication Networks and Information Security (IJCNIS) Vol. 5, No. 1, April 2013 π(a,b) is expresses to which degree a is preferred to b over
all criteria and π(a,b) how b is preferred to a. wj is weighting factor of criteria-j. These function give the preference of a over b and b over a for observed deviations between their evaluation function Fj(.)on criteria gj(.). This method is used for sorting all users of user-order allocation and all chunks of chunk-order allocation, respectively. The MEG[19], SMEG[19] and MCRG[20] algorithms can be seen as user-order allocation since the allocation is done by sorting all users.
3.1 User-order Allocation
In r, each user has a number of spectral efficiency achieved from all chunks. The spectral efficiency of user-i on chunk-j is denoted by rj,i. The evaluation function used to compare among all users are spectral efficiency achieved by all users. It means that Fj[(gj(i)] = rj,i where i=1:K. The pairwise comparison determines the deviation between spectral efficiency of user-i and user-i’ on a chunk-j. Therefore the comparisons among K users should be performed for all spectral efficiency from all chunks. The aggregated preference indices is used to express which degree a user is preferred to another user over all chunk’s spectral efficiency. It can be formulated as follow :
(13) π(i,i’) is expressing which degree user i is preferred to user i’. Fj[gj(i) and Fj[gj(i’) are the evaluation functions on criteria
gj(.) of user-i and user-i’, respectively. wj is weighting factor of the spectral efficiency on chunk - j expressing the priority of it. Since the priority of spectral efficiency on all chunks are same, the weighting factor are also the same. It means that :
(14) By substituting (14) into (13), the equation (13) becomes :
(15) Where
r
i is the spectral efficiency average over C chunks on user-i. Based on (15), pairwise comparison between two users can be determined by averaging spectral efficiency from C chunks. It means that the parameter to be compared among K users is their average of spectral efficiency from C chunks. In order to sort K users, the negatif outrangking flow is performed to rank them. Each ri is facing (K-1) other users with the negative outrangking flow of user-i and this is given by :(16) It expresses a user-i is outranked by all the other users. A user who has the highest ϕ–(i) gets the first priority to obtain
a chunk and this is written as
(17) Choosing a user who has the highest outrangking flow means that a user who has the lowest average of spectral efficiency gets the highest priority to be allocated since it can guarantee the data rate fairness. Futhermore, a chunk allocated to user-i is determined by searching a chunk which gives the highest spectral efficiency on user-i. This is also used in [4,9] :
(18)
3.2 Chunk-order Allocation
A chunk which will be allocated on each iteration is determined. Each chunk has a number of spectral efficiency from K users. To express to which degree a chunk is preferred to another chunk over all user’s spectral efficiency among C chunks, the aggregated preference indices is also used where C in (13) is replaced by K :
(19) π(l,l’) express to which degree chunk l is preferred to
chunk l’. Fh[gh(l) and Fh[gh(l’) are the evaluation functions on criteria gh(.) of user-l and user-l’, respectively. Wh is weighting factor of the spectral efficiency on user – h. Since the priority of spectral efficiency on all users are same, it means that :
(20) Substituting (20) into (19), equation (19) becomes :
(21) Where
r
l is the spectral efficiency average over K users on chunk-l. Based on (21), pairwise comparison between two chunks can be determined by averaging spectral efficiency from K users. It means that the parameter to be compared among C chunks is their average of spectral efficiency fromK users. The negatif outrangking flow is also perform to rank
them. Each rl is facing (C-1) other chunks with the negative outrangking flow of user-l and this is given by :
(22) It expresses a chunk-l is outranked by all the other chunks. A chunk which has the highest ϕ–(l) gets the first priority to be
allocated and this is written as :
(23) A user who obtain chunk-l is determined by searching a user who gives the highest spectral efficiency on that chunk:
(24) 3.3 The Best Allocation Decision
In order to decide the best allocation whether user-order or chunk order on each time transmission interval, the decision
( )
( )
(
,)
, , , ,
1
, ,
1
( , ) , , ,
=
C
j j j j j
j C
j i j i j
j
i i F g i F g i w i i i i K
r r w
π
=
=
= − ∀ ≠ ∈
−
∑
∑
1
1
, 1
C
j j
j
w where w
C =
=
∑
=(
,)
,
,
, , ,
, ,
1
, ,
1 1
1
( , ) , , ,
1 1
= =
C
j i j i j
C C
j i j i
j j
i i
i i r r i i i i K C
r p C C r r
π
=
= =
= − ∀ ≠ ∈
−
−
∑
∑
∑
( )
, ,1
( ) , , , ,
1x K
i x i i i i i K C
φ− π
∈
= ∀ ≠ ∈
−
∑
( )
(
)
arg max , 1, 2,...,
i= φ− i i= K
( )
,arg max i c , 1, 2,...,
c= r c= C
( )
( )
(
,)
, , , ,
1
, ,
1
( , ) , , ,
=
K
h h h h j
h K
h l h l h
h
l l F g l F g l w l l l l C r r w
π
=
=
= − ∀ ≠ ∈
−
∑
∑
1 1
, 1
K
h h
h
w where w
K =
=
∑
=(
,)
,
,
, , ,
, ,
1
, ,
1 1
1
( , ) , , ,
1 1
= =
K
h l h l
h
K K
h l h l
h h
l l
l l r r l l l l C K
r r K K r r
π
=
= =
= − ∀ ≠ ∈
−
−
∑
∑
∑
( )
, ,1
( ) , , , ,
1x C
l x l l l l l C K
φ− π
∈
= ∀ ≠ ∈
−
∑
( )
(
)
arg max , 1, 2,...,
l= φ− l l= C
( )
,arg max l k , 1, 2,...,
International Journal of Communication Networks and Information Security (IJCNIS) Vol. 5, No. 1, April 2013 approach using analytic hierarchy process (AHP) is
performed. The decision is based on the decision criteria and the priority of both decision criterias. The AHP decision uses the structure of a ZxV matrix where Z is the number of alternative and V is the number of decision criteria[26]. This matrix contains the elements which indicate the objectives achieved by all alternatives in term of each decision criteria. In general, AHP decision matrix has the basic form as[26]:
(25) Where each element of matrix q is the objective achieved by each alternative in term of each decision criteria. In case of chunk allocation, the objective of allocation are performance achieved by user-order and chunk-order which are sum of spectral efficiency and fairness index. It can be noted that the criteria to decide the best allocation are sum of spectral efficiency and fairness index achievements regarding to equation (7) and (8). Then the alternatives of allocation are user-order allocation and chunk-order allocation. Thus, it means that Z = 2 and V = 2. The AHP decision matrix of the allocation problem becomes :
(26) The first column of matrix q are performances achieved by sum of spectral efficiency criteria with Ruo and Rco are sum of spectral efficiency based on user-order and chunk-order, respectively. The second column are performances achieved by fairness criteria with Fuo and Fco are fairness index based on user-order and chunk-order, respectively. To obtain the best allocation, the AHP score of each order is determined :
(27) Where :
(28)
wv is the weighting factor of decision criteria-v. According to (27) and (28), AHP score for user-order allocation becomes :
(29) Meanwhile AHP score for chunk-order allocation is given by :
(30) Where wse and wfair are weighting factor for spectral efficiency criteria and fairness criteria, respectively and wse +
wfair = 1. The best allocation is obtained by :
(31) User-order allocation and chunk-order allocation are performed on each time transmission interval. The weighting factor of each decision criteria is varied between 0 and 1. Sum of them is 1. If one of them is 0 it means the other criteria is 1.
3.4 The Combined-order Algorithm
The combined algorithm consist of two order which are user-order allocation and chunk-order allocation. The best allocation is obtained using AHP decision by choosing the higher AHP score of both order. The steps of the proposed algorithm are as follow :
User-order allocation :
1. For all users, determine the average of chunk’s spectral efficiency and the aggregated preference indices based on (13).
2. Calculate the negatif outrangking flow of all users using (16).
3. Find a user who selects a chunk by choosing a user i who has the highest negatif outrangking flow using (17).
4. Select a chunk c allocated to a user i based on (18). 5. Chunk c is allocated to user i and remove chunk c
and user i from process.
6. Update chunk assignment index (Sc,k,user-order) and spectral efficiency achieved by a pair of user i and chunk c (rc,k,user-order).
7. Repeated step 3 to 6 until all users get chunks. Chunk-order allocation :
1. For all chunks, determine the average of user’s spectral efficiency and the aggregated preference indices based on (21).
2. Calculate the negatif outrangking flow of all users using (22).
3. Find a chunk which allocated to a user by choosing a chunk l which has the highest negatif outrangking flow using (23).
4. Select a user k who gets a chunk c based on (18). 5. Chunk c is allocated to user k and remove user k and
chunk c from process.
6. Update chunk assignment index (Sc,k,chunk-order) and spectral efficiency achieved by a pair of user k and chunk l (rc,k,user-order).
7. Repeated step 3 to 6 until all chunks are allocated. Decision for The Best Allocation :
1. Calculate sum of spectral efficiency and fairness index using (7) and (8), respectively.
2. Determine user-order score and chunk-order score using (29) and (30), respectively.
3. The best allocation is obtained by choosing the higher AHP score of both order based on (31). In order to quantify the complexity of the combined allocation, time complexity using asymtotic approach is used. This approach is regarding the time restriction within a time transmission interval. The combined order algorithm consists of two orders with step similiarities. To determine the spectral efficiency average of either chunks or users need
O(KC). The aggregated preference indices calculations need O(KC). The user-chunk assignments of both order need O(K+C). Finally, finding the best allocation needs O(1).
Then the total complexity is given by
O(KC)+O(KC)+O(K+C)+O(1)
≈
O(KC).1,1 1,2 1,
2,1 2,2 2,
,1 ,2 ,
... ... ... ... ... ...
...
V
V
Z Z Z V
q q q q q q q
q q q
=
uo uo
co co
R F q
R F
=
1
, 1, 2,...
V zv
z v
v v
q
Q w for z Z
q
=
=
∑
=1
, 1, 2,...
Z
v zv
z
q q for v V
=
=
∑
=uo uo
uo se fair
uo co uo co
R F
Q w w
R R F F
= +
+ +
co co
co se fair
uo co uo co
R F
Q w w
R R F F
= +
+ +
( )
arg max z , z uo co
International Journal of Communication Networks and Information Security (IJCNIS) Vol. 5, No. 1, April 2013 Table 1 The time complexity comparison
Algorithms Time Complexity
Mean Enhanced Greedy[19] O(KC2)
Single Mean Enhanced Greedy[19] O(KC)
Iterative Swapping Chunk[17] O(KClogC)
Combined-order Allocation O(KC)
The time complexity of mean greedy (MEG) and single mean greedy (SMEG) algorithms [19] are given by O(KC2)
and O(KC), respectively. Futhermore, the complexity of iterative swapping chunk algorithm is given by
O(KClogC)[17]. The comparison of the combined-order
algorithm with the previous algorithms is presented on table 1. It can be seen that the proposed algorithm has less time complexity than MEG and iterative swapping chunk algorithms due to single average calculation on each allocation iteration. It has the same time complexity with SMEG algorithm even it performs both orders in each TTI. Using asymtotic time complexity approach, the complexity of them is determined by their number of iterations however using two orders at the same TTI.
4.
Simulation Results and Discussions
The performances of the combined-order algorithm are compared with the previous algorithms using several simulation scenarios. The simulations are performed using MATLAB 7.8.0 (R2009a). The frequency of 2 Ghz is assumed. The transmit power of each user is 1 watt. The channel state information of all time transmission interval are perfectly known by base station with a number of time transmission interval is 5000. In all scenarios, the desired bit error rate of system is 10-4. The CSI per subcarrier of all users are according to the model in [14-15,27]. Using σn2=No.B, CNR per subcarrier of each user can be written :
(32)
Lp is the propagation loss chosen to be 128.1 dB, dk is user-k distance from base stasion in kilometers, δ is pathloss
exponent set to 3.76, εn,k is lognormal shadowing with standard deviation is varied from 1 until 10 dB. Rn,k is the rayleigh fading with rayleigh parameter τ such that E[τ 2]=1. No is noise spectral density per subcarrier chosen to be -174 dBm/hz and B is bandwidth per subcarrier set to 15 Khz. Each chunk consists of 12 consecutive subcarriers[1]. These propagation parameters are related to the macrocell model for urban and suburban area [14-15]. The effect of weighting factor decision criteria, the number of users, lognormal shadowing and the cell radius on the spectral efficiency and fairness achievements are investigated and shown in figure 3 until 10, respectively.
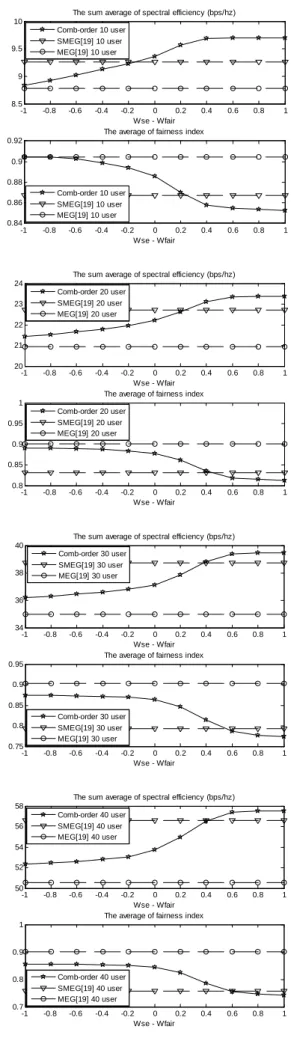
Figure 3. The average of spectral efficiency and fairness index versus the decision criteria weights with various
number of users
, [ ] 10 log , - -10 log - , - .
n k n k p k n k o
CNR dB = R L δ d ε N B
-1 -0.8 -0.6 -0.4 -0.2 0 0.2 0.4 0.6 0.8 1
8.5 9 9.5 10
Wse - Wfair
The sum average of spectral efficiency (bps/hz)
Comb-order 10 user SMEG[19] 10 user MEG[19] 10 user
-1 -0.8 -0.6 -0.4 -0.2 0 0.2 0.4 0.6 0.8 1
0.84 0.86 0.88 0.9 0.92
Wse - Wfair The average of fairness index
Comb-order 10 user SMEG[19] 10 user MEG[19] 10 user
-1 -0.8 -0.6 -0.4 -0.2 0 0.2 0.4 0.6 0.8 1
20 21 22 23 24
Wse - Wfair
The sum average of spectral efficiency (bps/hz)
-1 -0.8 -0.6 -0.4 -0.2 0 0.2 0.4 0.6 0.8 1
0.8 0.85 0.9 0.95 1
Wse - Wfair The average of fairness index Comb-order 20 user
SMEG[19] 20 user MEG[19] 20 user
Comb-order 20 user SMEG[19] 20 user MEG[19] 20 user
-1 -0.8 -0.6 -0.4 -0.2 0 0.2 0.4 0.6 0.8 1
34 36 38 40
Wse - Wfair
The sum average of spectral efficiency (bps/hz)
Comb-order 30 user SMEG[19] 30 user MEG[19] 30 user
-1 -0.8 -0.6 -0.4 -0.2 0 0.2 0.4 0.6 0.8 1
0.75 0.8 0.85 0.9 0.95
Wse - Wfair The average of fairness index
Comb-order 30 user SMEG[19] 30 user MEG[19] 30 user
-1 -0.8 -0.6 -0.4 -0.2 0 0.2 0.4 0.6 0.8 1
50 52 54 56 58
Wse - Wfair
The sum average of spectral efficiency (bps/hz) Comb-order 40 user
SMEG[19] 40 user MEG[19] 40 user
-1 -0.8 -0.6 -0.4 -0.2 0 0.2 0.4 0.6 0.8 1
0.7 0.8 0.9 1
Wse - Wfair The average of fairness index
International Journal of Communication Networks and Information Security (IJCNIS) Vol. 5, No. 1, April 2013
Figure 4. Sum average of spectral efficiency versus the number of users
Figure 5. The average of fairness index versus the number of users
Figure 3 present the effect of the decision criteria weights on the sum average of spectral efficiency and the average of fairness index of the combined order algorithms with various user numbers within a cell. The horizontal axis represents the difference between wse and wfair where its varies between -1 to 1. When the difference between them is -1, 0 and 1 means that wse=0 and wfair=1, wse=0.5 and wfair=0.5, wse=1 and
wfair=0, respectively. It is shown that the highest sum of spectral efficiency happens at wse – wfair = 1 since it optimizes the sum of spectral efficiency maximization by choosing whether user-order or chunk-order which give the maximum criteria of sum of spectral efficiency in each TTI. The highest fairness happens at wse – wfair = -1 since it optimizes the fairness maximization by choosing whether both order which give the maximum criteria. By varying wse – wfair between -1 and 1, the combined algorithm shows the increase of spectral efficiency. Otherwise, it shows the decrease of fairness. There is trade-off between spectral efficiency and fairness due to the weigths of decision criteria used. When the number of users are 10, 20, 30 and 40, using a particular decision criteria weights, the combined algorithm gives the best trade-off since they outperform SMEG
algorithm in both performances. They also can outperform MEG algorithm in term of spectral efficiency however gives a little reduction of fairness. The optimum wse – wfair are 0, 0.4, 0.4 and 0.6 at the number of users are 10, 20, 30 and 40, respectively. In other words, the combined order algorithm using a particular wse – wfair can optimize both performances since it can balance both parameters. This optimization is performed without increase the time complexity and it has the same time complexity with SMEG algorithm and the lower time complexity than MEG algorithm.
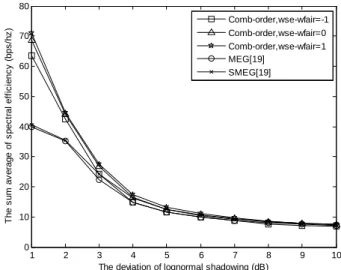
Figure 6. Sum average of spectral efficiency versus the deviation of lognormal shadowing
Figure 7. The average of fairness index versus the deviation of lognormal shadowing
Figure 4 and 5 show the effect of user numbers on the spectral efficiency and fairness index of the combined order algorithms. The number of users are varied from 5 until 50 and distributed randomly within a cell. The shadowing deviation of propagation is 7 dB. Increasing the number of users, all algorithms have the same tendency which give spectral efficiency increase and fairness decrease, respectively. It happens because they add up the spectral efficiency achieved by all users, thus it leads to higher variation of spectral efficiency achieved among all users. The MEG algorithm[19] has slightly fairness decrease because of average calculation on each iteration. The optimum decision criteria weights are according to the
5 10 15 20 25 30 35 40 45 50
0 10 20 30 40 50 60 70 80
The number of users
T
h
e
s
u
m
a
v
e
ra
g
e
o
f
s
p
e
c
tr
a
l
e
ff
ic
ie
n
c
y
(
b
p
s
/h
z
) Comb-order,wse-wfair=-1Comb-order,wse-wfair=0
Comb-order,wse-wfair=0.2 Comb-order,wse-wfair=0.4 Comb-order,wse-wfair=0.6 Comb-order,wse-wfair=1 MEG[19]
SMEG[19]
5 10 15 20 25 30 35 40 45 50
0.4 0.5 0.6 0.7 0.8 0.9 1
The number of users
T
h
e
a
v
e
ra
g
e
o
f
fa
ir
n
e
s
s
i
n
d
e
x
Comb-order,wse-wfair=-1 Comb-order,wse-wfair=0 Comb-order,wse-wfair=0.2 Comb-order,wse-wfair=0.4 Comb-order,wse-wfair=0.6 Comb-order,wse-wfair=1 MEG[19]
SMEG[19] Iterative[17]
1 2 3 4 5 6 7 8 9 10
0 10 20 30 40 50 60 70 80
The deviation of lognormal shadowing (dB)
T
h
e
s
u
m
a
v
e
ra
g
e
o
f
s
p
e
c
tr
a
l
e
ff
ic
ie
n
c
y
(
b
p
s
/h
z
) Comb-order,wse-wfair=-1
Comb-order,wse-wfair=0 Comb-order,wse-wfair=1 MEG[19]
SMEG[19]
1 2 3 4 5 6 7 8 9 10
0.45 0.5 0.55 0.6 0.65 0.7 0.75 0.8 0.85 0.9 0.95
The deviation of lognormal shadowing (dB)
T
h
e
a
v
e
ra
g
e
o
f
fa
ir
n
e
s
s
i
n
d
e
x
Comb-order,wse-wfair=-1 Comb-order,wse-wfair=0 Comb-order,wse-wfair=1 MEG[19]
International Journal of Communication Networks and Information Security (IJCNIS) Vol. 5, No. 1, April 2013 number of user which relates to figure 3. Using these
optimum weightings, the combined-order algorithm can outperform the previous algorithms. These results also correlate with figure 3 where there are trade-off between spectral efficiency and fairness.
Figure 6 and 7 view the variation of lognormal shadowing deviation on the spectral efficiency and fairness of the combined order algorithms, respectively. The number of users within a cell is 10. The deviation of shadowing is varied between 1 to 10 dB. It describe the impact of propagation enviroment due to radio signal blocking by buildings (outdoor), walls(indoor) and other obstacles. The combined algorithms can outperform the MEG and SMEG algorithms in term of sum of spectral efficiency. Increasing the deviation, all algorithms experience the spectral efficiency decrease as well as fairness increase because of the smaller spectral efficiency achieved by all users. Using
wse-wfair =1 and wse-wfair = -1, the combined-order algorithm gives the best spectral efficiency and fairness, respectively. They can utilize the shadow fading diversity experienced by all users to maximize the spectral efficiency and fairness using wse-wfair =1 and wse-wfair = -1, respectively. With wse
-wfair =0, the combined algorithm can optimizes both performances since it can outperform SMEG in term of spectral efficiency and fairness, respectively. It also can outperform the MEG algorithm in term of spectral efficiency even has a little fairness reduction.
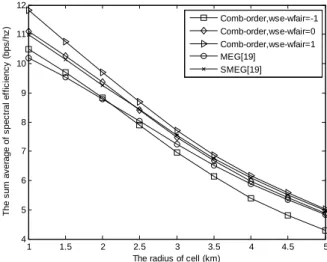
Figure 8. Sum average of spectral efficiency versus the cell radius
Figure 8 and 9 present the impact of cell radius on the sum average of spectral efficiency and the average of fairness index of the combined order algorithms. The cell radius is varied between 1 to 5 kilometers and the number of users within a cell is 10 when they are randomly distributed. The deviation of lognormal shadowing is 7 dB. Increasing the cell radius, all algorithms experience the spectral efficiency decrease and fairness increase because of the smaller spectral efficiency achieved by all users due to the decrease of mean path loss. Using wse-wfair =1 and wse-wfair =0, the combined algorithms can outperform MEG and SMEG algorithms in term of spectral efficiency since it can utilize user-order and chunk-order to maximize the sum of spectral efficiency. Using wse-wfair = -1, the combined algorithm has the best
fairness since it prioritizes either user-order or chunk-order should to be used to maximize the fairness. With wse-wfair = 0, it optimizes both performances but it has a slightly fairness reduction than MEG algorithm.
Figure 9. The average of fairness index versus the cell radius
5.
Conclusions
In this paper, low complexity chunk allocation algorithm by classifying allocation into user-order and chunk-order for LTE uplink systems is investigated. The aggregated preference indices and negative outrangking flow of promethee method are performed to sort user and chunk of both orders. The AHP decision process is performed to decide the best allocation between both orders regarding to the decision criteria weighting factor. Using these methods, sorting of user or chunk is determined by the average of user’s or chunk’s quality. Also the optimization between spectral efficiency and fairness criterias is achieved by using a particular weighting factor. With these approaches, the complexity of the proposed algorithm does not increase however user-order and chunk-order are performed at the same time transmission interval due to asymtotic time complexity aproximation. The simulation results show that the proposed algorithm can outperform the user-order algorithm, i.e. MEG and SMEG algorithms in terms of their spectral efficiency and fairness by applying wse - wfair=1 and
wse - wfair =-1, respectively. There are trade-off of the proposed algorithm when -1<wse - wfair<1. When wse - wfair= 0, 0.4, 0.4 and 0.6, the proposed algorithm can optimize both performances and outperform SMEG algorithm with the user numbers of 10, 20, 30 and 40, respectively. However they have a little reduction of fairness compared with MEG algorithm.
6.
Acknowledgement
This work was supported by Yayasan Pendidikan Telkom (YPT) Scholarship from PT Telkom Indonesia with grant number 160/SDM-06/YPT/2009.
1 1.5 2 2.5 3 3.5 4 4.5 5
4 5 6 7 8 9 10 11 12
The radius of cell (km)
T
h
e
s
u
m
a
v
e
ra
g
e
o
f
s
p
e
c
tr
a
l
e
ff
ic
ie
n
c
y
(
b
p
s
/h
z
) Comb-order,wse-wfair=-1
Comb-order,wse-wfair=0 Comb-order,wse-wfair=1 MEG[19]
SMEG[19]
1 1.5 2 2.5 3 3.5 4 4.5 5
0.5 0.55 0.6 0.65 0.7 0.75 0.8 0.85 0.9 0.95
The radius of cell (km)
T
h
e
a
v
e
ra
g
e
o
f
fa
ir
n
e
s
s
i
n
d
e
x
Comb-order,wse-wfair=-1 Comb-order,wse-wfair=0 Comb-order,wse-wfair=1 MEG[19]
International Journal of Communication Networks and Information Security (IJCNIS) Vol. 5, No. 1, April 2013
References
[1] 3rd Generation Partnership Project (3GPP), “Technical Specification Group Radio Access Network”
[2] Shariat.M., Quddus. A., Ghorashi.S., and Tafazolli. R, “Scheduling as an Important Cross-Layer Operation for Emerging Broadband Wireless Systems,” IEEE Communications Surveys and Tutorials, vol. 11, no. 2, pp. 74-86, 2009.
[3] H.G.Myung, “Introduction To Single Carrier FDMA,” Proceeding 15th Signal Processing Conference (EUSIPCO), 2007.
[4] Huiling Zhu and Jiangzhou Wang,”Chunk-Based Resource Allocation in OFDMA Systems - Part I : Chunk Allocation,” IEEE Transactions On Communications, vol. 57, no. 9, pp. 2734-2744, September 2009.
[5] Wu,H., Haustein, T., “RADIO Resource Management for Multi-user Uplink using DFT-Precoded OFDM,” Proceeding IEEE International Conference on Communications, Beijing, China, pp. 4724-4728, 2008. [6] I.C.Wong and B.L.Evans,”Optimal OFDMA Resource
Allocation with Linear Complexity To Maximize Ergodic Rates,” IEEE Transactions on Wireless Communications, vol. 7, no. 3, pp. 962-971, 2008. [7] Vasileios D.Papoutsis and Stavros A.Kotsopoulos,
“Chunk-Based Resource Allocation in Multicast OFDMA Systems with Average BER Constraint,” IEEE Communications Letters, vol. 15, no. 5, pp. 551-553, May 2011.
[8] Vasileios D.Papoutsis and Stavros A.Kotsopoulos, “Chunk-Based Resource Allocation in Distributed MISO-OFDMA Systems with Fairness Guarantee,” IEEE Communications Letters, vol. 15, no. 4, pp. 377-379, April 2011.
[9] Huiling Zhu and Jiangzhou Wang,”Chunk-Based Resource Allocation in OFDMA Systems - Part II : Joint Chunk, Power and Bit Allocation,” IEEE Transactions On Communications, vol. 60, no. 2, pp. 499-509, February 2012.
[10]K.Kim, Y.Han, and S.L.Kim, “Joint Subcarrier and Power Allocation in Uplink OFDMA Systems,” IEEE Communications Letter, vol. 9, no. 6, pp. 526-528, June 2005.
[11]J.Huang, V.G.Subramanian, R.Agrawal, and R.Berry, “Joint Scheduling and Resource Allocation in Uplink OFDMA Systems for Broadband Wireless Access Networks,” IEEE Journal on Selected Area in Communications, vol. 27, no. 2, pp. 226-234, February 2009.
[12]L.Gao and S.Cui, “Efficient Subcarrier, Power and Rate Allocation with Fairness Consideration for OFDMA Uplink,” IEEE Journal Transactions on Wireless Communications, vol. 7, no. 5, pp. 1507-1511, 2008. [13]C.Y.Ng and C.W.Sung,”Low Complexity Subcarrier
and Power Allocation for Utility Maximization in Uplink OFDMA Systems,” IEEE Journal Transactions on Wireless Communications, vol. 7, no. 5, pp. 1667-1675, May 2008.
[14]Junsung Lim, Hyung G Myung, Kyungjin Oh, and David J Goodman, “Channel Dependent Scheduling of Uplink Single Carrier FDMA Systems,” Proceeding IEEE Vehicular Technology Confererence, 2006, pp. 1-5.
[15]Junsung Lim, Kyungjin Oh Hyung G Myung, and David J Goodman, “Proportional Fair Scheduling of Uplink Single-carrier FDMA Systems,” IEEE International Sysposium on Personal, Indoor and Mobile Radio Communications, 2006, pp. 1-6.
[16]I.C.Wong, O.Oteri, and W.Mccoy,”Optimal Resource Allocation in Uplink SC-FDMA systems,” IEEE Transactions on Wireless Communications, vol. 8, no. 5, pp. 2701-2706, July 2009.
[17]Wei Cheng Pao and Yung Fang Chen, “Chunk Allocation Schemes for SC-FDMA Systems,” Proceeding IEEE Vehicular Technology Conference, 2010, pp. 1-5.
[18]Wei Cheng Pao and Yung Fang Chen, “Reduced Complexity Subcarrier Allocation Schemes for DFT-Precoded OFDMA Uplink Systems,” IEEE Transactions on Wireless Communications, vol. 9, no. 9, pp. 2161-2165, May 2010.
[19]Obilor Nwamadi, Xu Zhu, and Asoke K Nandi, “Dynamic Physical Resource Block Allocation Algorithms for Uplink Long Term Evolution,” IET Communications, vol. 5, no. 7, pp. 1020-1027, 2011. [20]Obilor Nwamadi, Xu Zhu, and Asoke K.
Nandi,”Multi-criteria ranking based greedy algorithm for Physical resource block allocation in multi-carrier wireless communication systems,” Signal Processing, no. 92, pp. 2706-2717, 2012.
[21]Arfianto Fahmi, Muhamad Asvial, and Dadang Gunawan,”Joint Chunk Allocation and Unequal Power Allocation in Resource Allocation Algorithm for Multiuser OFDMA Uplink System,” Proceeding IEEE Vehicular Technology Society Asia Pacific Wireless Communication Symposium, August 2011, pp. 1-5. [22]Arfianto Fahmi, Muhamad Asvial, and Dadang
Gunawan, “Uplink Resource Allocation Algorithms with Fractional Power Control as Power Constraints,” Proceeding IEEE TENCON, November 2011, pp. 990-994.
[23]J.P. Brans and P.Vincke,”A preference ranking organisation method:The PROMETHEE method for MCDM,” Management Science, vol. 31, no. 6, pp. 647-656, 1985.
[24]J.P. Brans, B. Mareschal, and Ph. Vincke, “How to select and how to rank the projects : The PROMETHEE method,” European Journal of Operational Research, vol. 24, no. 2, pp. 228-238, 1986.
[25]Omkarprasad S Vaidya and Kumar Sushil,”Analytic hierarchy process : An overview of applications,” European Journal of Operational Research, no. 169, pp. 1-29, 2006.
[26]T.L. Saaty,”The Analytic Hierarchy Process,” McGraw Hill, 1980.
[27]H.G.Myung, Kyungjin Oh, Junsung Lim, and Goodman D.J,”Channel Dependent Scheduling of an Uplink SC-FDMA System with Imperfect Channel Information,” 2008, pp. 1860-1864.
[28]A.J.Gold and S.G.Chua,”Variable Rate Variable Power M-QAM for Fading Channels,” IEEE Transactions on Communications, vol. 45, no. 10, pp. 1218-1230, 1997. [29]R.Jain, D.M.Chiu, and W.Hawe, “A quantitative
Measure of Fairness and Discrimination for Resource Allocation in Shared Systems,”1984.