Benefits and Beneficiaries Under the Civil
Service Retirement Act
RUTH RETICKER*
The Civil Service Retirement Act of 1920 established the first Federal contributory retirement system for civilian employees. In its twenty years of operation, the civil-service retirement program has reached a maturity which the retirement systems established by the Railroad Retirement Act and the Social Security Act will not attain for years to come. Because all programs offering pro-tection to aged or disabled workers are of significance to students of social insurance, the Bulletin presents this summary of the historical development of the Civil Service Retirement Act and the present status of benefits and beneficiaries under that act, to serve as a background for the continuing presentation of data on the operation of the act.
T H E C I V I L S E R V I C E R E T I R E M E N T A C T is designed to provide retirement benefits for aged and dis-abled Federal employees. L i k e the Railroad Re-tirement A c t and many other public reRe-tirement systems, i t aims also to retire superannuated employees for the good of the service. This latter purpose had been discussed as early as President Monroe's administration, 1 2 5 years ago, when the Secretary of War protested against his "octo-genarian department."
During the first 4 0 years of its existence, the machinery of the Federal Government operated with so few removals of subordinate officials and employees that President Jackson found many of them grown old in the service and removed them on charges of inefficiency. The Four Year Tenure of Office A c t of 1 8 2 0 was extended beyond its original purpose—that of compelling the regular submission of accounts from office holders handling public funds—to form the basis for rotations i n office in the era of the spoils system, at its height during 1 8 2 9 - 6 1 . Even so, in 1 8 4 5 a House com-mittee report protested that under the system then existing " t h e list of officers becomes a pension roll" and described the detrimental effect of super-annuation on the efficiency of the Federal service. To eliminate the reduction of efficiency through retention of employees whose abilities had been reduced by age, i t proposed not a retirement system for aged employees b u t rather short terms of office for employees of all ages—in other words, extension of spoils-system rotation.
*Bureau of Research and Statistics, Division of Coordination Studies. The cooperation of the Civil Service Commission in furnishing data for incorporation in this article and in the social insurance series (pp. 92-97) is gratefully acknowledged.
Civil-service reform laws providing for com-petitive examination and nonpolitical appoint-ments have been proposed since 1865. Foreign experience was studied as early as 1868 b y a j o i n t select committee on retirement headed b y Repre-sentative Thomas Allen Jenckes of Rhode Island. The C i v i l Service A c t , passed i n 1883 after the death of President Garfield at the hands of a disappointed office seeker, led to further discussion of the problems of retirement. Surveys of super-annuation i n the Federal service were made i n
1893, 1900, 1902, and 1903; and beginning i n 1899 the C i v i l Service Commission i n its annual reports recommended the adoption of a retire-ment system financed i n whole or i n part b y de-ductions from employees' salaries. As early as
1900, clerks i n Washington had formed a United States C i v i l Service Retirement Association to work for a retirement act, b u t they d i d not unite in advocating a contributory plan until 1917. Passage of the retirement act waited u n t i l the period following the W o r l d War, when great reduc-tions had to be made i n the Federal civil forces.
The Civil Service Retirement A c t of 1920 pro-vided contributory old-age benefits for employees in service thereafter. T o take care of aged employees in service at the time the act became law, i t provided w h a t were essentially old-age pensions for those at or nearing retirement age. Almost 6,000 employees were retired for age on August 20, 1920. Since deductions from salaries were effective August 1, they had contributed only
2 1/2 percent of 20 days' pay. The m i n i m u m
amount payable to those then retired was $180 per year, the m a x i m u m $720; the exact amount for any individual depended on salary and length
of service. The annuities of employees retiring i n the succeeding two decades have been v a r y i n g combinations of contributory old-age benefits and noncontributory grants.
As now amended, the act provides for compul-sory1 retirement of employees who have attained retirement age and have served at least 1 5 years, voluntary retirement 2 years before the statutory retirement age for employees w i t h 3 0 years of service, and disability retirement after 5 years of service. Employees 4 5 years of age or over who are involuntarily separated from the service (not for cause) after 1 5 years of service may elect a deferred annuity beginning at the regular retire-ment age; a reduced annuity beginning at age 5 5 or at separation, whichever is later; or a refund of
total contributions and interest.
The statutory retirement age varies w i t h the occupation of the employee. Those engaged in particularly arduous or hazardous work, such as laborers and mechanics in navy yards, railway mail clerks, and employees who have served 1 5 years 1 The law allows the President, by executive order, to exempt any person from automatic retirement, usually for a period of 1 year, If in his judgment the public interest would be best served by the employee's retention. Such extensions have been relatively few.
in the tropics, retire at 62. Letter carriers, post-office clerks, mechanics and laborers other than in navy yards, and employees of the I n d i a n Service at large, except clerks, retire at 65. A l l other covered employees, comprising the clerical, technical, and administrative groups in the departments and independent establishments, retire at 7 0 .
Coverage
On June 3 0 , 1 9 4 0 , the Civil Service Retirement A c t covered approximately 6 4 5 , 0 0 0 employees, principally in the classified civil service of the executive branch of the United States Govern-ment, b u t including also regular employees of the District of Columbia municipal government;2 certain specified nonclassified Federal employees such as employees of the L i b r a r y of Congress and of the Architect of the Capitol are also included, as well as unclassified employees "whose tenure of employment is not intermittent or of uncertain d u r a t i o n . " Employees in the legislative branch and officers and employees of courts of the United States may be covered by giving written notice of the desire for coverage.
2 Excluding policemen, firemen, and teachers who are covered by special systems.
Table 1.—Employees in the classified civil service, annuitants on the roll of the civil-service retirement system, and
average annuity, by department or establishment, June 30, 1940
Department or establishment 1
Classified civil service, executive branch of Federal Government
Civil-service annuitants Department or establishment 1
Classified civil service, executive branch of Federal Government
Civil-service annuitants Department or establishment 1
Classified civil service, executive branch of Federal Government
N u m b e r Percent-age dis-tribution
Sex Statutory retirement age
Average annuity Department or establishment 1
Classified civil service, executive branch of Federal Government
N u m b e r Percent-age dis-tribution
Sex Statutory retirement age
Average annuity Department or establishment 1
N u m b e r Percentage distribu-tion
N u m b e r Percent-age dis-tribution
Sex Statutory retirement age
Average annuity Department or establishment 1
N u m b e r Percentage distribu-tion
N u m b e r Percent-age
dis-tribution Male Female 62
years years 65 years 70
Average annuity Department or establishment 1
N u m b e r Percentage distribu-tion
N u m b e r Percent-age
dis-tribution Male Female 62
years years 65 years 70
Average annuity
T o t a l 726,827 100.0 62,027 2 100.0 54,997 7,030 11,355 37,217 13,455 $965
Post Office Department 291,153 40.1 35,398 57.9 33,813 1,585 4,480 27,751 3,167 1,049 N a v y Department 110,902 15.3 7,597 12.4 7,347 250 5,847 988 762 845 Treasury Department 39,277 5.4 4,724 7.7 3,180 1,544 37 1,775 2,912 914 War Department 109,195 15.0 4,446 7.3 3,955 491 165 2,994 1,287 812 Interior Department 21,148 2.9 2,143 3.5 1,276 867 34 1,285 824 774 Veterans Administration 37,831 5.2 1,694 2.8 870 824 5 340 1,349 681 Agriculture Department 33,480 4.6 1,598 2.6 1,313 285 705 135 758 982 Governmont P r i n t i n g O f f i c e 5,750 .8 1,171 1.9 882 289 1,064 107 998
Commerce Department 16,765 2.3 694 1.1 448 246 7 98 589 970
District of Columbia Government 677 (3) 587 90 1 387 289 791
Labor Department 2,995 .4 359 .6 298 61 8 63 288 964
General Accounting Office 2,213 .3 293 .5 167 126 11 282 976
Justice Department 9,464 1.3 290 .5 231 59 57 17 216 848
Interstate Commerce Commission 2,736 .4 100 .2 91 9 100 958
L i b r a r y of Congress 91 (3) 35 56 28 63 831
Architect of the Capitol 89 (3) 49 40 74 15 667
Smithsonian Institution 586 . 1 87 . 1 66 21 1 40 46 889
State Department 1,379 .2 69 . 1 44 25 5 1 63 861
C i v i l Service Commission 2,747 .4 43 . 1 30 13 1 1 41 1,121
House of Representatives 31 (3) 20 11 4 27 681
Judiciary 25 (3) 18 7 1 24 1,039
Federal Trade Commission 336 (3) 22 (3) 16 6 3 19 1,017
Senate 19 (3) 16 3 9 10 756
A l l other 38,870 5.3 367 .6 245 122 1 149 217 702
1 I n order of annuitants on the roll.
2 Figured on annuitants in the executive branch only, totaling 61,095, for
comparability w i t h data on classified civil service.
3 Less than 0.05.
Source: U . S. C i v i l Service Commission, 57th Annual Report, fiscal year ended June 30, 1940, p. 136, table 10; Retirement Report, fiscal year ended June 30, 1940.
During its first year of operation, more than 300,000 Government workers were brought under the act of 1920. Since that time the number of covered employees has generally increased, though there have been some fluctuations downward at times of reduction of force among civil employees in the 1920's and early 1930's (chart 1 ) . I n fact, from 1 9 3 0 to 1933 the covered group decreased more rapidly than the total service.
After a year of operation, 5 8 . 7 percent of the civil employees in the executive branch of the Government were subject to the retirement act. The percentage covered increased to 7 2 . 9 i n 1 9 2 5 and remained above 7 1 percent through 1 9 3 0 . After 1 9 3 3 , when large numbers of emergency workers were brought into Government service, the percentage of covered workers declined— to 60.3 in 1935. Beginning in 1 9 3 8 the covered group expanded more rapidly than the total civil service, and the percentage covered increased again to 64.3 percent in June 1 9 4 0 . Even so, approximately 3 5 8 , 0 0 0 civil employees in the executive branch of the Federal Government were not covered by the civil-service retirement system or by the special systems administered separately for other groups of Federal employees.3 About half the employees covered on June 3 0 , 1940, were in the 65-year retirement group, one-third in the 70-year group, and less than one-sixth in the 62-year group.
No data are available concerning the distribu-tion of covered employees by Government depart-ments. I n general i t parallels the distribution of the classified civil service, shown in table 1 for June 1940. A t that time some 8 0 , 0 0 0 employees3 in the classified service were not covered by the retirement system. This group included tporary employees in classified positions and em-ployees who failed in noncompetitive examinations when their jobs were classified but continued w i t h -out status. In some departments there are special groups without retirement status, such as
tempo-3 Separate retirement systems not under the Civil Service Commission have been established for several specified groups of Government employees. The Foreign Service of the State Department, the Examining Division of the office of the Comptroller of the Currency, employees of the Tennessee Valley Authority and of the Federal Reserve Banks, public school teachers and police and firemen of the District of Columbia, and civilian teachers of the U. S. Naval Academy are protected by special contributory systems. Noncontributory systems provide retired pay for judges of the United States courts, justices of the Supreme Court, and the Hawaiian Judiciary; for the employees of the Lighthouse Service (consolidated with the United States Coast Guard); and for members of the various military services, including the Army and Navy Nurse Corps and commissioned officers of the Public Health Service and of the Coast and Geodetic Survey.
Chart 1.—Employees covered by the Civil Service
Retirement Act, and total civil employees in the executive branch of the United Stales Government, fiscal years ended 1921-40
rary substitutes i n the post-office service and non-civil-service employees from W P A allotments continued in classified positions in the N a v y and other departments by special enactment.
Of the classified civil service as of June 3 0 , 1 9 4 0 , more than 2 9 0 , 0 0 0 employees, or 4 0 percent of the total, were Post Office Department employees, and the N a v y and War Departments each
account-ed for approximately 1 1 0 , 0 0 0 , or 1 5 percent of the
total. E m p l o y m e n t in these latter departments is increasing rapidly and is expected to double by the end of the current fiscal year.4
I n addition to the C i v i l Service Retirement A c t , the C i v i l Service Commission administers two other retirement acts covering United States citizens employed on the Isthmus of Panama by the Panama Canal or Panama Railroad Company and for those employed in Alaska by the Alaska Railroad. These special acts provide earlier retirement and more liberal annuities to compen-sate for the special hazards of these employments. The number of employees covered under those two acts has never exceeded 5 , 6 0 0 .
Administration and Financing
When the C i v i l Service Retirement A c t became law i n 1 9 2 0 , its administration was assigned to the Commissioner of Pensions under the Secretary of
4Flemmlng, Arthur S., "Emergency Aspects of Civil Service," Public Administration Review, Vol. I, No. 1, Autumn 1940, p. 25.
the Interior, while the C i v i l Service Commission was required to "keep a record of essential infor-mation concerning individual service and to fur-nish the Commissioner of Pensions such reports therefrom as he shall request." I n 1930, w i t h the consolidation of the Pension Office and the V e t -erans Bureau, the administration of civil-service retirement was transferred to the newly created Veterans Administration. Since September 1934 responsibility for administration as well as record-keeping and actuarial work5 has been centered i n the Civil Service Commission.
Benefit payments under the C i v i l Service Retire-ment A c t are financed b y contributions of the employees and of the Government as employer. A l l employees covered b y the act are required to contribute 3 1/2 percent of their salaries (2 1/2 percent prior to July 1, 1926) to the retirement fund. Deductions are made automatically at the time the salary is paid. I n addition, employees m a y 5 Until 1933, the actuarial work was performed by the U . S. Bureau of Efficiency in cooperation with the Board of Actuaries of the civil-service retirement and disability fund and the two related funds.
make optional service-credit deposits, w i t h inter-est, for service outside the C i v i l Service Retire-ment A c t which is later included w i t h i n i t by act of Congress or executive order or which is later credited toward retirement because the individual personally obtains a retirement status i n a later job. Redeposit of deductions w i t h d r a w n by an employee who leaves the service is required, if he returns to service, as a prerequisite to eligibility for retirement benefits. Such redeposits may be made, w i t h o u t interest, on the date he reenters Government service or w i t h compound interest at 4 percent at any time before retirement age.
The Government allowance t o w a r d each annuity is determined b y the formula for compu-tation of benefits, described below. Although the C i v i l Service Retirement A c t requires no specific Government payments into the retirement fund, the implication of the act is that the Government will make up the difference between the contribu-tions of the employees and the amount needed to maintain the fund, and also t h a t the Government Table 2.—Receipts, disbursements, and status of the civil-service retirement and disability fund, fiscal years
1921-40
[In thousands]
Fiscal year ended June 30
Receipts Disbursements
Balance in fund June
30 1
Fiscal year ended June 30
T o t a l 1
Deduction from pay and service credit
deposits 2
Interest Appropria-tions Total 1 Annuities 3 Refunds 4
Adjustments and
trans-fers 5
Balance in fund June
30 1
T o t a l 1 $1,157,885 $537,872 $152,719 6 $467,293 $604,763 $508,271 $95,133 $1,359
1921 12,586 12,524 62 2,914 2,591 323 $9,673
1922 14,682 14,095 587 6,391 4,188 2,203 17,964
1923 15,156 14,174 982 7,741 4,964 2,786 9 25,379
1924 16,642 15,158 1,485 8,552 5,695 2,864 7 33,469
1925 20,029 17,999 2,030 9,028 6,239 2,713 5 75 44,470
1926 20,174 17,969 2,205 10,182 6,767 3,444 28 54,461
1927 27,168 24,356 2,813 13,395 9,598 3,862 66 68,235
1928 29,503 26,455 3,048 14,752 10,990 3,771 9 82,985
1929 52,520 28,123 4,447 19,950 16,063 12,005 4,667 10 119,442
1930 55,447 29,048 5,899 20,500 18,126 13,108 5,049 30 156,763
1931 58,277 29,944 7,332 21,000 23,992 19,860 4,160 28 191,047
1932 61,479 31,890 8,589 21,000 28,938 23,546 3,924 5 1,468 223,588
1933 61,246 30,494 9,762 21,000 34,838 30,048 4,789 249,997
1934 60,222 28,703 10,518 21,000 47,657 39,621 8,036 262,562
1935 61,912 30,089 10,823 21,000 52,744 46,971 5,773 271,730
1936 84,268 32,405 11,713 40,150 56,709 50,243 6,466 299,289
1937 94,203 34,990 13,013 46,200 59,132 51,901 7,228 6 3 334,360
1938 127,193 37,322 16,636 73,235 62,476 54,153 8,322 399,077
1939 133,497 39,189 19,220 75,087 63,818 56,531 7,287 468,755
1940 151,682 7 42,945 7 20,565 87,172 67,315 59,252 8,063 553,122
1 Totals, including balances, are rounded sums of unrounded figures, not
sums of rounded figures presented.
2 See text, p p . 3233, for explanation of optional servicecredit deposits, m a n
-datory redeposits, and voluntary deposits.
3 Include accrued annuities at death of annuitant, paid to survivors. 4 Represent refunds of deposits w i t h interest to separated employees and
to designated beneficiaries or estates of employees deceased i n active service and refund of unexpended balances of deceased annuitants to their bene-ficiaries. See also p . 38, table 5, and p . 96, table 4.
5 I n 1925, item represents accrued interest paid i n purchase of bonds; i n 1932,
transfer t o Canal Zone retirement and disability f u n d of $1,314,724 deductions and $153,077 interest of employees placed under the Canal Zone Retirement
A c t ; i n 1937 transfer to Alaska Railroad retirement and disability fund of contributions of Department of Interior employees placed under the Alaska Railroad Retirement A c t . Other amounts are minus items for cancelations and repayments; since 1931, cancelations and repayments have been deducted from annuities and refunds.
6 Includes $3,878,280, transferred from appropriations of District of
Colum-bia government, to cover retirement liability for District employees.
7 Includes $246,075 voluntary deposits for purchase of additional annuities
and $246 interest on those deposits under amendment effective Jan. 1, 1940. Source: U . S. C i v i l Service Commission, 57th Annual Report, fiscal year ended June 30, 1940, p . 142, table 16.
will meet the accrued liability for service rendered before the system was adopted. The C i v i l Service Commission is required to submit t o the Bureau of the Budget each year "estimates of the appropriations necessary to finance the retire-ment and disability fund and to continue this act in full force and effect."
Deductions from pay of employees at the 2 1/2-percent rate increased f r o m $ 1 2 . 5 million i n the fiscal year 1 9 2 0 - 2 1 to $ 1 8 . 0 million i n 1 9 2 5 - 2 6 (table 2). A t the 3 1/2-percent rate, such deduc-tions have ranged from $ 2 4 . 4 million i n 1 9 2 6 - 2 7
to $42.9 m i l l i o n i n 1 9 3 9 - 4 0 , and interest o n the
deposits has increased to $ 2 1 . 6 million. Annual disbursements increased from $2.9 million i n
1 9 2 0 - 2 1 to $ 6 7 . 3 m i l l i o n i n 1 9 3 9 - 4 0 . Benefits
were paid o u t of employee contributions and interest until the fiscal year 1 9 2 8 - 2 9 , when Congress appropriated $ 2 0 . 0 million to the civil-service retirement and disability fund. Appro-priations for the fiscal year 1 9 3 9 - 4 0 totaled $87.2 million; for the 1 2 years ended June 3 0 , 1 9 4 0 , $467.3 million. The balance i n the fund has increased from $ 9 . 7 million as of June 3 0 , 1 9 2 1 , to $553.1 million as of June 3 0 , 1 9 4 0 .
While the fund was set u p on an actuarial-reserve basis, i t does n o t have a l l the assets required for such a basis, because of the fact that appropriations were not made by Congress to meet the deficiency cost, i . e., the cost of accrued liability for service before the act was passed, for which the Government is responsible. According to the latest report of the Board of Actuaries,6 the normal cost to support the benefits accruing o n account of current service is 6 . 1 4 percent of pay roll, 2.64 percent of which is the Government's share. However, the cost due to accrued liability was 5 . 8 1 percent of the estimated pay roll o n June 30, 1 9 3 9 . Therefore, the total annual Gov-ernment contribution which the Board of Actuaries recommended was 8 . 4 5 percent of pay roll or $ 1 0 1 million i n 1 9 3 9 . I t is of interest t h a t the total cost—11.95 percent of pay roll for all employees— varies from 1 4 . 7 5 percent for employees having a normal retirement age of 6 2 , to 8 . 3 9 percent for these with a retirement age of 7 0 .
An individual account is maintained for each employee subject to the provisions of the retire-ment act. The amount deducted from salary,
6Nineteenth Annual Report of the Board of Actuaries of the Civil Service and
Disability Fund for the fiscal year ended June 30, 1939, p. 7.
less a charge of $ 1 for each m o n t h i n the service since July 1 , 1 9 3 0 , plus accumulated interest a t 4 percent, represents the employee's accumulation for the purchase of an annuity. The $ 1 per month, called tontine,7 becomes a p a r t of the gen-eral civil-service retirement and disability fund from which is paid the Government's share of each annuity, as explained i n the discussion of benefit formula below. The employee's accumulations plus interest—but n o t the tontine—are returned to a n y employee who resigns or who is removed for cause. Tontine plus accumulated interest is included i n the refunds to an employee who is involuntarily separated (not for cause) or to the beneficiary of an employee w h o dies i n active service. N o part of employees' contributions is used for administrative expenses; such costs are met from appropriations for salaries and expenses of the Civil Service Commission.
A n amendment effective January 1 , 1 9 4 0 , pro-vides for voluntary deposits i n multiples of $ 2 5 , not to exceed 1 0 percent of total basic salary since August 1 , 1 9 2 0 , f o r the purchase of additional annuity. Such deposits draw interest a t 3 per-cent—1 percent less than the interest o n manda-tory deductions. The full amount of voluntary deposits and interest is returned to any employee leaving the service. W i t h i n the first 6 months of the effective date of this amendment, 4 5 0 em-ployees deposited a quarter of a million dollars for this purpose.
The Benefit Formula
Benefits under the Civil Service Retirement A c t are heavily weighted i n favor of low-paid employees. Under the benefit formula of the 1 9 3 0 amendments, this result is accomplished mainly by an allowance for each year of service, largely independent of salary, under t w o different for-mulas. Plan I is called the purchasable plan, be-cause the Government's allowance for years of service is supplemented b y the annuity purchas-able w i t h the employee's contributions. A n alter-native Plan I I , called the guaranteed-minimum annuity, was provided to be used whenever i t would yield a larger annuity than Plan I . I t does not provide a flat rate of annuity, because the
7 The word "tontine" is derived from the name of Lorenzo Tonti, an Italian banker of the 17th century, who developed a system of collective benefits based on the principle of forfeiture to a common fund, with individual profits increasing as the number of survivors diminished and the final survivor taking the whole. The term is not used in the Civil Service Retirement Act.
amount varies at wage levels under $1,600 per year and w i t h service of less than 30 years.
For an annuitant at retirement age (or at optional retirement w i t h 30 years' service), the purchasable plan allows, as the Government's share an annuity of $30 for each year of service 8
8The Government allowance for an employee eligible for an annuity covers all years of Federal service, whether classified or otherwise, and whether or not the employee has made voluntary deposits for any period of unclassified service to increase his purchasable annuity.
not exceeding 30 (provided that this portion of the annuity does not exceed three-fourths of the highest average basic annual salary during any 5 consecutive years of service). This basic amount is supplemented by the amount of annuity pur-chasable w i t h the sum in the employee's individual account, together w i t h interest at 4 percent, compounded annually.
The purchasable annuity varies w i t h the sex Table 3.—Accumulations of salary deductions and civil-service retirement annuities payable at age 70 on
nonfor-feiture basis to male employees who entered service on or after July 1, 1930, for specified years of service, by annual salary
Annual
salary 1 Accumulations 2 and a n n u i t y 3
Years of service Annual
salary 1 Accumulations 2 and a n n u i t y 3
15 20 25 30 35 40 45 50
$1,260 Accumulations $655.66 $975.06 $1,363.66 $1,836.41 $2,411.67 $3,111.51 $3,962.98 $4,998.93 $1,260
A n n u i t y — T o t a l 513.92 695.05 882.94 1,079.02 1,135.10 1,203.32 1,286.33 1,387.32 $1,260
Employee 63.92 95.05 132.94 179.02 235.10 303.32 386.33 487.32 $1,260
Government 450.00 600.00 750.00 900.00 900.00 900.00 900.00 900.00 1,440 Accumulations 784.33 1,166.41 1,631.27 2,196.85 2,884.96 3,722.15 4,740.72 5,979.97 1,440
A n n u i t y — T o t a l 4 540.00 4 720.00 909.02 1,114.16 1,181.24 1,262.85 1,362.15 1,482.96
1,440
Employee 76.46 113.71 159.02 214.16 281.24 362.85 462.15 582.96 1,440
Government 463.54 606.29 750.00 900.00 900.00 900.00 900.00 900.00 1,620 Accumulations 913.00 1,357.77 1,898.89 2,557.25 3,358.25 4,332.78 5,518.45 6,961.01 1,620
A n n u i t y — T o t a l 4 600.00 4 800.00 4 1,000.00 4 1,200.00 1,227.38 1,322.38 1,437.96 1,578.59
1,620
Employee 80.00 132.36 185.11 249.29 327.38 422.38 537.96 678.59 1,620
Government fill. 00 667.64 814.89 950.71 900.00 900.00 900.00 900.00 2,000 Accumulations 1, 184.01 1,761.74 2,463.86 3,318.10 4,357.41 5,621.90 7,160.34 9,032.09 2,000
A n n u i t y — T o t a l 4 600.00 4 800.00 4 1,000.00 1,223.46 1,324.78 1,448.05 1,598.02 1,780.49
2,000
Employee 115.48 171.74 240.19 323.46 424.78 548.05 698.02 880.49 2,000
Government 484.52 628.26 759.81 900.00 900.00 900.00 900.00 900.00 2,600 Accumulations 1,613.55 2,399.59 3,355.92 4,519.44 5,935.05 7,657.35 9,752.79 12,302.22 2,600
A n n u i t y — T o t a l 607.30 833.92 1,077.15 1,340.58 1,478.58 1,646.47 1,901.50 2,308.56 2,600
Employee 157.30 233.92 327.15 440.58 578.58 746.47 950.75 1,199.28 2,600
Government 450.00 600.00 750.00 900.00 900.00 900.00 5 950.75 5 1,199.28
3,200 Accumulations 2,042.45 3,037.44 4,247.97 5,720.78 7,512.68 9,692.79 12,345.24 15,572.35 3,200
A n n u i t y — T o t a l 649.11 896.10 1,164.11 1,457.69 1,632.37 1,889.80 2,406.91 3,036.14 3,200
Employee 199.11 296.10 414.11 557.69 732.37 944.90 1,203.47 1,518.07 3,200
Government 450.00 600.00 750.00 900.00 900.00 5 944.90 5 1,203.47 5 1,518.07
3,800 Accumulations 2,471.36 3,675.28 5,140.03 6,922.12 9,090.31 11,728.24 14,937.69 18,842.48 3,800
A n n u i t y — T o t a l 690.92 958.28 1,251.07 1,574.80 1,786.17 2,286.66 2,912.40 3,673.72 3,800
Employee 240.92 358.28 501.07 674.80 886.17 1,143.33 1,456.20 1,836.86 3,800
Government 450.00 600.00 750.00 900.00 900.00 5 1,143.33 5 1,456.20 5 1,836.86
4,600 Accumulations 3,043.23 4,525.75 6,329.41 8,523.91 11,193.82 14,442.17 18,394.30 23,202.65 4,600
A n n u i t y — T o t a l 746.67 1,011.19 1,367.02 1,730.95 2,182.46 2,815.78 3,586.34 4,523.82 4,600
Employee 296.67 441.19 617.02 830.95 1,091.23 1,407.89 1,793.17 2,261.91 4,600
Government 450.00 600.00 750.00 900.00 5 1,091.23 5 1,407.89 5 1,793.17 5 2,261.91
5,600 Accumulations 3,758.08 5,588.83 7,813.20 10,526.14 13,823.21 17,834.58 22,715.05 28,652.87 5,600
A n n u i t y — T o t a l 816.36 1,144.83 1,523.92 2,052.28 2,695.10 3,477.20 4,428.74 5,586.44 5,600
Employee 366.36 544.83 761.96 1,026.14 1,347.55 1,738.60 2,214.37 2,793.22 5,600
Government 450.00 600.00 5 761.96 5 1,026.14 5 1,347.55 5 1,738.60 5 2,214.37 5 2,793.22 1 Fixed salary for entire period of service or equivalent.
2 Accumulations are figured at 3½ percent of salary less $1 a month plus
interest at 4 percent, on basis of act as amended M a y 29, 1930.
3 Employee a n n u i t y is figured b y factor .0974849 effective Feb. 1, 1940, for
age annuities and optional 30-year service retirement. Different factors are used for disability annuities. Comparable annuities for women would be less, because figured b y factor .0876211. I f employee elects to receive a single life annuity w i t h forfeiture to fund of any balance to his credit at time of death, a n n u i t y would be larger.
4 T o t a l a n n u i t y computed by Plan I I , guarauteed-minimum annuity. All
other annuities figured under Plan I which gives larger annuities under con-ditions specified.
5 Government annuity, equal to employee's purchasable annuity,
accord-ing to 1939 amendment.
Source: U . S. C i v i l Service Commission, Retirement Division, Actuarial Section.
and corresponding life expectancy of the annuitant and with the election of a forfeiture or nonfor-feiture type of annuity. For a m a n w i t h the minimum requirement of 15 years of service (after 1930) and a salary of $1,260 per year, this formula yields a nonforfeiture annuity at retirement age 709 of $513.92 (table 3 ) ; for a woman, $507.45; $450 of each amount is the Government allow-ance. Since only the purchasable part of the annuity increases with the salary grade, the annu-ity for a man w i t h 15 years of service and a salary of $4,600 would be only $746.67, while for one at the $5,600 a year level i t would be $816.36. On the other hand, a man who had an annual salary of $2,000 b u t who had 30 years' service would be eligible for $1,223.46 at the time of his retirement.
The weighting of the Government annuity, and hence of the total annuity, for years of service may be seen from the following tabulation of the annuities payable to men retiring at age 70, w i t h approximately the same amount of accumulations for the purchase of annuities, b u t w i t h varying salary and service records:
Annual salary Years of service Total ac- cumula-tions 1
Total an-n u i t y
Purchas-able an-n u i t y
Govern-ment an-n u i t y $5,600 15 $3,758.08 $816.36 $366.36 $450
3,800 20 3,675.28 958.28 358.28 600 2,600 25 3,355.92 1,077.15 327.15 750 2,000 . 30 3,318.10 1,223.46 323.46 900 1,620 35 3,358.25 1,227.38 327.38 900 1,440 40 3,722.15 1,262.85 362.85 900
1 Deductions minus tontine plus interest.
The increase in the total annuity for years of service above 30 is slight, because the Government portion of the annuity remains at $900 for all the employees cited above w i t h 30 years or more of service However, an amendment effective Janu-ary 1, 1940, provides that the Government portion of the annuity shall not be less than an amount equal to the employee's purchasable annuity. This amendment affects employees w i t h relatively large salaries, long service, or both (table 3 ) ; for example, those w i t h $2,600 salaries if they have
9The Government annuity is computed similarly for employees in the 65 and 62-year retirement age groups, but the amount of annuity purchased with the employees' own contributions is smaller because of the greater life expectancy at the younger ages. The purchasable annuity is calculated by multiplying the accumulations by the following factors:
62-year group: men, .0796495; women, .0731529; 65-year group: men, .0854628; women, .0778816; 70-year group: men, .0974849; women, .0876271.
If on retirement an employee elects to forfeit the fund any balance of his accumulations to his credit at the time of his death, the annuity is increased.
had almost 44 years of service or those w i t h salaries of $5,600 and a little more than 24 years of service. A n employee w i t h exactly 30 years of service is not affected unless his salary averaged $4,954 or more.
Plan I I , the guaranteed-minimum annuity plan, allows for each year of service (not exceeding 30) one-fortieth of the highest average annual basic salary (not exceeding $1,600) received during any 5 consecutive years of service; i n other words, a maximum of 30 times $40. I t is this plan which has given many employees w i t h 30 years or more of service and a salary of $1,600 or more for 5 consecutive years the $1,200 per year which has been considered the standard civil-service annuity.
However, for an employee w i t h the m i n i m u m -service requirement of 15 years and a salary of $1,260, the plan yields only $472.50—less than Plan I .
Plan I I is used whenever i t will yield a higher annuity than Plan I . A t the lowest salaries, where one-fortieth approaches or is less than the $30 Government contribution per year under Plan I I , Plan I , w i t h its addition of the purchas-able annuity, provides more liberal benefits. For salaries of $1,600 or more, where the $40 maximum per year of service applies, Plan I will yield more if the purchasable annuity is more than one-third of the Government allowance of $30 per year of service. However, for salaries of $1,440 to $2,000, when the accumulations from years of service are so meager as to make the purchasable annuity small i n comparison w i t h the Government allowance, the guaranteed-minimum plan yields a larger annuity (table 3). M o s t retirements to date have been under Plan I I , since the annuity which could be purchased b y the accumulations from employee contributions since 1920, usually on only a portion of the employee's Government service, is a relatively small fraction of the annuity granted.
Like the railroad retirement system and many private pension plans, the civil-service retirement system meets the problems of employees who were already i n Government service before the estab-lishment of the system b y the allowance—up to $30 under Plan I or u p to $40 under Plan I I — f o r each year of service (up to 30 years), whether before or after the establishment of the system. I t makes no provision, however, for the retire-ment of employees w i t h a short period of service i n
covered Federal employment, i . e . , employees already of advanced age when they enter Govern-ment service.1 0 The relatively high m i n i m u m -service requirement for retirement on account of age—15 years—and the proportionate weighting of the annuity for years of service are i n sharp contrast to the old-age and survivors insurance provisions under the Social Security A c t i n which prior-service credits1 1 are not provided and the increment for years of service is a relatively minor fraction of the total annuity.
The formulas used for age annuities under the C i v i l Service Retirement A c t are used i n figuring disability benefits for employees who are " t o t a l l y disabled1 2 for useful and efficient service i n the grade or class of position occupied," b u t only 5 years of service, rather than 15, are required. Obviously the formulas produce small annuities for employees disabled after the m i n i m u m length of service—about $165 under Plan I for entrants after June 30, 1930, w i t h a salary of $1,260, and $200 under Plan I I , for salaries of $1,600 to $3,500.
I t is significant to note that these disability benefits are for total disability measured against the specific occupations, and must n o t be confused w i t h the permanent-total disability requirements " f o r any gainful work or h i r e " found in other dis-ability retirement systems.
For employees involuntarily separated from the service after 30 years' employment under a special provision of the Independent Offices Appropria-tion A c t (the so-called Economy A c t ) effective between June 16, 1933, and July 1, 1935, annuities were computed as i n automatic age retirement b u t reduced by 3 1/2 percent until the annuitant reaches normal retirement age.
When applied i n involuntary separation of em-ployees at least 45 years of age w i t h 15 or more years of service who elect annuities to begin at 10 The possibility of large numbers of employees reaching retirement age without 16 years of service is eliminated by age limits for entering the classified service, which, however, do not apply to persons with veteran preference.
11 The old-age and survivors insurance formula, which attempts to meet the problem of employees in covered employment before the establishment of old-age insurance by an average-wage formula instead of prior-service credits, would, in the early years of its operation, contribute toward meeting the needs of older workers entering covered employment for the first time. How-ever, as the program matures and the period lengthens during which such workers could have earned wages in covered employment, the reduction in the average wage will reduce the amount of benefits available for workers entering covered employment into in life.
12 Employees disabled by a work-connected accident may choose between disability benefits under the Civil Service Retirement Act and benefits pro-vided by the Federal Compensation Act of 1916, administered by the United States Employees' Compensation Commission.
Chart 2.—Annuitants on the roll of the three retirement and disability funds administered by the Civil Service Commission, and annual value of the roll, fiscal years ended 1921-40
Source: Table 4.
age 55 or at separation, whichever is later, the formula yields small annuities not only because of the fewer years of service b u t also because of an adjustment for the longer life expectancy at the earlier retirement age. For instance, a de-ferred annuity of $600 at age 70, based on 15 years' service, would yield only $286.68 per year at age 55.
The Civil Service Retirement A c t makes no general provision for survivors' benefits,
compara-ble to those of the old-age and survivors insurance program of the Social Security Act.1 3 I n January 1940, a provision for j o i n t and survivor annuities similar to that of the Railroad Retirement Act went into effect. A n y employee retiring under the age or 30-year-service provisions may elect at retirement a lower annuity during his lifetime in order that, after his death, his widow or other designated beneficiary m a y receive an annuity during her lifetime. The amounts payable de-pend on the life expectancy of the employee at retirement, as well as of the beneficiary, as deter-mined by their age and sex, and also on the choice of a survivor's annuity equal to, or 50 percent of, the employee's annuity. I n the first 6 months of its operation, approximately 3.9 percent of the annuitants retired for age or service elected this type of annuity.
A n annuitant who has not elected a j o i n t and 13 See Bronson, D . C., "Old-Age and Survivors Insurance in Its Relation to Public Employees," Social Security Bulletin, Vol. 3, No. 5 (May 1940), pp. 10-16.
survivorship annuity may elect a forfeiture or nonforfeiture annuity. I f he elects a nonforfei-ture annuity, any unexpended balance of his accumulations is payable to his designated bene-ficiary or to his estate upon his death. The for-feiture annuity is larger because the annuitant agrees to forfeit to the fund any balance of his accumulations at his death. The Government's share of the annuity is always on a forfeiture basis. When employees die before retirement, lump-sum refunds are made of all their contributions plus interest.
Growth of the Retirement Roll
During the first decade of the operation of the Civil Service Retirement A c t , the retirement roll grew slowly (chart 2). A t the end of the first year of operation (June 1921) 6,500 retired civil employees were drawing benefits at the rate of $3.7 million per year. B y June 1930 annuitants had increased to 17,800, and the annual amount payable, to $13.5 million. After the liberaliza-tion of the retirement law by the 1930 amend-ments, the increase was more rapid. B y June
1940, the number of annuitants had increased to
62,000; the annual value of the roll to $59.9 million (table 4).
Total disbursements for monthly benefits under the Civil Service Retirement A c t during the 20 years were $508.3 million (table 2). Disburse-ments of $4.7 million from the Canal Zone retire-ment and disability fund and of $210,000 from the Alaska Railroad retirement and disability fund increase the total annuity payments to $513.2 million.
Between 1921 and 1940, $95.1 million was returned to employees leaving the service or to survivors of deceased employees or annuitants under the civilservice retirement plan, $95.9 m i l -lion under the three plans administered b y the C i v i l Service Commission. More than half a million employees withdrew their deposits upon leaving the service and lost the rights which they had been accumulating for old-age and disability benefits. A small proportion of these workers re-placed their deposits upon returning to classified Federal employment.
D u r i n g the 5 fiscal years 1935-36 to 1939-40 for which data on amounts of refunds are separable (table 5), more than 75,500 employees who were
Table 4.—Annuitants on the roll of the three retirement and disability funds administered by the Civil Service Commission and annual value of the roll, June 30, 1921-40
Year
Annuitants on the roll
Annual value of the roll (in thousands) Year
T o t a l C i v i l Service Canal Zone Railroad Alaska
Annual value of the roll (in thousands) Year
Total Age 1 b i l i t y
Disa- Invol-untary
separa-tion 2
T o t a l Age 3 b i l i t y
Disa- Invol-untary separa-tion 2
T o t a l Age 4 D i s a -b i l i t y
I n v o l -untary separa-tion 2
T o t a l 5 Age T o t a l Service C i v i l Canal Zone
Alaska Rail-road
1921 6,471 5,947 524 6,471 5,947 524 $3,678 $3,678
1922 7,576 6,667 909 7,576 6,667 909 4,277 4,277
1923 9,334 7,994 1,340 9,334 7,994 1,340 5,149 5,149
1924 10,548 8,895 1,653 10,548 8,895 1,653 5,762 5,762
1925 11,689 9,741 1,948 11,689 9,741 1,948 6,366 6,366
1926 12,524 10,277 2,247 12,521 10,277 2,247 6,833 6,833 1927 14,119 11,353 2,766 14, 119 11,353 2, 766 10,185 10,185 1928 15,383 12,173 3,210 15,383 12,173 3,210 11,290 11,290 1929 16,501 12,924 3,577 16,501 12,924 3,577 12,315 12,315 1930 17,768 12,504 3,994 1,270 17,768 12,504 3,994 1,270 13,493 13,493 1931 22,650 16,329 4,947 1,374 22,650 16,329 4,947 1,374 21,563 21,563 1932 25,724 18,299 6,016 1,409 25,567 18,190 5,973 1,404 157 109 43 5 24,632 24,425 $207 1933 33,083 24,189 7,344 1,550 32,835 24,015 7,281 1,539 248 174 63 11 32,019 31,691 328 1934 45,040 34,119 9,042 1,879 44,708 33,906 8,941 1,861 332 213 101 18 44,691 44,256 435 1935 49,031 37,021 9,994 2,016 48,665 36,782 9,886 1,997 366 239 108 19 48,567 48,082 482 1936 51,608 38,594 10,998 2,016 51,206 38,331 10,877 1,998 402 263 121 18 50,958 50,427 531 1937 53,796 39,576 12,180 2,040 53,306 39,241 12,044 2,021 458 305 135 18 32 30 52,921 52,282 602 $37 1938 56,685 41,118 13,486 2,081 56,130 40,740 13,340 2,050 507 338 139 30 48 40 55,620 44,887 682 51 1939 59,022 42,471 14,481 2,070 58,385 42,041 14,315 2,029 578 383 155 40 59 47 57,909 57,074 776 59 1940 62,706 45,177 15,471 2,058 62,027 44,714 15,294 2,019 611 409 164 38 58 54 60,766 59,879 820 67
1 See footnotes 3 and 4.
2 After 15 years or more of service and at least 45 years of age.
3 Includes involuntary separation, 1921-30: voluntary retirement after 30
years' service, 1931-40; and involuntary retirement after 30 years' service, 1934-40.
4 Includes voluntary and involuntary retirement after 30 years' service and
voluntary retirement after 25 years' service.
5 Difference between total and age annuitants represents disability a n n u i
-tants except for 1 involuntary separation each year.
Source: U . S. C i v i l Service Commission, 57th Annual Report, fiscal year ended June 30, 1940, p p . 143, 145, 146, tables 18, 20, 22.
Table 5.—Refunds from the three retirement and
dis-ability funds administered by the Civil Service
Com-mission, fiscal years 1935-36 through 1939-40 1
F u n d and type of refund N u m b e r amount (in T o t a l
thousands) amountAverage 2
T o t a l 101,147 $37,894
T o separated employees 75,513 15,283 $202 C i v i l Service 74,530 15,023 202
Canal Zone 607 235 387
Alaska Railroad 376 25 65
T o survivors of deceased employees 3 14,912 15,745 1,056
C i v i l Service 14,791 15,581 1,053
Canal Zone 103 159 1,542
Alaska Railroad 18 5 290
T o survivors of deceased annuitants 3 10,722 6,867 640
C i v i l Service 10,621 6,762 637
Canal Zone 89 94 1,655
Alaska Railroad 12 10 850
1 Data for Alaska Railroad retirement and disability fund cover only 4
years 1936-37 through 1939-40, complete period of operation.
2 Computed from unrounded data.
3 N u m b e r of employees or annuitants w i t h respect to w h o m payments
were made, not number of beneficiaries receiving payments.
Source: Unpublished data from the Actuary of the Retirement Division of the C i v i l Service Commission. See also p. 96, table 4.
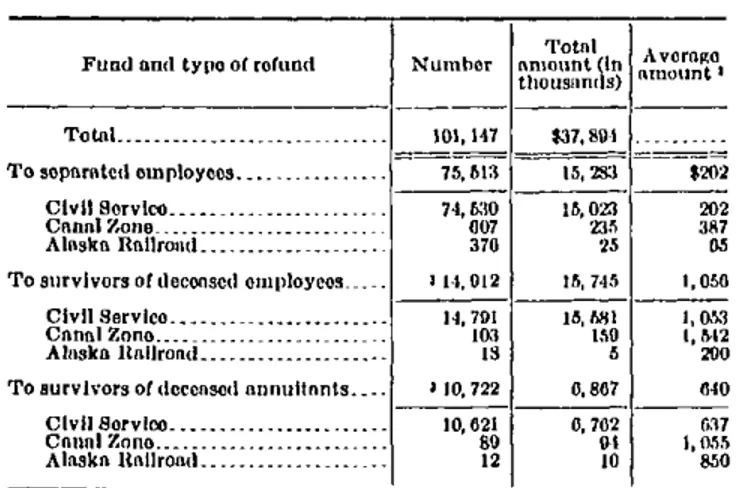
separated from employment withdrew deposits exceeding $15 million, or an average of $202. Almost 15,000 employees died while in active service. Their contributions to the retirement fund, paid to their survivor's, also exceeded $15 million, or an average of $1,056. Almost 11,000 annuitants died w i t h an unexpended balance of accumulations in the retirement fund. The amount paid to their survivors totaled almost $7 million, or an average of $640. Table 5 shows separately the refunds reported for the three systems administered by the Civil Service Com-mission. The total amounts paid from the Canal Zone and Alaska Railroad retirement funds are small, but the variations in average payments are significant. The higher salaries of Canal Zone employees are reflected in the higher average amounts paid w i t h respect to such employees, while the short period of service covered by the Alaska Railroad Retirement A c t is reflected in lower average amounts paid w i t h respect to em-ployees under that act.
Characteristics of Annuitants
The annuitants on the roll June 30, 1940, are a cross section of Government employees who have retired between 1920 and 1940. Their average number of years on the roll was 6.3; the largest number of annuitants and the median annuitant had been on the roll 6 years. Their ages
(averag-ing 67.8) varied from 26 for the youngest disability annuitant to 120 for the oldest age annuitant. Their service averaged 27.3 years; i t varied from 5 years to 64 years; and i t began as early as 1868 or as recently as 1935.
The majority of the annuitants were men, and in the 65-year retirement age group (table 6). M o r e than 57 percent of the total annuitants and more than 61 percent of the men on the roll were former Post Office Department employees (table 1). Almost four-fifths of these 35,000 Post Office annuitants were letter carriers or post-office clerks, laborers, and mechanics, who are automatically retired at age 65 if they have had 15 years' service or optionally at age 63 if they have had 30 years or more of service; another eighth were railway postal clerks, who retire at age 62. The next largest percentage—12.2—of the total annuitants were N a v y Department employees, principally navy-yard mechanics and laborers in the 62-year retire-ment group. Only 8 other departretire-ments or estab-lishments accounted for as much as 1 percent of Table 6.—Number and percentage distribution of
civil-service annuitants on the roll, by sex, statutory age of retirement, and cause of retirement, June 30, 1940
Sex and statutory age of retirement Total
Cause of retirement Sex and statutory age
of retirement Total Age
Retirement after 30 years' service
Disa-bility
Invol-untary separa-tion 3
Sex and statutory age of retirement Total
Age
Volun-tary 1
Invol-untary 2
Disa-bility
Invol-untary separa-tion 3
Total 62,027 30,216 6,318 8,180 15,291 2,019 T o t a l , men 54,997 27,795 5,951 7,665 11,874 1,712 62 years 11,234 7,204 1,274 511 1,958 287 65 years 34,270 16,017 3,990 6,132 7,244 857 70 years 9,493 4,544 687 1,022 2,672 568 Total, women 7,030 2.421 367 515 3,420 307
62 years 121 67 5 0 48 1
65 years 2,947 1,176 175 183 1,289 124 70 years 3,962 1,178 187 332 2,083 182 Percentage distribution by cause of retirement Total 100.0 48.7 10.2 13.2 24.7 3.2 Total, men 100.0 50.6 10.8 13.9 21.6 3.1 62 years 100.0 64.1 11.3 4.6 17.4 2.6 65 years 100.0 46.8 11.7 17.9 21.1 2.5 70 years 100.0 47.9 7.2 10.8 28.1 6.0 T o t a l , women 100.00 34.4 5.2 7.3 48.7 4.4 62 years 100.0 55.4 4.1 39.7 .8 65 years 100.0 39.9 5.9 6.2 43.8 4.2 70 years 100.0 29.7 4.7 8.4 52.6 4.6
1 W i t h i n 2 years of retirement age. 2 Regardless of age; effective 1933--35 only.
3 After 15 years or more of service and at least 45 years of age.
Source: U . S. C i v i l Service Commission, Retirement Report, fiscal year ended June 30, 1940.
the total number on the roll, and only 4 additional agencies had as many as 100 annuitants.
The percentage distribution of the annuitants by department or establishment does not parallel the percentage distribution of employees in the classified service (table 1). Compare, for instance, the Post Office Department, with 40 percent of the classified covered employees and 57 percent of the annuitants, and the War Department, w i t h 15 percent of the employees and 7 percent of the annuitants; or the " a l l other agencies," including the newer agencies, with 5.3 percent of the classi-fied workers and 0.6 percent of the annuitants. Such differences may be explained in terms of the date at which an agency was established or periods of intensive hiring or lay-offs which influence the number of qualified employees reaching retirement age in future years, as well as the different statutory retirement ages for particu-lar groups predominating in the various agencies.
The relationship between statutory retirement age, sex, and cause of retirement is shown in table 6. The differences between men and women in distribution by reason for retirement are largely influenced by the differences in retirement age for their occupational groups. The majority of the men—62.3 percent—were in the 65-year statutory age group; the majority of the women—56.4 per-cent—were in the 70-year age group. Thus for the men there is more likelihood than for the women that the individual's state of health will permit working until the normal retirement age.
Almost one-fourth of the 62,000 individuals on the roll June 30, 1940, were disability annuitants. However, the proportion of disability annuitants varies greatly as between men and women and among the statutory retirement age groups. The higher the normal retirement age, the larger the proportion of employees retiring on account of the mental or physical disabilities of senescence prior to reaching retirement age.1 4 A m o n g the men, the proportion of disability annuitants varied from one-sixth for the 62-year group to almost three-tenths for the 70-year group. Almost half of the women on the roll were retired for disability, but less than two-fifths of those in the 62-year group and only slightly more than two-fifths of those in the 65-year group were retired for this reason.
14 See Altmeyer, A. J., "Social Security for Permanently Disabled Work-ers." Social Security Bulletin, Vol. 4, No. 3 (March 1941), pp. 3-10.
Similarly, the lower the retirement age, the larger the proportion of employees who are able to work until retirement age. While less than one-half of all annuitants were retired on account of age, almost two-thirds of the 62-year age group were retired for this cause. One-tenth of the annuitants but only one-twentieth of the women had taken advantage of the opportunity to retire 2 years before the regular retirement age which is available to employees w i t h 30 years or more of service. These voluntary retirements are essen-tially age retirements, since all employees covered were within 2 years of the statutory retirement age. They bring the total age retirements close to 60 percent of the total. Only 3 percent of the total annuitants represent involuntary separa-tions of employees 45 years of age or over w i t h 15 or more years of service, who elected monthly payments instead of cash refunds. However, 13 percent of all annuitants on the roll June 30, 1940, had been retired under the temporary pro-vision effective 1933-35, for involuntary retire-ment of employees w i t h 30 years or more of service, regardless of age. These annuitants were largely letter carriers and post-office clerks in the 65-year group. The table suggests, however, that this provision, like the disability provision, was used to retire employees whose normal retirement age was not adjusted to their individual working capacity.
Average Amount of Annuity
Under the original act of 1920, which set a maxi-m u maxi-m annuity of $720, the average annuity varied from $568 in 1921 to $545 in 1925. After the amendment of July 3, 1926, which raised the maxi-mum to $999.96, the average annuity rose to $721 in 1927 and to $759 in 1930. W i t h the present annuity formula, in force since 1930, the average has been as low as $952 in 1931 and as high as $990 in 1934. The average as of June 30, 1940, was $965. I n table 7, the distribution of annuitants on the roll as of June 30, 1940, by amount of annuity is shown in $100 intervals by cause of retirement. The effect of the guaranteed-minimum formula is clearly shown; more than one-third of all annui-tants and more than nine-tenths of those retiring voluntarily w i t h 30 years or more of service receive exactly $1,200, the amount yielded under this formula for 30 years or more of service at a salary of $1,600 or more.
Table 7.—Number of civil-service annuitants on the
roll, by amount of annuity and cause of retirement, June 30, 1940
A m o u n t of annuity 1 T o t a l
Cause of retirement A m o u n t of annuity 1 T o t a l
Age
Retirement after 30 years' service
Disa-b i l i t y
I n v o l -u n t a r y separa-tion 4
A m o u n t of annuity 1 T o t a l
Age V o l u n
-tary 2
I n v o l -untary 3
Disa-b i l i t y
I n v o l -u n t a r y separa-tion 4
Total 62,027 30,216 6,318 8,180 15,294 2,019 Less than $100 41 39 0 0 2 0
100-199 298 160 0 1 133 4
200-299 990 225 1 0 627 137
300-399 1,666 289 3 0 932 442 400-499 2,327 647 1 1 1,258 420 500-599 3,525 1,682 1 1 1,478 363 600-699 4,807 2,905 0 1 1,652 249 700-799 3,965 2,226 1 5 1,559 174 800-899 3,834 2,349 14 21 1,344 106 900-999 3,742 2,367 64 79 1,167 65 1,000-1,099 4,215 2,752 90 75 1,248 50 1,100-1,199 9,691 3,412 140 4,859 1,273 7 1,200 21,943 10,638 5,743 3,031 2,529 2 1,201-1,299 908 459 255 106 88 0
1,300-1,399 50 44 3 0 3 0
1,400-1,499 19 17 1 0 1 0
1,500-1,599 4 4 0 0 0 0
1,600-1,699 1 0 1 0 0 0
1,900-1,999 1 1 0 0 0 0
Average annuity $965 $973 $1,194 $1,170 $803 $538
1 T o nearest dollar.
2 W i t h i n 2 years of retirement age. 3 Regardless of age; effective 1933-35 only.
4 After 15 years or more of service and at least 45 years of age.
Source: U . S. C i v i l Service Commission, Retirement Report, fiscal year ended June 30, 1940.
A distribution of annuitants on the roll by years of service shows clearly the effect of length of service, especially service up to 30 years, on the amount of annuity. The average annuity of those retired on account of disability after 5-9 years' service is only $282; after 10-14 years, $473. I n contrast, the average annuity of all types based on 25-29 years of service is $1,035, and for the three 5-year groups 30-44, $1,167. The distribu-tion of length of service by sex and by type of annuity (table 8) shows that most classes of annui-tants w i t h 25 or more years of service have average annuities of $1,000 or more. As would be expected, because of the reductions made for annuities beginning between age 55 and retirement age, the average for employees involuntarily separated f r o m the service after age 45 is appreciably lower than for other types of annuities.
While the average annuity for women ($772) is 22 percent less than the average for men ($990), the difference is largely the result of the fact t h a t their average service is 16 percent less. For most groups, the average annuity for women is only 5 to 10 percent less than the average for men w i t h the same length of service. The benefit formula,
weighted i n favor of lower-salaried employees, reduces the effect of the women's lower average salaries.
Table 8 calls attention to the extremely long service of some annuitants. E v e n i n the so-called
"30-year-service group," 37 percent of the men and 50 percent of the women who retired volun-tarily before retirement age had had 35 years or more of service; 2 percent of the men and 8 per-cent of the women had worked for the Govern-ment 45 years or more. While disability annui-tants may retire w i t h as little as 5 years' service and 24 percent had less than 15 years, 22 percent of the men and 13 percent of the women had had 30 years or more of Government service. Although most of the annuitants who were separated invol-untarily after age 45 had had between 15 and 29 years of service, more than 11 percent of the men and 10 percent of the women i n this group had had 30 years or more of service. A few had worked 45 years or more but had not reached the optional retirement age.
The effect of years of service on the size of annuities is understated by the data i n table 8, since many of these annuitants had service before 1920, which is reflected only i n the Government annuity and not i n the annuity purchasable with the employee's contributions. Table 3, on the other hand, overstates the effect of years of service on the size of annuities granted to date, since the annuities are figured on a rate of contribution in effect only since 1930.
The increasing range of benefits reflects in part the influence of the accumulation of contri-butions. The highest annuity granted i n 1938 was $1,546; i n 1939, $1,651; i n 1940, $1,900. I n spite of the addition of a few annuitants at higher annu-ities, the average annuity i n 1940 is lower than the average i n recent years because of the retirement of a considerable number of low-salaried fourth-class postmasters, who first became eligible for annuity benefits on February 1, 1940.
Proposals for Changes
Some of the limitations of the protection provided by the civil-service retirement plan have already been mentioned: (1) the exclusion of large numbers of Federal workers not protected by any special retirement plan; (2) the heavy minimum-service requirements for age retirement; (3) the limited survivors' benefits provided; and (4) the
frequent dissipation of rights through return of
deposits when employees leave the service.
The operation of the latter two factors is now
being emphasized by the increasing shift of
em-ployees under the impetus of the defense program.
In addition to the migration of professional
employees from State and city to Federal
employ-ment, defense activities are drawing into the navy
yards and arsenals of the country many employees
previously covered by Federal old-age and
sur-vivors insurance. Many will not remain in
Federal employment long enough to acquire
retirement rights under the Civil Service
Retire-ment Act, while their rights to old-age and
sur-vivors insurance under the Social Security Act
diminish or vanish with the passage of time.
Various proposals to bridge this gulf between the
various systems are now being studied.
15The diverse retirement ages provided for
differ-ent groups of civil-service employees have long
been recognized as creating substantial
complica-tions. The establishment of the retirement age
of 65 under the Social Security and the Railroad
Retirement Acts challenges the equity of the
statutory 70-year retirement (68 with 30 years of
service) for one-third of the Federal employees
15 In an article on Personnel Administration in the Seventh Decade, Leonard D . White, formerly a Civil Service Commissioner, calls attention to the move-ment of city and State personnel to the Federal Governmove-ment and the limita-tion on such movement "if public retirement systems are widely inaugurated which fall to permit the transfer of pension accruals. The anticipated spread of pension plans, a necessary step forward, need not curtail freedom of move-ment if they are properly constructed, but will unless care is taken." Public Personnel Review, April 1940, pp. 1-9. See also Bronson, op. cit.Table 8.—Number of civil-service annuitants on the roll and average annuity, by sex, years of service, and cause of
retirement, June 30, 1940
Years of service at retirement
Total
Cause of retirement
Years of service at retirement
Total
Age
Retirement after 30 years' service
Disability I n v o l u n t a r y separation 3 Years of service at retirement
Total
Age
V o l u n t a r y 1 I n v o l u n t a r y 2
Disability I n v o l u n t a r y separation 3 Years of service at retirement
Number Average annuity N u m b e r Average annuity N u m b e r Average annuity N u m b e r Average annuity N u m b e r Average annuity N u m b e r Average annuity M e n annuitants
Total 54,997 $990 27,795 $990 5,951 $1,194 7,665 $1,171 11,874 $834 1,712 $552
5-9 940 287 940 287
10-14 1,730 475 1,730 475
15-19 8,231 623 5,290 629 2,272 668 669 424
20-24 6,960 836 4,400 855 2,085 865 475 530
25-29 8,767 1,049 6,169 1,061 2,229 1,074 369 684
30-34 17,591 1,171 5,290 1,165 3,717 1,193 6,503 1,169 1,929 1,183 152 780 35-39 6,203 1,174 3,393 1,164 1,403 1,196 855 1,182 518 1,183 34 816 40-44 3,404 1,171 2,304 1,161 679 1,197 279 1,191 132 1,184 10 900 45-49 959 1,160 765 1,152 129 1,204 26 1,185 37 1,184 2 791 50-54 191 1,126 163 1,114 23 1,205 2 1,200 2 1,200 1 1,035
55-59 20 1,042 20 1,042 0 0 0 0
60-64 1 1,143 1 1,143 0 0 0 0
Average service 27.8 28.2 34.2 32.0 21.8 22.2
Women annuitants
Total 7,030 $772 2,421 $779 367 $1,178 515 $1,149 3,420 $696 307 $456
5-9 323 268 323 268
10-14 698 467 698 467
15-19 1,975 593 778 573 1,037 643 160 372
20-24 1,169 737 513 715 582 791 74 457
25-29 779 886 414 848 323 970 42 622
30-34 1,100 1,098 294 978 182 1,171 321 1,147 288 1,142 15 664 35-39 536 1,096 191 1,016 90 1,176 139 1,142 104 1,159 12 688
40-44 278 1,116 118 1,048 66 1,191 46 1,175 45 1,162 3 577
45-49 138 1,111 87 1,068 22 1,196 9 1,184 19 1,193 1 732
50-54 29 1,063 21 1,010 7 1,205 0 1 1,200 0
55-59 5 772 5 772 0 0 0 0
Average service 23.4 25.5 36.0 34.2 19.1 20.9
1 Within 2 years of retirement age. 2 Regardless of age; effective 1933-35 only.
3 After 15 years or more of service and at least 45 years of age.
Source: U . S. C i v i l Service Commission, Retirement Report, fiscal year ended June 30, 1040.
covered by the Civil Service Retirement Act. I n its annual report for the fiscal year ended June 30, 1940, the Civil Service Commission stated, " T h e most important recommendation heretofore made by the Commission is that for a uniform compulsory retirement age of 70 after 15 years' service and a uniform optional retire-ment age of 60 after 30 years' service or 62 after 15 years' service. The optional provision should be available to the Government as well as to the employee." Similar proposals, but w i t h optional retirement "standardized at age 60 after 15 or more years of service," were made by a sub-committee of the President's Committee on Civil Service Improvement i n its report of February 1941, w i t h endorsement by the Committee, which urged favorable consideration by the Congress.
The subcommittee called attention to the " i m -portance of the provision of a retirement system which will have the effect of assisting to retain in the service of the Government able professional men, scientists, and administrators, and which will at the same time make certain their retire-ment when they have passed the height of their powers." Such a provision would offset to some extent the present weighting of the benefit formula in favor of the lower-paid worker. The subcom-mittee points out that the proportion of final pay allowable as an annuity under the present retire-ment act to annuitants whose rate of remunera-tion is more than $2,400 at the time of retirement varies from 18 to 25 percent. Believing " t h a t this proportion is not in accordance w i t h the i n
-terest of the public service i n attracting and hold-ing the high quality of professional, scientific, and administrative employees needed in the Govern-ment service," the subcommittee recommended that an annuity to an employee w i t h 40 years of service should be not less than half the highest average salary for any 5 consecutive years, with a proportional m i n i m u m allowance for employees having less than 40 years of service. I t recom-mended also that disability annuities be liberalized by the allowance of 10 years' service credit for all employees retired for disability with 5 to 10 years of service. To finance these additional benefits it was recommended that the employee contribution rate of 3 1/2 percent be increased to 4 1/2 percent, with a further increase for employees earning more than $3,120 per year.
In the first 2 months of the 77th Congress, 1941, 13 bills to amend the Civil Service Retirement Act were introduced. Of these, 5 proposed reducing, and in general standardizing, the retirement age. Others proposed extending coverage to groups which are now excluded; providing survivors' bene-fits for widows of employees and of annuitants; permitting employees who are separated from the service 5 years before becoming eligible for retire-ment to retain their retireretire-ment rights by continu-ing to make contributions until they are eligible for an a n n u i t y ; providing deferred annuities for persons separated from the service after 5 years' employment; and liberalizing the law in other ways, w i t h or without a corresponding increase in employee contributions.