Design of Fibre Reinforced Concrete
Beams and Slabs
Master of Science Thesis in the Master’s Programme Structural Engineering and Building Performance Design
AMMAR ABID, KENNETH B. FRANZÉN
Department of Civil and Environmental EngineeringDivision of Structural Engineering Concrete Structures
CHALMERS UNIVERSITY OF TECHNOLOGY
MASTER’S THESIS 2011:
Design of Fibre Reinforced Concrete
Beams and Slabs
Masterof Science Thesis in the Master’s Programme Structural Engineering and Building Performance Design
AMMAR ABID, KENNETH B. FRANZÉN
Department of Civil and Environmental Engineering
Division ofStructural Engineering Concrete Structures
CHALMERS UNIVERSITY OF TECHNOLOGY Göteborg, Sweden Göteborg, Sweden 2011
Design of Fibre Reinforced Concrete Beams and Slabs AMMAR ABID, KENNETH B. FRANZÉN
© AMMAR ABID, KENNETH B. FRANZÉN, Göteborg, Sweden 2011
Examensarbete / Institutionen för bygg- och miljöteknik, Chalmers tekniska högskola 2011:62
Department of Civil and Environmental Engineering
Division of Structural Engineering Concrete Structures
Chalmers University of Technology SE-412 96 Göteborg
Sweden
Telephone: + 46 (0)31-772 1000
Cover:
Above: (Left) Figure 3.4: Results from a bending test with a softening material behaviour, (Right) Figure 3.15: Stress-strain diagram for fibre reinforced concrete, from RILEM TC-162 TDF
Below: (Left) Figure 3.5: Post crack constitutive law, from FIB model code 2010, (Right) Figure 3.25: Multi-linear stress-strain diagram, from Spanish EHE-08
Name of the printers / Department of Civil and Environmental Engineering Göteborg, Sweden Göteborg, Sweden 2011
Design of Fibre Reinforced Concrete Beams and Slabs
Master of Science Thesis in the Master’s Programme Structural Engineering and Building Performance Design
AMMAR ABID, KENNETH B. FRANZÉN
Department of Civil and Environmental Engineering
Division of Structural Engineering Concrete Structures
Chalmers University of Technology ABSTRACT
Concrete is a material that needs strengthening in tension in order to meet the structural requirements. New techniques of strengthening concrete, besides the usual ordinary reinforcement bars, are developing, creating a need for new design methods. Fibre reinforcement is a method that has been in use over the last 30 years, yet it is unfamiliar to some and there is no common guideline for design using this method. This project evaluates three of the existing guidelines, namely the FIB model code, RILEM TC-162-TDF (2003) and the Spanish EHE-08, regarding design of fibre reinforced concrete, aiming at detecting possible difficulties, limitations and possibilities.
Design calculations, regarding moment- and shear resistance in ultimate limit state and crack width calculations in serviceability limit state, were carried out in Mathcad for simply supported beams, with different combinations of ordinary reinforcement and fibre dosages. The design results were then compared with existing experimental results to assess the accuracy of the design codes. The simply supported slabs were also designed in Mathcad, where two reference slabs with ordinary reinforcement were compared to concrete slabs only reinforced with fibres.
Regarding accuracy, the variation between the design codes and guidelines was small. However when compared to the experimental results, underestimations were revealed in all the guidelines. The FIB model code and the Spanish EHE-08 proved to be the most accurate.
Out of the three guidelines, evaluated in this project, the FIB model code was most applicable due the fact that it was complete and clear in most regards.
The design of the simply supported slabs revealed that, it is possible to replace ordinary reinforcement with steel fibres but requires large fibre fractions, as those used in this project were not enough.
Key words: concrete, steel fibres, fibre reinforced concrete, moment resistance, shear resistance, crack width calculations, fibre fractions
Contents
ABSTRACT I
CONTENTS III
PREFACE VI
1 INTRODUCTION 1
1.1 Aim 1
1.2 Method 1
1.3 Limitations 1
2 LITERATURE STUDY ON FIBRE REINFORCED CONCRETE 2
2.1 General 2
2.2 Fibre types and classification 2
2.2.1 Steel fibres 4
2.3 Steel fibre reinforced concrete 5
2.3.1 Post crack behaviour 5
3 DESIGN OF BEAM ELEMENTS 6
3.1 Experiments 6
3.1.1 Compressive strength 6
3.1.2 Tensile behaviour 7
3.1.3 Conventional reinforcement 8
3.1.4 Results 8
3.2 Design according to FIB model code 11
3.2.1 Residual flexural tensile strength 11
3.2.2 Moment resistance 15
3.2.3 Shear capacity 21
3.2.4 Crack width 24
3.2.5 Comparison with experimental results 26
3.2.6 Conclusions 28
3.3 Design of beams using RILEM 29
3.3.1 Flexural tensile strength 29
3.3.2 Residual flexural tensile strength 30
3.3.3 Moment resistance 33
3.3.4 Shear Capacity 38
3.3.5 Crack width 41
3.3.6 Comparison with experimental results 43
3.3.7 Conclusions 45
3.4 Design according to Spanish Guidelines 46
3.4.1 Residual flexural tensile strength 46
3.4.2 Moment resistance 48
3.4.5 Comparison with experimental results 54
3.4.6 Conclusions 56
3.5 Discussion 57
4 DESIGN OF SLAB ELEMENTS 61
4.1 FIB model code 61
4.2 Moment resistance 61
4.3 Conclusion 63
5 DISCUSSION 64
6 CONCLUSIONS 65
6.1 Further studies 65
7 REFERENCES 66
APPENDIX A: RESIDUAL TENSILE STRENGTH, ACCORDING TO RILEM TC-162 TDF (2003)
APPENDIX B: RESIDUAL TENSILE STRENGTH, ACCORDING TO SPANNISH EHE-08
APPENDIX C: EXAMPLE OF VARIATION IN PROPERTIES OF THE SAME MATERIAL
APPENDIX D: EXAMPLE FROM DESIGN OF BEAM ELEMENTS, ACCORDING TO FIB MODEL CODE
APPENDIX E: EXAMPLE FROM DESIGN OF BEAM ELEMENTS, ACCORDING TO RILEM TC-162 TDF (2003)
APPENDIX F: EXAMPLE FROM DESIGN OF BEAM ELEMENTS, ACCORDING TO SPANNISH EHE-08
Preface
This project is a part of a European project ‘Tailor Crete’ which aims at achieving more complex geometries in structures. This is done by developing new techniques such as different reinforcing methods.
The Report evaluates three of the existing national codes and guideline, namely the FIB model code, RILEM TC-162-TDF (2003) and the Spanish EHE-08, regarding design of fibre reinforced concrete, aiming at detecting possible difficulties, limitations and possibilities.
This master’s thesis was carried out, between January 2011 and June 2011, at the Department of Civil and Environmental Engineering, Chalmers University of Technology, Göteborg, Sweden.
We would like to thank our examiner Ph.D. Karin Lundgren and supervisor Ph.D. Rasmus Rempling, at Chalmers, for their support and guidance throughout the entire project period. We would also like to thank Ph.D. student David Fall for all his support.
Göteborg June 2011
Notations
Roman upper case letters
Gross concrete section area
Effective area of concrete
Area of the tensile part of the concrete cross section
Area of the fibre cross section Area of bonded active reinforcement Area of steel reinforcement
Area of shear reinforcement
Concrete modulus of elasticity
Mean modulus of elasticity for concrete
Modulus of elasticity for steel
Resulting residual tensile stress of the fibres
Load corresponding to crack mouth opening displacement
L Span of the specimen
Length of the steel fibre
Cracking moment Yield moment Ultimate moment
Number of fibres per unit area
Longitudinal force in the section due to loading or pre-stressing
Prestressing force
Shear resistance for members without shear reinforcement Shear resistance for members without shear reinforcement
Maximum shear resistance
Volume of the fibres in the concrete mix
Contribution of fibres to shear resistance Contribution of fibres to shear resistance Shear resistance
Concrete contribution to shear resistance Fibre contribution to shear resistance
Shear reinforcement contribution to shear resistance Minimum value of shear resistance
Contribution of stirrups or inclined bars to shear resistance
Section modulus Section modulus
Roman lower case letters
Height of notch Width of beam
Width of the flanges
Width of the web Concrete cover
Effective depth
Depth of active reinforcement from the most compressed fibre in the section
Depth passive reinforcement
Eccentricity of the prestressing relative to the center of gravity of the gross section
Cube strength
Cylinder strength Mean concrete strength
Mean tensile concrete strength Mean concrete compressive strength Design tensile strength, see Figure 3.25 Design value of the flexural tensile strength Design residual tensile strength, see Figure 3.25 Design residual tensile strength, see Figure 3.25
Compressive strength
Flexural tensile strength Mean residual tensile strength
Serviceability residual tensile strength, see Figure 3.7 Ultimate residual tensile strength, see Figure 3.7
Design value of the tensile strength of bonded active reinforcement Design residual flexural strength
Residual flexural tensile strength corresponding to crack mouth
opening displacement
Residual flexural tensile strength corresponding to crack mouth
opening displacement
Ultimate steel reinforcement stress Yield steel reinforcement stress
Yield strength of the shear reinforcement
Height of beam Height of the flanges
Distance between the notch tip and the top of the specimen
Factor taking bond properties of ordinary reinforcement into account Coefficient taking strain distribution into account
Factor taking size effect into account
Coefficient taking into account non-uniform self-equilibrating stresses leading to reduction of cracking force
Coefficient taking into account, the stress distribution in the cross section just before cracking and the change of inner lever arm
Curvature at cracking
Factor taking contribution of flanges in T-section into account Size factor
Ultimate curvature
Factor taking size effect into account Curvature at yielding
l Span of the specimen
Critical length of the element
Fibre length Free span length
The length over with slip between concrete and steel occurs
Span length
Spacing between shear reinforcement Mean distance between cracks
Mean crack spacing
Design crack width
Fibres centre of gravity from the neutral axis
Fibres centre of gravity seen from the top of the tensile zone given as a
percentage of the distance
Height of compressive stress block in ultimate limit state Distance from top of the beam to the neutral axis
Distance between the neutral axis and the tensile side of the cross section
Internal lever arm
Lever arm for the tensile zone
Greek lower case letters
Angle of shear reinforcement Modular ratio
Modular ratio
Coefficient taking bond properties of the steel reinforcement bars into account
Coefficient taking duration of loading into account
Distance from the top of the beam to the center of the concrete compressive zone
Empirical coefficient to assess the mean strain over Partial safety factor for concrete
Displacement at the maximum load
Displacement at service load computed by performing a linear elastic
analysis with the assumptions of uncracked condition and initial elastic Young’s modulus
Ultimate displacement
Strain in the concrete when the ordinary reinforcement reaches
yielding
Average concrete strain over Concrete strain due to shrinkage Ultimate strain in the concrete Concrete compressive strain Tensile strain
Strain at cracking
Average steel strain over
Factor taking size effect into account Factor that defines the effective strength Fibre efficiency factor
Fibre efficiency factor for beam elements
Fibre efficiency factor obtained from the wedge splitting tests
Factor which takes long term effects into account Factor that reduces the height of the compression zone Steel reinforcement ratio
Effective steel reinforcement ratio
Steel reinforcement ratio Principal tensile stress
Bridging stress applicable for the beam elements
Experimental bridging stress from the wedge splitting tests
Average stress acting on the concrete cross section for an axial force Contribution from axial compressive force or pre-stressing
Steel stress in a crack
Maximum steel stress in a crack in the crack formation stage Mean bond strength between reinforcing bars and concrete Design value of increase in shear strength due to steel fibres
Diameter of the steel fibre Ordinary reinforcement bar size Steel reinforcement diameter
Abbreviations
CEB Euro-International concrete committee CMOD Crack mouth opening displacement EHE Spanish code on structural concrete
FIB International federation for structural concrete FIP International federation for pre-stressing FRC Fibre reinforced concrete
LOP Limit of proportionality
RILEM International union of laboratory and experts in construction materials, systems and structures
1
Introduction
Concrete has proved to be a versatile material in the construction of structures due to the possibility of moulding it into virtually any shape and geometry. Utilizing this formable nature of the material, concrete architecture has made rapid progress in the recent years. Concrete is a material with varying material behaviour with high strength in compression but poor in tension. This has led to a need for reinforcement in the tensile parts of the structures. Traditionally this has been done using ordinary reinforcing bars. However, the need for designing structures with more complex geometries has led to the development of relatively new reinforcement materials such as steel fibres, which have further raised the potential of designing such geometries. Steel fibres can partly or entirely replace conventional reinforcement owing to the fact that steel fibres also increase the load carrying capacity of structures and improve crack control.
Development of new reinforcing methods has left a need for the development of new design methods. Today, there are a number of different national guidelines and design codes for designing steel fibre reinforced concrete, but no general European design code exists.
1.1
Aim
The report aims at surveying the applicability and accuracy, in the ultimate limit state regarding moment and shear capacities and in the serviceability limit state regarding crack width calculations, from three of the existing design codes and guidelines namely
FIB model code, RILEM TC-162-TDF (2003) and the Spanish EHE-08, in order to
detect possible difficulties, limitations and possibilities.
1.2
Method
A literature study was done on fibre reinforced concrete to gain knowledge about the materials and their behaviour, strength and properties. In this report, results from experimental tests found in literature, on beams with varying fibre contents, performed by Gustafsson and Karlsson in 2006, were used as reference values and their material data and properties were used as input data for the design calculations. These design calculations were then compared with the results from the experimental tests to check the accuracy of the methods. Literature on full scale slab experimental tests was found but due to the difficulties in retrieving their material properties and data, the same material properties from the beam experiments were used for slab design.
1.3
Limitations
Only simply supported beams and flat slabs with rectangular cross sections were considered in the design. The report only treats short steel fibres, randomly spread in the concrete combined with ordinary reinforcement. The report has focused on steel fibre reinforced concrete elements with self-compacting concrete having a post crack softening behaviour for the reason that experimental results used for comparison had this behaviour. No long term effects were considered.
2
Literature study on fibre reinforced concrete
2.1
General
Fibre reinforced concrete (FRC) is a concrete mix containing water, cement, aggregate and discontinuous fibres of various shapes and sizes.
According to Bentur & Mindess (2006), fibres have been used as reinforcement for quite some time now. Asbestos was the first material widely used in the beginning of the 20th century. Man-made fibres produced from steel, glass, synthetics, asbestos and natural fibres such as cellulose, sisal and jute, are examples of materials that are used in FRC today.
Unreinforced concrete is as known, a brittle material with high compressive strength but low tensile strength. Therefore, concrete requires reinforcement. The most known method has been, using ordinary continuous reinforcing bars in order to increase the load carrying capacity in the tensile and shear zones. Fibres that are short materials randomly spread in the concrete mix, are however discontinuous. Fibres do not increase the (tensile) strength remarkably, but due to their random distribution in the mix, they are very effective when it comes to controlling cracks. As a result the ductility of fibre reinforced members is increased. Fibres can also be used in thin and complex members where ordinary reinforcement cannot fit.
2.2
Fibre types and classification
According to Naaman (2003), fibres used in cementitious composites can be classified with regard to:-
1. Origin of fibres
According to origin, the fibres can be classified as:
Natural organic (cellulose, sisal, bamboo, jute etc.), natural inorganic (asbestos, wollastonite, rock wool etc.) and man-made (steel, glass, synthetic etc.)
2. Physical/Chemical properties
Fibres are classified based on their physical/chemical properties such as density, surface roughness, flammability, reactivity or non-reactivity with cementitious matrix etc.
3. Mechanical properties
Fibres are also characterized on the basis of their mechanical properties e.g. specific gravity, tensile strength, elastic modulus, ductility, elongation to failure, stiffness, surface adhesion etc.
4. Shape and size
Classification of fibres is also based on geometric properties, such as cross sectional shape, length, diameter, surface deformation etc. Fibres can be of any cross sectional shape such as circular, rectangular, diamond, square, triangular, flat, polygonal, or any substantially polygonal shape. Figure 2.1 and Figure 2.2 show the different cross sectional geometries of fibres.
Figure 2.1 Cross sectional geometries of fibres, Löfgren (2005)
Fig 2.2 Typical geometries of fibres, Löfgren (2005)
The basic fibre categories are steel, glass, synthetic and natural fibre materials. In Table 2.1, typical physical properties of a few fibres are listed.
Table 2.1 Physical properties of typical fibre, from Löfgren (2005)
2.2.1
Steel fibres
Steel fibres are the most commonly used man-made metallic fibres generally made of carbon or stainless steel. The different mechanical properties for steel fibres are given in Table 2.1, according to which the tensile strength is in the range of 200-2600 MPa and ultimate elongation varies between 0.5 and 5%. It can be said, according to Jansson (2008), that pull-out tests, where the fibres have been of much higher strength than the concrete, yielding in the fibres has not been the issue but spalling of the concrete. With a minimum strength of 200 MPa, it can be concluded that the yielding strength is sufficient enough to prevent fibre rupture.
According to Bentur and Mindess (2006), fibres are added and treated as any other component in a concrete mix, but due to difficulties in handling, only about 2 volume percent can be applied.
Today, straight fibres are very rarely used due to their weak bonding with the cement matrix. It is however, quite common to use brass-coated straight fibres with high strength concrete mix since the bond obtained is relatively strong, see Lutfi (2004) and Marcovic (2006).
2.3
Steel fibre reinforced concrete
Steel fibre reinforced concrete is a composite material made up of a cement mix and steel fibres. The steel fibres, which are randomly distributed in the cementitious mix, can have various volume fractions, geometries, orientations and material properties, see Löfgren (2005).
It has been shown that fibres with low volume fractions (<1%), in fibre reinforced concrete, have an insignificant effect on both the compressive and tensile strength, Löfgren (2005). They however, contribute to the toughness and post cracking behaviour of the concrete. This behaviour can be measured as a flexural tensile strength and determined through different experimental test methods, where three point and four point bending tests are the most commonly used methods, see Löfgren (2005). Other noteworthy methods are wedge splitting tests (WST) and uni-axial tension tests (UTT).
Experiments, performed by Özcan et al. (2009), on steel fibre reinforced concrete beams with varying fibre dosages, revealed that fibres have a negative impact on the compressive strength and modulus of elasticity, as both decreased with increasing fibre dosages. The experiments however showed that the fibres have a positive effect on the toughness of the specimen, as the toughness increased with increasing fibre dosages, for more details see Özcan et al. (2009).
Today fibre reinforced concrete is mainly used on industrial ground floors, where the slabs on the ground are exposed to heavy repetitive loads from e.g. trucks and lifts, in order to increase the durability of the ground slabs and increase the strength against cracking. Another area where fibres are used is in tunnel linings, where the fibres contribute to increased strength against shrinkage and reduction of permeability as tunnels are often subjected to water or soil loads.
2.3.1
Post crack behaviour
The behaviour of fibre reinforced concrete, varies with composition and can have a softening or hardening behaviour, see Figure 2.3. Post crack hardening allows multiple cracks before failure while in post crack softening there is a reduction of strength after the first crack allowing no further cracks.
3
Design of beam elements
Design of beam elements with three of the existing national guidelines and design codes was carried out to investigate differences and applicability. The design results were compared with experimental results to check their accuracy.
3.1
Experiments
The four point beam bending tests reviewed here have been carried out by Gustafsson and Karlsson (2006), see also Jansson (2008). The study contained 5 series with 3 beams tested in each series, see Table 3.1. The first series contained only conventional reinforcement, while the other series (2-5) contained different amounts of fibres as shown in Table 3.1 and Table 3.2. All tested beams had three reinforcing bars with a diameter of either 6mm or 8mm. The concrete composition used in the bending tests had a post crack softening behaviour.
Table 3.1 Details of test specimen reinforced with 8mm reinforcement bars
Series Fibre Content %/[kg/m3]
Reinforcement number and diameter [mm]
Number of beams
Number of WST cubes
Number of Compression
cubes
1 - 3ø8 3 9 6
2 0.5/39.3 3ø8 3 9 6
Table 3.2 Details of test specimen reinforced with 6mm reinforcement bars
Series Fibre Content %/[kg/m3]
Reinforcement number and diameter [mm]
Number of beams
Number of WST cubes
Number of Compression
cubes
3 0.5/39.3 3ø6 3 9 6
4 0.25/19.6 3ø6 3 9 6
5 0.75/58.9 3ø6 3 9 6
A self-compacting concrete, with w/b-ratio 0.55, was used in the experiments. For more information see Gustafsson and Karlsson (2006).
3.1.1
Compressive strength
In each series a total of 6 compression cubes have been tested in order to determine the compressive strength. The strength achieved for the concrete with only conventional reinforcing bars was 47 MPa while it varied between 36 MPa and 40
MPa for the fibre reinforced concrete, see Table 3.3. For equivalent cylindrical compression strength used in design, the cube strength is multiplied by a factor 0.8 derived from FIB model code 2010, Table 7.2-1 with both the strengths given and where, the cylinder strengths, are 80% of the cube strengths, .
Table 3.3 Average values of cube compression strength and equivalent cylinder compression strength from the tests on beams with 8mm reinforcement bars.
Series
Reinforcement
bars [mm] Fibre content [%]
Compression cube strength
[MPa]
Equivalent cylinder strength
[MPa]
1 3ø8 0 47.0 37.6
2 3ø8 0.5 38.2 30.6
Table 3.4 Average values of cube compression strength and equivalent cylinder compression strength from the tests on beams with 6mm reinforcement bars.
Series
Reinforcement
bars [mm] Fibre content [%]
Compression cube strength
[MPa]
Equivalent cylinder strength
[MPa]
4 3ø6 0.25 39.2 31.4
3 3ø6 0.5 37.7 30.2
5 3ø6 0.75 36.8 29.4
From the test results in Table 3.3 and Table 3.4, it is noted that fibres had a negative impact on the compression strength, as it was reduced with higher fibre content. It should however be mentioned, that the concrete composition had little variation.
3.1.2
Tensile behaviour
Nine wedge splitting tests (WST), on small cubes with a volume of 0.1x0.1x0.1 m3, were conducted for each series to determine the toughness of the steel fibres. For more details, also see Gustafsson and Karlsson (2006).
According to Löfgren (2005), it is necessary to consider fibre orientation and the number of fibres crossing a crack section. This is normally done by defining a fibre efficiency factor, , see equation (3.1).
(3.1) where
is the number of fibres per unit area
The fibre efficiency factor obtained from the wedge splitting tests used in this report varied, according to Gustafsson and Karlsson (2006), between 0.49 and 0.56. The fibre efficiency factor for the beams was also calculated theoretically, according to Dupont and Vandewalle (2005), and the value obtained by Gustafsson and Karlsson was equal to 0.54. According to Löfgren (2005), experiments have shown that it is reasonable to assume a linear relationship between number of fibres and fibre bridging stresses as seen in equation (3.2).
(3.2)
where
is the bridging stress applicable for the beam elements
is the experimental bridging stress from the wedge splitting tests is the fibre efficiency factor for beam elements
is the fibre efficiency factor obtained from the wedge splitting tests
This method was used to transform the fibre bridging stresses obtained in the WSTs to beam stresses.
3.1.3
Conventional reinforcement
The reinforcement used in the beams consisted of 6mm and 8mm diameter bars. The measured yield stress and ultimate stress capacities are shown in Table 3.5.
Table 3.5 Yield and ultimate stress capacities from tests on reinforcing bars done by Gustafsson and Karlsson (2006)
Reinforcement Bars Yield Stress Capacity, fsy
[MPa]
Ultimate Stress Capacity, fsu
[MPa]
6 mm 660 784
8 mm 590 746
3.1.4
Results
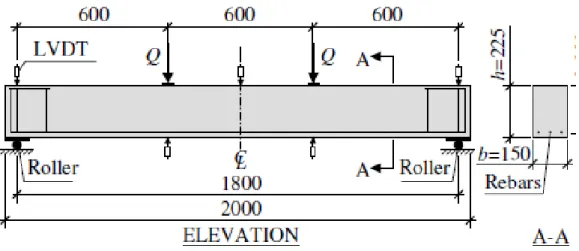
Four point bending tests were performed on series of simply supported beams with loading conditions and dimensions as shown in Figure 3.1. The tests were performed using load control.
Figure 3.1 Dimensions and loading conditions for the beam tests, from Jansson (2008)
From the test results, values of loads, deflections at mid-span, support settlements and crack widths were obtained. More details in Gustafsson and Karlsson (2006). The results from the three beams in each series were presented as average moment-curvature curves and are shown in the Figure 3.2 and Figure 3.3.
Figure 3.2 Moment versus curvature diagrams from the beam tests with reinforcement bar ø8 mm
0 5 10 15 20 25
0 0.05 0.1
M
om
en
t
[kNm
]
Curvature [1/m]
8mm Reinforcement bars
Exp (Vf 0%) Exp (Vf 0.5%)
Figure 3.3 Moment versus curvature diagrams from the beam tests with reinforcement bar ø6 mm
Table 3.6 Ultimate moment capacities from experiments, for beam series with 8 mm reinforcement bars
Series Vf (%) Reinforcement Moment Capacity
(kNm)
Increase of capacity due to addition of fibres
(%)
1 0 3ø8 16.8 -
2 0.5 3ø8 18.9 12.5
Table 3.7 Ultimate moment capacities from experiments, for beam series with 6 mm reinforcement bars
Series Vf (%) Reinforcement Moment Capacity
(kNm)
Increase of capacity due to
varying fibre volume (%)
4 0.25 3ø6 11.3 -
3 0.50 3ø6 12.3 8.8
5 0.75 3ø6 12.8 13.3
0 5 10 15 20 25
0 0.05 0.1
M
om
en
t
[kNm
]
Curvature [1/m]
6mm Reinforcement bars
Exp (Vf 0.25%) Exp (Vf 0.5%) Exp (Vf 0.75%)
3.2
Design according to FIB model code
FIB (fédération Internationale du béton) is an international federation for structural concrete which was formed when the Euro-International concrete committee (CEB) and the International federation for pre-stressing (FIP) were joined together, see FIB bulletin 1, volume 1.
According to FIB model code, bulletin 56, volume 2, the following assumptions, when determining the ultimate limit moment resistance of reinforced or prestressed concrete sections are made;
Plane sections remain plane
The strain in bonded reinforcement or bonded prestressing tendons, whether in tension or in compression, is the same as that in the surrounding concrete The tensile strength of the concrete is ignored
The stresses in the concrete are derived from stress-strain relations for the design of cross-sections.
The stresses in the reinforcing and prestressing steel are derived from design curves given in subclause 7.2.3.2 and 7.2.3.3 in the FIB model code.
The initial strain in the prestressing tendons is taken into account when assessing the stresses in the tendons.
When designing fibre reinforced concrete sections, all points above are valid except point three, where the concrete tensile strength is ignored.
Equation (3.3) to equation (3.6), taken from FIB model code, were used to derive the concrete tensile stresses, , and modulus of elasticity, , with all the stresses in MPa
(3.3)
(3.4)
With being the cylindrical compressive fibre reinforced concrete strength.
(3.5)
(3.6)
It should however, be noted that equation (3.5) is incomplete, as the mean concrete modulus of elasticity, , cannot be smaller than the mean compressive strength. So equation (3.7), given by RILEM TC-162-TDF (2003), was used.
(3.7)
3.2.1
Residual flexural tensile strength
According to FIB model code, the strength of fibres is measured as a residual flexural tensile strength, . This can be done by performing crack mouth opening displacement (CMOD) tests. A CMOD test is a deformation controlled loading test, where the crack opening is measured as a horizontal deflection. The test setup
applied load and the crack opening, which is referred to as CMOD. The FIB model code proposes that it is to be done in accordance with EN 14651 (2005). The CMOD, for the experimental data used in this report, was however from the wedge splitting tests which are basically the same tests but performed on small cubes, for more details see Gustafsson and Karlsson (2006), see also Jansson (2008).
(MPa) (3.8)
where
is the residual flexural tensile strength corresponding to CMODj, with
[j=1,2,3,4]
is the load corresponding to
is the crack mouth opening displacement is the span of the specimen
is the width of the specimen
is the distance between the notch tip and the top of the specimen
The values and are obtained from the corresponding - and -
values as shown in Figure 3.4.
Figure 3.4 An example of typical results from a bending test with a softening material behaviour. From FIB model code, bulletin 55, vol. 1
The FIB model code simplifies the real response in tension, as shown in Figure (3.4), into two stress-crack opening constitutive laws, a linear post crack softening or hardening behaviour, see Figure (3.5), and a plastic rigid behaviour, see Figure (3.6).
Figure 3.5 Simplified post-crack constitutive laws; linear post cracking stress-crack opening. From FIB model code, bulletin 55, vol. 1
Figure 3.6 Simplified post-crack constitutive laws; plastic-rigid behaviour. From FIB model code, bulletin 55, vol. 1
Two reference values are introduced, representing the serviceability residual strength and representing the ultimate residual strength. See equation (3.9) and equation (3.10). No partial safety factors were used, due to comparison with experiments.
(3.9)
where
is the serviceability residual strength
is the residual flexural tensile strength corresponding to
(3.10)
is the ultimate crack opening accepted in structural design, see equation (3.11)
is the residual flexural tensile strength corresponding to is the crack mouth opening displacement and is equal to 0.5mm
is the crack mouth opening displacement and is equal to 2.5mm
Equation (3.10) gives the values of where, . Using a linear
constitutive law between corresponding to serviceability limit state and
corresponding to the crack opening of 2.5mm, any value up to can be obtained, see Figure (3.7). The crack width, , is the maximum crack opening accepted in structural design, where it’s value depends on the required ductility, and therefore should not exceed 2.5mm, according to the FIB model code. is calculated as equation (3.11).
(3.11)
where
is assumed to be equal to 2% for variable strain distribution in cross
section and 1% for only tensile strain distribution along the cross section
is the structural characteristic length, calculated in equation (3.12).
(3.12)
where
is the mean crack spacing
is the distance between the neutral axis and the tensile side of the cross section
Figure 3.7 Simplified linear post-cracking constitutive law. From FIB model code, bulletin 55, vol.1
The requirements in equation (3.13) and equation (3.14) need to be fulfilled, according to FIB model code, if fibre reinforcement is to partially or entirely substitute the ordinary reinforcement in ultimate limit state.
(3.13)
(3.14)
where
is the limit of proportionality
is the flexural tensile strength corresponding to is the flexural tensile strength corresponding to
3.2.2
Moment resistance
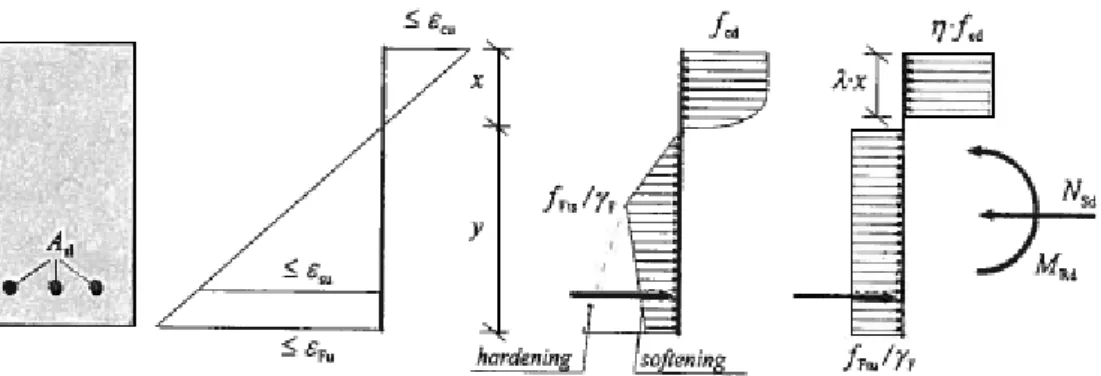
The residual flexural tensile strength of the fibres is added as a stress block as seen in Figure 3.8. For bending moment and axial force in the ultimate limit state, a simplified stress/strain relationship is given by the FIB model code. The simplified stress distributions can be seen in Figure 3.8 where the linear post cracking stress distribution is to the left and the rigid plastic stress distribution is to the right, with η = 1 and λ = 0.8 for concrete with compressive strength below or equal to 50MPa. However, it should be noticed that the safety factor, , has been removed for the reason that, the moment resistance is compared with experimental results. The linear stress distribution to the left was used for design in this report, see Appendix D for application.
Figure 3.8 Simplified stress/strain relationship including the residual flexural tensile strength of fibres, from FIB model code, bulletin 56
Moments at cracking, yielding and ultimate stage were calculated for all beam series using the FIB model code. The flexural cracking moment for all the series was calculated as:
(3.15)
where
is the mean tensile strength of the concrete mix
is the sectional modulus calculated as equation (3.16)
(3.16) With being the width of the cross section, and the height of the cross section The moments at yielding and ultimate stage were calculated using the simplified stress-strain relationship, in accordance with FIB model code, see Figure 3.8.
The yield moment was calculated using the linear post cracking constitutive law, see stress distribution to the left in Figure 3.8. The total contribution of fibres to the moment resistance was referred to as and used in calculations, see Appendix D for details.
(3.17)
where
is the yield strength of the ordinary reinforcement
is the distance from the top of the beam to the center of the concrete compressive zone
is the area of the ordinary reinforcement bars is the effective depth
is the total stress of the tensile stress block from the fibre contribution
is the height of the beam
is the distance from top of the beam to the neutral axis
is the centre of gravity for the tensile zone of fibre stress, given as a
percentage of the total height
is the height of the tensile stress block
The ultimate moment resistance was also calculated using the simplified linear post-cracking stress distribution in Figure 3.8.
(3.18)
For the definition of the variables, see equation (3.17).
The corresponding curvatures were calculated according to equation (3.19) to equation (3.23).
(3.19)
where,
is the curvature at cracking
is the elastic strain in the concrete calculated as equation (3.20)
(3.20)
where
is the curvature at yielding
is the strain in the concrete when the ordinary reinforcement reaches
yielding and calculated as equation (3.22)
(3.22)
where
is the yield strain of the ordinary reinforcement
(3.23) with,
is the ultimate curvature
is the ultimate strain in the concrete equal to 3.5x10⁻³
The moment-curvature relationships for the different beam series obtained when designed using the FIB model code are given in Figure 3.9 for beams with 8mm ordinary reinforcement bars and in Figure 3.10 for beams with 6mm ordinary reinforcement bars. In both Figure 3.9 and Figure 3.10, it can be seen that the moment resistance slightly increases with increased fibre volume; it is however, evident from these figures that, the moment resistance does not significantly increase with the addition of fibres.
Figure 3.9 Moment versus curvature diagrams for beams with reinforcement bar ø8 mm, designed according to FIB model code
0 5 10 15 20 25
0 0.05 0.1
M
om
en
t
[kNm
]
Curvature [1/m]
8mm Reinforcement bars
FIB (Vf 0%) FIB (Vf 0.5%)
Figure 3.10 Moment versus curvature diagrams for beams with reinforcement bar ø6 mm, designed according to FIB model code
In Table 3.8, it can be seen that addition of 0.5% fibre volume in a beam reinforced with 8mm diameter ordinary reinforcement bars increases the moment capacity by 0.6%.
Table 3.8 Moment capacities for beam series with 8 mm reinforcement bars, designed according to FIB model code.
Series Vf
(%)
Reinforcement Moment Capacity (kNm)
Increase of capacity due to addition of fibres (%)
1 0 3ø8 16.9 -
2 0.5 3ø8 17.0 0.6
Decreasing the diameter of ordinary reinforcement bars from 8mm to 6mm significantly reduces the moment resistance. This reduction can however be complemented by addition of sufficient amount of fibres. Table 3.9 shows how the moment capacity increases with variation of fibre volume from 0.25% to 0.75%. Here it is clear that much more fibre fractions are needed in order to compensate for this reduction.
For beams reinforced with 6mm diameter reinforcement bars, no reference beam without fibres was tested, but it can still be noted that increase in fibre volume increases the moment capacity.
0 5 10 15 20 25
0 0.05 0.1
M
om
ent
[kNm
]
Curvature [1/m]
6mm Reinforcement bars
FIB series 4 (Vf 0.25%) FIB series 3 (Vf 0.5%) FIB series 5 (Vf 0.75%)
Table 3.9 Moment capacities for beam series with 6 mm reinforcement bars, designed according to FIB model code.
Series Vf (%) Reinforcement Moment Capacity
(kNm)
Increase of capacity due to
varying fibre volume (%)
4 0.25 3ø6 11.0 -
3 0.50 3ø6 11.1 0.9
5 0.75 3ø6 11.2 1.8
When designing fibre reinforced concrete beams without the presence of ordinary reinforcement, the FIB model code proposes that the same stress strain relationship in section 3.2.2 applies, excluding the contribution of the steel reinforcement. The equation for moment resistance for beams without ordinary reinforcement can be seen in equation (3.24).
(3.24)
For definitions of variables, see equation (3.17).
The results of the ultimate moment capacities from design of beams without ordinary reinforcement, designed using the FIB model code, are presented in Table 3.10. The results revealed that the moment capacity increased with increasing fibre volumes, the results however showed very low moment capacities for the chosen fibre fractions.
Table 3.10 Ultimate moment resistances for beams without ordinary reinforcement bars designed according to FIB model code
Series Fibre Volume (%) Multimate (kNm) Percentage increase
(%)
4 0.25 0.29 -
3 0.5 0.43 48
5 0.75 0.60 107
When designing in ultimate limit state, ductility requirements need to be fulfilled. FIB takes this into account by implying that ductility requirements are fulfilled when the need for minimum ordinary reinforcement amount is satisfied. The minimum reinforcement is calculated as equation (3.25).
(3.25)
where
is the mean concrete tensile strength
is the residual tensile strength of fibre reinforced concrete is the tensile part of the concrete cross section
is the maximum tensile reinforcement at cracking stage
is the coefficient taking into account the stress distribution in the cross section just before cracking and the change of inner lever arm
is the coefficient taking into account non-uniform self-equilibrating stresses leading to reduction of cracking force
Table 3.11 illustrates that the ductility requirements were fulfilled as the steel reinforcement, As, was larger than the minimum required reinforcement, As,min.
Table 3.11 Results of the ductility requirements for beam series with 8 mm reinforcement bars, designed according to FIB model code
Series Reinforcement Fibre Volume (%)
As (mm2) As,min (mm2) Ductility
2 3ø8 0.5 150.8 134.9 Fulfilled
For the beams with a smaller amount of reinforcement, the ductility requirements were not fulfilled for the used fibre content, see Table 3.12. Thus, less ordinary reinforcement can be compensated by adding more fibres. Table 3.12 illustrates that more than 0.75% fibre content is needed in order to fulfil the ductility requirements.
Table 3.12 Results of the ductility requirements for beam series with 6 mm reinforcement bars, designed according to FIB model code
Series Reinforcement Fibre Volume (%)
As (mm2) As,min (mm2) Ductility
4 3ø6 0.25 84.8 131.0 Not Fulfilled
3 3ø6 0.5 84.8 123.7 Not Fulfilled
5 3ø6 0.75 84.8 117.4 Not Fulfilled
According to FIB model code, ductility requirements can be satisfied in fibre reinforced concrete structures without minimum ordinary reinforcement if one of the conditions in equations (3.26) and (3.27) are fulfilled.
(3.26)
(3.27)
where
is the ultimate displacement
is the displacement at the maximum load
is the displacement at service load computed by performing a linear
elastic analysis with the assumptions of uncracked condition and initial elastic Young’s modulus.
The values in equation (3.26) and equation (3.27) are obtained from experiments. The ductility requirements were fulfilled for all the series, see Appendix D for details, but for beams without ordinary reinforcement, no experimental data on load-deformation conditions is available
The ductility requirements in equation (3.26) and equation (3.27) are valid for design of fibre reinforced concrete without ordinary reinforcement if ultimate load is higher than the cracking load.
3.2.3
Shear capacity
The shear capacity was also calculated for all the beam series, using the FIB model code. The total shear resistance is the sum of contributions from concrete as well as the shear reinforcement. However, in the present case, there was no shear reinforcement, thus the resistance was provided only by concrete.
(3.28)
where
since there was no shear reinforcement
The shear resistance for the beam without fibres was calculated by using equation (3.29), in which,
(3.29)
where
is a partial safety factor for concrete, but was removed in this design due to the comparison with experiments
is the internal lever arm
is the equivalent cylinder strength
is the factor that takes into account the size factor
The shear resistance for the beam series with varying fibre contents reinforced with ordinary reinforcement bars and without shear reinforcement was calculated using the formula in equation (3.30), given by the FIB model code. The shear resistance was calculated by using the mean value of the tensile strength of concrete mix.
(3.30)
where
is the fibres ultimate residual tensile strength
is the equivalent cylinder compressive strength for the corresponding
series
is the mean concrete tensile strength
is the average stress acting on the concrete due to loading or prestressing
is the width of the cross-section
is the effective depth of the cross-section
is the partial safety factor for concrete without fibres which was not used in design due to comparison with experimental results
is the reinforcement ratio for ordinary reinforcement is a factor that takes size effect into account
The code also defines a minimum value for the shear resistance, which is given by equation (3.31):
(3.31)
where
(3.32)
For definitions of variables, see equation (3.30)
The shear resistance is the maximum of the values , as given in equation (3.33):
(3.33)
The results for the shear resistance of different beam series are given in the Table 3.13 and Table 3.14. From the results, it can be inferred that fibre volume does have an influence on the shear capacity of beams as it increases with increasing fibre volume.
Table 3.13 Shear resistance results for beam series with 8mm reinforcement bars, designed according to FIB model code.
Series Vf (%) Reinforcement Shear resistance
(kN)
Increase of capacity due to addition of
fibres (%)
1 0 3ø8 24.8 -
Table 3.14 Shear resistance results for beam series with 6mm reinforcement bars, designed according to FIB model code.
Series Vf (%) Reinforcement Shear resistance
(kN)
Increase of capacity due to varying fibre
volume (%)
4 0.25 3ø6 24.4 -
3 0.50 3ø6 25.0 2.5
5 0.75 3ø6 25.9 6.1
Figure 3.11 Shear resistance compared to experimental results for all beam series
It is not possible to evaluate shear resistance accuracy for the reason that the beams tested failed in bending and not in shear. Figure 3.11 shows that, the shear capacity for beam series 1 and 2, with 8mm ordinary reinforcement bars, is lower than the experimental shear load, and since shear was not the failure mode, the capacity is underestimated.
Regarding design of shear resistance in beams without ordinary- and shear reinforcement, the FIB model code suggests that the principal tensile stress, σ1, shall
not exceed the design value of the tensile strength given in equation (3.34). This is however, only valid for fibre reinforced concrete with tensile hardening behaviour. The beams designed in this report have a tensile softening behaviour and there is therefore no method for the designing of shear resistance in FRC with softening behaviour.
0 5 10 15 20 25 30 35
1 2 4 3 5
S
h
ear
Re
sis
tance
[kN]
Series
Shear resistance
FIB
(3.34)
where
is the characteristic value of the ultimate residual tensile strength
is the partial safety factor for fibres
3.2.4
Crack width
Cracking occurs in concrete structures. This is however, not a problem in the serviceability limit state for the structural system itself other than the fact that it gives an unattractive appearance. Still, there is a need for controlling the crack widths in order to meet the requirements in the serviceability limit state. This can be done with the presence of:
conventional reinforcement bars
normal compressive forces e.g. compressive axial loading and/or pre-stressing FIB model code suggests that for all stages of cracking, in members with ordinary reinforcement, the crack width, , is calculated according to equation (3.35).
(3.35)
where
is the average steel strain over is the average concrete strain over is the concrete strain due to shrinkage
is the length over which slip between concrete and steel occurs, see
equation (3.36)
(3.36)
Adding equation (3.35) with equation (3.36), equation (3.37) is obtained.
(3.37)
where
is the mean concrete tensile strength
is the modulus of elasticity of steel is the actual steel stress
is a factor which takes long term effects into account. For short term effects, this factor is equal to 0.
is the mean bond strength between reinforcement bars and concrete
is the empirical coefficient for assessing mean strain over . , is the length over which slip between concrete and steel occurs
is the maximum steel stress in the crack at crack formation stage, see
equation (3.38)
(3.38)
where
is the steel reinforcement ratio is the modular ratio
is the effective steel reinforcement ratio, see equation (3.39)
(3.39)
where
is the steel reinforcement area
is the effective area of concrete
The steel stress was calculated by carrying out state II analysis of the beam in cracked state. The crack width design formula in equation (3.40) has however, a small error which pertains to dividing the whole formula with the steel modulus of elasticity. Equation (3.35), for crack width calculations, contains strains while equation (3.40) contains stresses. This is missing in the crack width equation given by the FIB model code, bulletin 56, vol.2.
(3.40)
For definition of variables, see equation (3.37)
When considering design crack width, the effect of steel fibres in fibre reinforced concrete is similar to that of ordinary reinforced concrete. The steel fibre tensile strength, , which is not equal to zero, is taken as constant all over the cracked section. The design crack widths for fibre reinforced concrete beams with ordinary reinforcement were calculated, according to FIB model code, using equation (3.41) and here it is clear that the stresses are divided with the steel modulus of elasticity, .
(3.41)
where
,is the serviceability residual strength for the corresponding series.
All other variables are defined in equation (3.35).
Stabilized cracking is reached when the moment is between cracking and yield moment. To make a fair comparison between the crack widths, a moment of 15kNm is used for series 1 and 2 and a moment of 10 kNm is used for series 3, 4 and 5. The results for crack widths calculated using this assumption, for different beam series are given in Table 3.15 and Table 3.16.
Table 3.15 Crack width results for beam series with 8mm reinforcement bars, designed according to FIB model code, calculated at a moment resistance of 15kNm.
Series Vf (%) Reinforcement Crack width (mm) Change due to
addition of fibres (%)
1 0 3ø8 0.244 -
2 0.5 3ø8 0.264 8.2
Table 3.16 Crack width results for beam series with 6mm reinforcement bars, designed according to FIB model code, calculated at a moment resistance of 15kNm.
Series Vf (%) Reinforcement Crack width (mm) Change due to
change of fibre volume (%)
4 0.25 3ø6 0.327 -
3 0.5 3ø6 0.322 -1.5
5 0.75 3ø6 0.314 -3.9
From the results in Table 3.15, it can be seen that an addition of 0.5% fibres did not result into a reduction, but to an increase of the crack width. The reason for this unexpected outcome, is due to the fact that the concrete tensile strength, , was derived from the concrete compressive strength which was 47 MPa for series 1 and 37.6 MPa for series 2. It is therefore difficult to make a fair comparison. It can however be noted, in Table 3.16, that under comparable circumstances, fibres do have a positive impact on crack control as an increase of fibre volume decreases the crack width.
The FIB model code does not give any suggestions for the calculation of crack width for fibre reinforced concrete beams without ordinary reinforcement.
3.2.5
Comparison with experimental results
The moment resistance results were compared with the experimental results, for all the beam series, in order to identify the accuracy of the FIB model code.
Figure 3.12 and Figure 3.13 illustrate the comparison of the design results with experimental results and in all cases with fibres, it was noted that there was an underestimation of the moment resistance when designing according to FIB model code.
(a) (b)
Figure 3.12 Comparison of moment-curvature diagrams, according to FIB model code and the experimental results for (a) beams with Vf = 0 % and
rebar ø8 mm, (b) beams with Vf = 0.5 % and rebar ø8 mm
(a) (b)
(c)
Figure 3.13 Comparison of moment-curvature diagrams, according to FIB model code and the experimental results for (a) beam with Vf = 0.5 % and
rebar ø6 mm, (b) beam with Vf = 0.25 % and rebar ø6 mm, (c) beam
with Vf = 0.75 % and rebar ø6 mm
0 5 10 15 20
0 0.05 0.1
M o m ent [ k Nm ] Curvature [1/m] Series 1 FIB Exp 0 5 10 15 20
0 0.05 0.1
M o m ent [ k Nm ] Curvature [1/m] Series 2 FIB Exp 0 5 10 15 20
0 0.05 0.1
M o m ent [ k Nm ] Curvature [1/m] Series 3 FIB Exp 0 5 10 15 20
0 0.05 0.1
M o m ent [ k Nm ] Curvature [1/m] Series 4 FIB Exp 0 5 10 15 20
0 0.05 0.1
M o m ent [ k Nm ] Curvature [1/m] Series 5 FIB Exp
The percentage over/under-estimation of the moment capacities for beams with 8 mm diameter ordinary reinforcement bars can be seen in Tables 3.17 and for beams with 6 mm diameter bars in Table 3.18. The maximum underestimation goes up to 12.5%.
Table 3.17 Comparison of moment capacity for beams with 8mm reinforcement bars
Multimate
Series 1 2
Vf (%) and
reinforcement
0 3Ø8mm
0.5 3Ø8mm
FIB 16.9 17.0
Experimental 16.8 18.9
Difference (%) 0.6 -9.0
Table 3.18 Comparison of moment capacity for beams with 6mm reinforcement bars
Multimate
Series 4 3 5
Vf (%) and
reinforcement
0.25 3Ø6mm
0.5 3Ø6mm
0.75 3Ø6mm
FIB 11.0 11.1 11.2
Experimental 11.3 12.3 12.8
Difference (%) -2.6 -9.7 -12.5
3.2.6
Conclusions
The moment resistance obtained, when designing using the FIB model code, confirmed the experimental results that the moment resistance increases with increased amount of fibres. There were however, slight underestimations of the ultimate bending moment capacities for all beams with fibres, designed according to FIB model code. This underestimation might be due to the variation in material properties for the different samples as, three experimental results from the same concrete mix varied significantly, where the mean value was used for comparison. See Appendix C.
The shear resistance calculations using the FIB model code revealed that the shear resistance increases with addition and increasing amount of fibres. It is however, difficult to determine the accuracy of the code since the comparison with the experimental shear loads revealed a slight underestimation for the beam series with 8 mm ordinary reinforcement bars, as the beam experiments failed in flexure and not shear. The beam series with 6 mm reinforcement bars proved to be more accurate due to the fact that the shear resistance was higher than the experimental shear load. Crack width calculations were carried out to see the effect of fibres and the results showed that addition of fibres decreases the crack width. The results also revealed that if there is a need for reduction of ordinary reinforcement, addition of a considerable amount of fibres could compensate this reduction.
3.3
Design of beams using RILEM
Rilem is an international committee of experts which aims at advancing the scientific knowledge in structures, systems and construction materials. Among their aims, Rilem is to assess scientific research data and publish their recommendations as guidelines.
In this section, all the beams series, designed according to RILEM TC-162-TDF (2003), are evaluated. The section also includes comparison with experimental results in section 3.1.4.
3.3.1
Flexural tensile strength
The flexural tensile strength is derived from the compressive strength obtained from the test results mentioned in section 3.1.1. RILEM TC-162-TDF (2003) recommends the following formulas for mean and characteristic flexural tensile strength of steel fibre reinforced concrete:
With compression strength known:
(3.42)
where
is the mean tensile strength of the concrete is the concrete cylindrical compressive strength
(3.43)
with being the characteristic value of the tensile strength
With flexural tensile strength known:
(3.44)
with being the flexural tensile strength
with being the mean flexural tensile strength.
Since the experimental data, considered in this report, was obtained from tests on compression cubes, the compressive strength is known and therefore, equation (3.42) and equation (3.43) are used.
3.3.2
Residual flexural tensile strength
RILEM TC-162-TDF (2003) also refers to crack mouth opening displacement (CMOD) for determining the residual tensile strength in equation (3.46), where the residual tensile strengths, and are determined following and respectively, for values see Figure 3.14.
(3.46)
where
is the residual flexural tensile strength corresponding to with
[i=1,2,3,4]
is the load corresponding to
is the crack mouth opening displacement is the span of the specimen
is the width of the specimen
is the distance between the notch tip and the top of the specimen
Figure 3.14 Load–CMOD diagram used to obtain the residual flexural tensile strength, from RILEM TC-162-TDF (2003)
In order to design in ultimate limit state, regarding bending and axial force, RILEM TC-162-TDF (2003) makes the following assumptions:
The stresses in the steel fibre reinforced concrete in tension as well as in concrete are derived from the stress strain diagram shown in Figure 3.15 The stresses in the reinforcement bars are derived from an idealized bi-linear
stress strain diagram
For cross sections subjected to pure axial compression, the compressive strain in the steel fibre reinforced concrete is limited to -2x10⁻³. For cross sections not fully in compression, the limiting compressive strain is taken as -3.5x10⁻³. In intermediate situations, the strain diagram is defined by assuming that the strain is -2x10⁻³ at a level of of the height of the compressed zone, measured from the most compressed face.
For steel fibre reinforced concrete which is additionally reinforced with bars, the strain is limited to 25x10-3 at the position of the reinforcement, see Figure 3.17
To ensure enough anchorage capacity for the steel fibres, the maximum deformation in the ultimate limit state is restricted to 3.5mm. If crack width larger than 3.5mm are used, the residual flexural tensile strength corresponding to that crack width and measured during the bending test has to be used to calculate
Figure 3.15 Stress strain diagram for fibre contribution, from RILEM TC-162-TDF (2003)
The values in Figure 3.15 are, according to RILEM TC-162-TDF (2003), calculated by the following formulas:
(3.47)
where
is the effective depth in meters
is the mean concrete flexural tensile strength
(3.48)
where
is the size factor
is the residual flexural tensile strength at
where,
is the residual flexural tensile strength at
(3.50)
where
is the concrete modulus of elasticity
is the mean concrete compressive strength
(3.51)
0 (3.52)
0
, Figure 3.16 (3.53) with being the height of the beam in cm
Figure 3.16 Range of the size factor, , from RILEM TC-162-TDF (2003)
The size factor, , in equation (3.53) and Figure 3.16 is used in RILEM TC-162-TDF (2003) to compensate the overestimation in the load carrying capacity which was detected when the design results were compared to experimental tests. According to RILEM TC-162-TDF (2003), the origin of the need for this size factor requires further studies. The design guideline points out that it might be due to variation of the material properties in different samples. It could also be built in the method used or both.
Figure 3.17 Stress strain distribution, from RILEM TC-162-TDF (2003)
3.3.3
Moment resistance
Moments at cracking, yielding and ultimate stage were as well calculated for all beam series using RILEM TC-162-TDF (2003), see Appendix E for application. Here, the flexural cracking moment, , for all the series was calculated as:
(3.54)
where
is the sectional modulus, see equation (3.55)
(3.55) is the cracking stress
For the beam without fibres, the moment at yielding and at ultimate stage was calculated by carrying out sectional analysis following equation (3.56) and equation (3.57) respectively.
For yield moment,
(3.56)
where
is the yield strength of the ordinary reinforcement
is the distance from the top of the beam to the center of the concrete compressive zone
is the area of the ordinary reinforcement bars is the effective depth
is the distance from top of the beam to the neutral axis For ultimate moment,
(3.57)
For definition of variables see equation (3.56)
25 0 -2,0 -3,5 σ ε [‰]