Sharif University of Technology
Scientia IranicaTransactions D: Computer Science & Engineering and Electrical Engineering http://scientiairanica.sharif.edu
Symbiotic organisms search algorithm for economic
load dispatch problem with valve-point eect
U. Guvenc
a, S. Duman
a;, Y. Sonmez
b, H. Tolga Kahraman
c, and
M. Kenan Dosoglu
aa. Department of Electrical and Electronics Engineering, Technology Faculty, Duzce University, Duzce, Turkey. b. Department of Electrical Technology, Gazi Vocational College, Gazi University, Ankara, Turkey.
c. Department of Software Engineering, Faculty of Technology, Karadeniz Technical University, Trabzon, Turkey. Received 18 August 2015; received in revised form 7 April 2016; accepted 16 January 2017
KEYWORDS Symbiotic organisms search;
Economic load dispatch; Power systems; Optimization.
Abstract.Symbiotic Organisms Search (SOS) is a brand new and eective metaheuristic optimization algorithm. This paper proposes the SOS algorithm to solve the Economic Load Dispatch (ELD) problem with valve-point eect, which is one of the essential optimization problems in modern power systems. The proposed algorithm is tested on ve dierent test cases consisting of 3-machine 6-bus, IEEE 5-machine 14-bus, IEEE 6-machine 30-bus, and 13- and 40-unit test systems both with transmission loss and without transmission loss. These test cases show that SOS is able to converge on the global optima, successfully. Moreover, results obtained from the proposed algorithm are compared through dierent methods used in solving the ELD problem existing in the literature. According to these results, SOS produces the best values among all methods.
© 2018 Sharif University of Technology. All rights reserved.
1. Introduction
Economic Load Dispatch (ELD) is one of the most popular and important optimization problems in mod-ern power system operation and aims to minimize the total cost of function scheduling outputs of all generating units to meet the load demand while satis-fying some equality and inequality system constraints. ELD becomes a highly non-linear optimization problem when the valve-point eects, multi-fuel eects, etc. are considered. Therefore, solving this non-smooth optimization problem and nding the global optimum become very dicult.
*. Corresponding author.
E-mail addresses: [email protected] (U. Guvenc); [email protected] (S. Duman);
[email protected] (Y. Sonmez);
[email protected] (H. Tolga Kahraman); [email protected] (M. Kenan Dosoglu) doi: 10.24200/sci.2017.4378
Researchers have made great eorts to solve the ELD problem from past to the present. Classical meth-ods like linear programming [1], interior point [2,3], and dynamic programming [4] were used in early times. In order to overcome some drawbacks of these algorithms, including insecure convergence properties, long execution time, and algorithmic complexity, many meta-heuristic based optimization algorithms were de-veloped and proposed to solve ELD. Simulated An-nealing (SA) was implemented [5] in ELD problems and produced nearly optimal solutions in the early 1990s. Then, evolutionary based algorithms were used for solving ELD problem. Genetic Algorithm (GA) [6] and its improved versions [7] were also widely used. Tabu Search (TS) [8], Particle Swarm Optimization (PSO) [9,10], Dierential Evolution (DE) [11], Ant Colony Optimization (ACO) [12,13], Bacterial Forag-ing Optimization (BFO) [14], Articial Bee Colony algorithm (ABC) [15], Gravitational Search Algo-rithm (GSA) [16], Biogeography-Based Optimization (BBO) [17], Improved Mutative Scale Chaos
Opti-mization Algorithm (IMSCOA) [18], Pattern Search method (PS) [19], Seeker Optimization Algorithm (SOA) [20], Taguchi Method (TM) [21], Modied Shued Frog Leaping Algorithm (MSFLA) [22], and Firey Algorithm (FA) [23] are other heuristic search algorithms applied to ELD in course of nding the best optimal solution. Besides hybrid algorithms such as Cultural Self-Organizing Migrating Algo-rithm (CSOMA) [24], Chaotic Dierential Evolution and Quadratic Programming (DEC-SQP) [25], Fuzzy Adaptive Particle Swarm Optimization (FAPSO) [26], hybrid Genetic Algorithm approach based on Dier-ential Evolution (GA-DE) [27], hybrid population-based algorithm (PSOGSA) [28], Genetic Algorithm with Active Power Optimization based on Newton's second order approach (GA-APO) [29], combination of Modied Subgradient and Harmony Search (MSG-HS) [30], hybrid Shued Dierential Evolution (SDE) algorithm [31,32], Improved Coordinated Aggregation-based Particle Swarm Optimization (ICA-PSO) [33], integrated Particle Swarm Optimization technique with the Sequential Quadratic Programming (PSO-SQP) technique [34], modied hybrid Particle Swarm Optimization and GSA based on fuzzy logic (FP-SOGSA) [35], Real parameter Quantum Evolutionary Algorithm (RQEA) [36], etc. have been developed by authors to solve ELD problem. Even though all of these algorithms produce good solutions and have some advantages, each method has its own drawbacks. As it is declared in [37], SA suers from slow convergence and its parameter determination is dicult, PSO has a slow ne-tuning ability of solution and it has diculty in escaping from the local optimum, GA's ospring pro-duction capacity is weak and it shows slow convergence near the best optimal solution, and TS is inecient in describing eective memory structures and strategies adequate for the problem.
Symbiotic Organisms Search algorithm (SOS) is a brand new and eective metaheuristic optimization algorithm developed by Cheng and Prayogo [38] in 2014. It is an improved algorithm for nding the best possible solution to optimization problems with multi-variable functions and simulates symbiotic inter-action tactics used by organisms in order to survive in the nature. Because SOS is an algorithm for a newborn, no studies have been applied to dierent areas. However, Cheng and Prayogo examined it on 26 dierent benchmark functions and structural design optimization problems in order to show the eectiveness of the algorithm. Then, they compared its performance with other optimization algorithms such as GA, DE, PSO, Bees Algorithm (BA), Mine Blast Algorithm (MBA), and Cuckoo Search (CS). According to results, it was seen that SOS produced better results than others in all cases. Therefore, SOS algorithm is chosen to search the globally optimum solution and
investigate the produced results for ELD problem with valve-point eect in this paper. ELD solution, which is performed using SOS, is examined over standard power systems including IEEE 3-machine 6-bus, IEEE 5-machine 14-bus, IEEE 6-machine 30-bus, and 13- and 40-unit test systems both with transmission loss and without transmission loss. The results are compared with those reported in the literature; they show that SOS algorithm produces better solutions than other algorithms to the ELD problem.
The rest of the paper is organized as follows: problem formulation is described in Section 2. SOS algorithm and its application to ELD problem are explained in Section 3. Experimental results are given in Section 4 and, nally, Section 5 presents conclusions. 2. Problem formulation
ELD is the most common and most important non-linear optimization problem in power system operation and management. The aim of ELD is to meet the load demand while satisfying some equality and inequality system constraints by scheduling the generator out-puts. Outputs of generators having multi-valve steam turbines should be increased by opening the valves when an increase occurs in load demand. But, this process creates ripples on heat rate curve of generat-ing units and sinusoidal components on their power outputs. Thus, nonlinear feature of ELD problem increases. Hence, reaching the solution to this problem becomes dicult due to increase in local optimum points in the search space [35]. When the valve-point eect is taken into account, the ELD problem can be described as follows:
min f = minXN
k=1
Fk(Pk); (1)
Fk(Pk) =ak+ bkPk+ ckPk2
+dk sin ek Pkmin Pk; (2)
where Fk(Pk) is total generation cost of unit k; ak,
bk, and ck are cost coecients; dk and ek are cost
coecients with valve-point eect of unit k; and Pk
is the power output of unit k. The ELD problem described in Eq. (2) is subject to constraints, which are power balance and ramp rate limits. According to the power system constraints, the power generation of total system is equal to the sum of total system load (Pd) and total power loss (Pls). It can be described as
follows:
N
X
k=1
Pk= Pd+ Pls; (3)
where Pls can be calculated by using B-coecients as
Pls = N X k=1 N X l=1
PkBklPl+ N
X
k=1
B0kPk+ B00; (4)
where Bkl is the k; l-th elements of loss coecient
square matrix, B0k is the k-th vector of matrix, and
B00 is the constant of loss coecient.
The second constraint is ramp rate limits. Ac-cording to this, the power output of each generating unit is limited with a minimum value and a maximum one.
Pmin
k Pk Pkmax: (5)
2.1. Computing for slack generator
According to this calculation method, active power load of rst (N 1) generating units is dened when N units generate power subject to the power balance equality given in Eq. (1). In this instance, the power output of Nth unit (i.e., slack generator) can be described as follows [17,35]:
PN = Pd+ Pls
(N 1)X k=1
Pk; (6)
where Plsis a function of all outputs of generating units
comprising the slack generator and it can be described as follows:
Pls = N 1X
k=1 N 1X
l=1
PkBklPl+ 2PN N 1X
k=1
BNkPk
!
+ BNNPN2 + N 1X
k=1
B0kPk+ B0NPN + B00: (7)
Eq. (6) becomes Eq. (8) by expanding and rearranging as follows:
BNNPN2 + 2 N 1X
i=1
BNiPGi+ B0N 1
! PN
+
PD+ N 1X
i=1 N 1X
j=1
PGiBijPGj
+N 1X
i=1
B0iPGi N 1X
i=1
PGi+ B00
= 0: (8) Eq. (8) can be calculated via standard algebraic meth-ods and, thus, the loading of the dependent generation unit (i.e., Nth) can be found. In order to achieve this, the following simplications can be used:
P2
N + PN + = 0; (9)
= BNN;
= 2
N 1X k=1
BNkPk+ B0N 1
! ;
=
Pd+ N 1X
k=1 N 1X
l=1
PkBklPl+ N 1X
k=1
B0kPk N 1X
k=1
Pk+ B00
: (10)
The positive roots of the equation give output of the slack generator to satisfy Eq. (6) and it can be found as follows:
PN =
p
2 ; (11)
where = 2 4 0.
3. Symbiotic Organisms Search (SOS) algorithm and application to the ELD problem
The SOS algorithm is a population-based stochastic technique developed by Cheng and Prayogo [38] in 2014. It iteratively uses a population of candidate solutions to the optimization of nonlinear functions at multi-dimensional space in the process of seeking the optimal global solution.
SOS consists in a group of organisms in ecosys-tem. It simulates the interactive behavior seen among organisms in ecosystem. There is a reliance-based relationship between the organisms, which is known as symbiosis. Symbiosis includes relationships that are mutualistic, parasitic, or commensal and is used to describe a relationship between any two distinct organisms. The symbiotic relationships are performed by applying special operators, namely, mutualism, commensalism, and parasitism. Mutualism represents a symbiotic relationship between two dierent species in which each individual benets from the activity of the other. Commensalism is a symbiotic relationship between two dierent species in which one organism benets from the other without aecting it. Parasitism is a non-mutual symbiotic relationship between two dierent species in which one species, the parasite, ben-ets at the expense of the other, the host. Organisms use symbiotic relationships to adapt to changes in their environment. Thanks to the special operators, tness and survival advantage of organisms may increase.
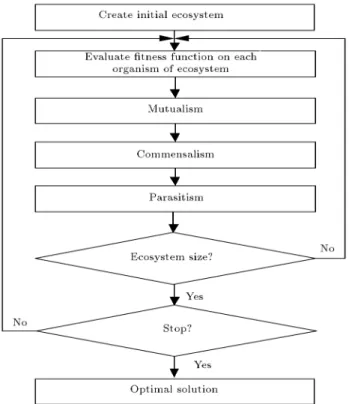
In the SOS algorithm, an initial population, called the ecosystem, is rstly created. The ecosystem consists in a group of organisms generated randomly in the search space. Every organism in the ecosystem is a potential solution to the problem and has a certain tness value, which points out the degree of adaptation to the desired objective. General owchart of the SOS algorithm is given in Figure 1.
Now, application of SOS algorithm to ELD prob-lem is described below step by step according to the owchart of the algorithm.
Figure 1. General owchart of SOS execution.
Step 1. Create initial ecosystem: The ecosystem is created in three steps. In the rst step, organisms are created. For every organism, a vector (random values for attributes) is generated in the second step. In the last step, ecosystem parameters, number of organisms (eco size), and maximum iteration (max iter) are determined. Figure 2 shows the ecosystem and organisms.
Step 2. Evaluate tness function of each organism in ecosystem: Depending on values of attributes ([a1; a2; a3; :::; am] is given in Figure 2), the tness
value ([fvalue]) of each organism is determined by a
tness function. The information on tness value of an organism is used to search for the ttest organism.
Step 3. Determine mutualism operator:
a. An organism is selected randomly from ecosystem, Xj, where Xj 6= Xi., through the following codes;
/* j = i; while i == j
seed = randperm(ecosize); j = seed(1);
end =
b. Mutual relationship vector (Mutual Vector) and benet factors (the value of 1 or 2 is assigned randomly to both BF1and BF2) are determined.
c. Mutual V ector = (Xi+ Xj)=2.
d. Organisms Xiand Xj are modied based on their
mutual relationship by using Eqs. (12) and (13): Xinew=Xi+ rand(0; 1)
(Xbest MutualV ector BF1); (12)
Xjnew =Xj+ rand(0; 1)
(Xbest MutualV ector BF2): (13)
e. Fitness values of Xinewand Xjneware calculated.
If the modied organisms are tter than the pre-vious ones, then the modications are accepted. Otherwise, the modications are rejected and the previous organisms kept.
Step 4. Determine commensalism operator:
a. An organism is selected randomly from ecosystem, Xj, where Xj6= Xi.
b. Organism Xj is used to modify organism Xi by
using Eq. (14):
Xinew= Xi+ rand( 1; 1) (Xbest Xj): (14)
c. Fitness value of Xinew is calculated. If the
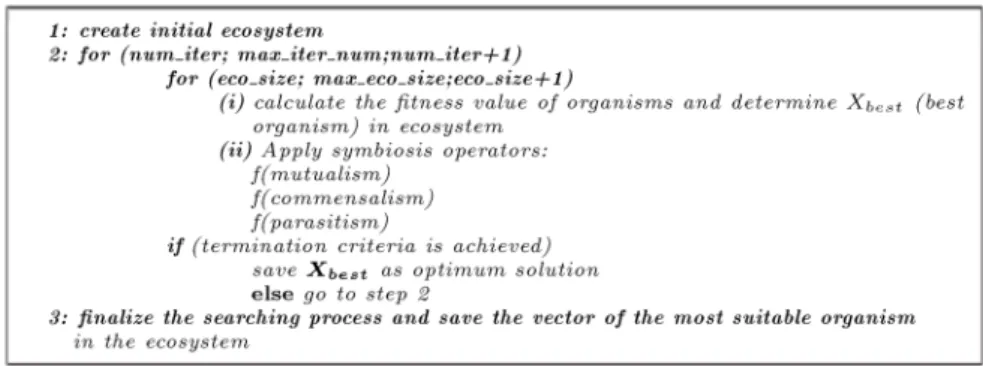
Figure 3. The pseudocode of SOS algorithm to search the optimum solution.
modied organism is tter than the previous one, then the new organism is accepted to replace Xi.
Otherwise, the modication is rejected and the previous organism kept (Xi).
Step 5. Determine parasitism operator:
a. An organism is selected randomly from ecosystem, Xj, where Xj 6= Xi.
b. A parasite vector (Parasite Vector) is created from organism Xi.
c. Fitness value of Xi is calculated. If the tness
value of Parasite Vector is tter than Xj, then
organism Xj is replaced with Parasite Vector.
Otherwise, replacement operation is performed, Xj kept, and Parasite Vector deleted.
Step 6. Determine ecosystem size: It is the number of organisms in ecosystem. Each organism is a potential solution to the problem at hand. The population size in genetic algorithm and the number of bees in a colony in articial bee colony algorithm are also known.
Step 7. Stop: Termination criteria are determined to stop the optimization process. If one of the termination criteria is reached, then the Xbestis saved
as optimum solution; otherwise, we return to Step 2 and start the next iteration.
The pseudocode developed for SOS algorithm is given in Figure 3.
3.1. Implementation of SOS algorithm for ELD problem
This section introduces the step-wise procedure for implementing SOS algorithm to solve non-convex ELD problem with valve-point eects while satisfying both equality and inequality constraints. The process and computational producer of the SOS algorithm are laid out as follows:
Representation of the ecosystem: The aim in ELD problems is to determine the most suitable generator output power. Because generator output values form this in optimization variables, they are used to represent molecules in an organism. Thus, an
organism is represented in the form of the following matrix:
X = [M1; M2; M3; :::; Mn] ; (15)
where M is the molecule and n is the total number of generators. Each organism is a possible solution to the non-convex ELD problem with valve-point eects. Finally, the ecosystem is created by the combination of all organisms. An ecosystem is represented as follows:
E = 2 6 6 6 6 6 4
X1
X2
X3
... Xm
3 7 7 7 7 7
5: (16)
m is the number of organisms.
Problem parameters identication: The number of generator units, maximum and minimum capacities of each generator, power demand, B-coecients matrix for calculation of transmission losses, and fuel cost function coecients are specied. Also, the SOS parameters, like number of organisms and maximum iteration number, are determined. Ecosystem initialization: For initialization, the
initial molecule is dened by generating a uniform random number between lower and upper limits for the related generator power output as follows:
Mi= Pimin+ rand(0; 1) (Pimax Pimin): (17)
The ecosystem is obtained by applying this operation to all molecules making up each organism. Calculation and evaluation of tness function for each organism of ecosystem: FC represents the fuel cost of all generators in the test system for the power demand. Calculated fuel costs for an ecosystem are represented as follows:
F Ceco=
2 6 6 6 6 6 4
F C1
F C2
F C3
... F Cm
3 7 7 7 7 7
5: (18)
Here, F C1 shows the tness value of the rst
organism of ecosystem. The organism with the minimum fuel cost value in the ecosystem is chosen as the best organism (X is signied with best). Mutualism, commensalism, and parasitism phases:
New organisms are obtained through operations as indicated in SOS algorithm. The organisms obtained here represent a better solution to the non-convex ELD problem with valve-point eects. If the termination criteria are not reached, the next
iteration is started. The end.
4. Experimental results
The SOS algorithm has been used for solving the ELD problem with valve-point eect. Five dierent test systems are used to show eectiveness of the proposed method. They are IEEE 3-machine 6-bus, IEEE 5-machine 14-bus, IEEE 6-5-machine 30-bus, and 13- and 40-unit test systems both with transmission loss and without transmission loss. The setting parameters of the proposed heuristic technique are given in Appendix Table A.1 in the Appendix. The program is written in MATLAB and run on a 2.63 GHz Pentium IV personal computer with 512MB RAM. Descriptions of the test systems are given as follows:
Test Case 1: IEEE 3-machine 6-bus test system is considered in this case. The generators data are obtained from [29] and presented Tables A.2 and A.3 in the Appendix. The load demand of all units with 210 MW should be satised. The proposed method is run 40 times and the obtained results are illustrated in Table 1 by comparison with other methods reported before. Minimum, average, and maximum results of the proposed method and comparison with the results obtained from the other methods in the literature are shown in Table 2.
The convergence curve of the total fuel cost obtained from SOS algorithm for Test Case 1 is shown in Figure 4. According to Figure 4, the SOS algorithm reaches the optimal solution in about 25 iterations. This result shows that the SOS algorithm
Figure 4. Convergence of total fuel cost obtained from SOS for Test Case 1.
Table 1. Comparison of the results obtained from SOS for Test Case 1. Methods
Units GA [29] GA-APO [29] NSOA [29] SOS
P1 53.2604 61.6467 50 50
P2 88.9645 95.1632 86.0356 76.0015
P3 74.7693 60.5402 79.7438 90.8627
Total power output (MW) 216.9942 217.3501 215.7794 216.8642 Total fuel cost ($/hr) 3252.4576 3341.771 3206.0022 3199.0113
Ploss (MW) 6.9939 7.346085 5.7794 6.8641
Simulations times of the SOS algorithm (s) 8.2587
Table 2. The results obtained from the SOS for Test Case 1.
Method Min. Average Max.
GA [29] 3252.46 { 3463.37
GA-APO [29] 3341.77 { 3294.81
NSOA [29] 3205.99 { 3206.00
Figure 5. The total fuel cost values obtained from the SOS algorithm for 40 trials (Test Case 1).
converges on the solution quickly. As can be seen in Table 1, optimal solution of SOS for this test case is less than the best solution reported in [29] by 6.99 $/hr. Besides, minimum, average, and maximum results of SOS algorithm have the same value for 40 runs. This result shows that SOS algorithm produces very accurate and fast results in all trials for small power systems. The total fuel cost values obtained from the proposed approach for the solutions performed 40 times for Test Case 1 are shown in Figure 5.
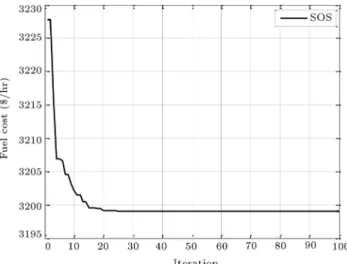
Test Case 2: IEEE 5-machine 14-bus test system is considered in this case. The total load demand is 259 MW. The generators data are obtained from [29] and presented in Tables A.2 and A.3. The proposed algorithm is run 40 times and the results obtained from it are presented in Table 3 by comparison with other methods reported before in the literature. According to the results in Table 3, the proposed algorithm produces the minimum fuel cost with 834.1302 $/hr and it is obviously seen that this result is the best among all in the literature. The convergence curve of total fuel cost obtained from SOS for this case is illustrated in Figure 6. The SOS algorithm reaches the optimal solution in about 55 iterations as seen in Figure 6. The minimum, average, and maximum results of the SOS method and results obtained from the other heuristic tech-niques previously reported in the literature for this test system are given in Table 4. The total fuel cost values obtained from the proposed SOS algorithm
Figure 6. Convergence of total fuel cost obtained from SOS for Test Case 2.
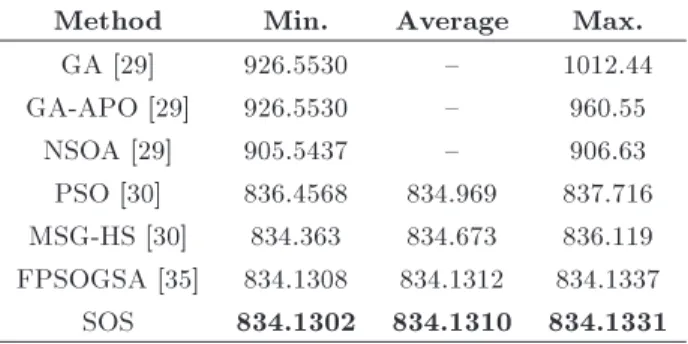
Table 4. The results obtained from the proposed approach for Test Case 2.
Method Min. Average Max.
GA [29] 926.5530 { 1012.44
GA-APO [29] 926.5530 { 960.55
NSOA [29] 905.5437 { 906.63
PSO [30] 836.4568 834.969 837.716 MSG-HS [30] 834.363 834.673 836.119 FPSOGSA [35] 834.1308 834.1312 834.1337
SOS 834.1302 834.1310 834.1331
in the solutions done 40 times for Test Case 2 are shown in Figure 7. From Figure 7, it is obvious that the total fuel cost values have been changed by 0.0029 unit.
Test Case 3: IEEE 6-machine 30-bus test system is considered in this case. The total load demand is 283.4 MW for this case. The generators data are obtained from [29,35] and presented in Tables A.2 and A.3. Results are obtained from the proposed
Table 3. Comparison of the results obtained from SOS for Test Case 2. Methods
Units GA
[29]
GA-APO [29]
NSOA [29]
PSO [30]
MSG-HS [30]
FPSOGSA
[35] SOS
P1 172.7647 172.7647 181.1287 197.4696 199.6923 199.5997 199.5997
P2 26.6212 26.6212 46.7567 20.0000 20.0000 20.0000 20.0000
P3 24.8322 24.8322 19.1526 21.3421 20.8157 20.9133 20.9913
P4 23.4152 23.4152 10.1879 11.6762 15.5504 15.4893 15.4673
P5 19.1885 19.1885 10.7719 17.7744 12.5069 12.5527 12.4960
Total power output (MW) 266.8217 266.8217 267.9977 268.2623 268.5653 268.555 268.5543 Total fuel cost ($/hr) 926.5530 926.5530 905.5437 836.4568 834.363 834.1308 834.1302 Ploss (MW) 7.8250 7.8250 8.9977 9.2623 9.5654 9.555 9.5543
Figure 7. The total fuel cost values obtained from the SOS algorithm for 40 trials (Test Case 2).
Figure 8. Convergence of total fuel cost obtained from SOS for Test Case 3.
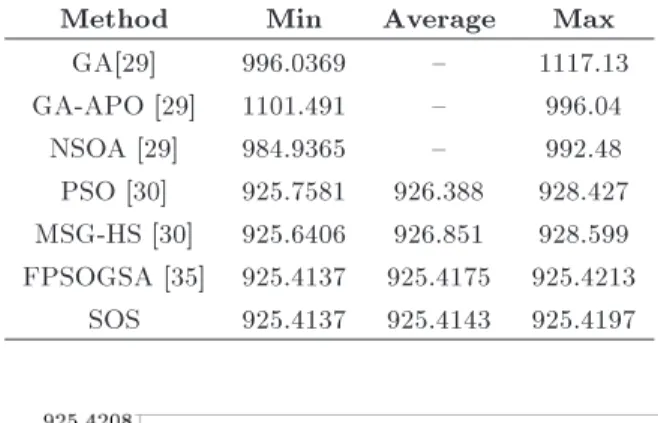
algorithm for 40 runs and given in Table 5 by com-parison with other techniques reported before in the literature. The SOS algorithm has the same value for total fuel cost of 925.4137 $/hr and it is less than others reported before. Moreover, the proposed algorithm meets the total load demand exactly, but FPSOGSA misses with a little dierence. Thus, SOS is a good alternative method to solve such a power system. The convergence curve of total fuel cost for this case is presented in Figure 8. The proposed algorithm converges on the global optima after about 70 iterations as seen in Figure 8. The
Table 6. The results obtained from the proposed approach for Test Case 3.
Method Min Average Max
GA[29] 996.0369 { 1117.13
GA-APO [29] 1101.491 { 996.04 NSOA [29] 984.9365 { 992.48 PSO [30] 925.7581 926.388 928.427 MSG-HS [30] 925.6406 926.851 928.599 FPSOGSA [35] 925.4137 925.4175 925.4213
SOS 925.4137 925.4143 925.4197
Figure 9. The total fuel cost values obtained from the SOS method for 40 trials (Test Case 3).
minimum, average, and maximum results of the SOS method and results obtained from the other stochastic methods in the literature for this test system are given in Table 6. The total fuel cost values obtained from the proposed SOS algorithm for the solutions done 40 times for Test Case 3 are shown in Figure 9. From Figure 9, it is clear that the total fuel cost values are changed by 0.0060 unit. Test Case 4: IEEE 13-machine test system is considered in this case. Three dierent load de-mands, namely, 1800 MW and 2520 MW with transmission loss and 2520 MW constrained, are considered. In the constrained case, power outputs of the 11th and 12th generators are xed at 75 MW and 60 MW. Generators data and B-coecient are
Table 5. Comparison of the results obtained from SOS for Test Case 3. Methods
Units GA
[29]
GA-APO [29]
NSOA [29]
PSO [30]
MSG-HP [30]
FPSOGSA
[35] SOS
P1 150.724 133.9816 182.478 197.8648 199.6331 199.5997 199.5997
P2 60.8707 37.2158 48.3525 50.3374 20.0000 20.0000 20.0000
P3 30.8965 37.7677 19.8553 15.0000 23.7624 23.9896 23.9768
P4 14.2138 28.3492 17.1370 10.0000 18.3934 18.8493 18.8679
P5 19.4888 18.7929 13.6677 10.0000 17.1018 18.2153 18.2212
P6 15.9154 38.0525 12.3487 12.0000 15.6922 13.8506 13.8402
Total power output (MW) 292.1096 294.1600 293.8395 295.2022 294.5829 294.5045 294.5058 Total fuel cost ($/hr) 996.0369 1101.491 984.9365 925.7581 925.6406 925.4137 925.4137 Ploss(MW) 8.7060 10.7563 10.4395 11.8022 11.1830 11.1044 11.1058
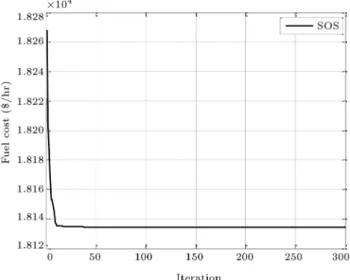
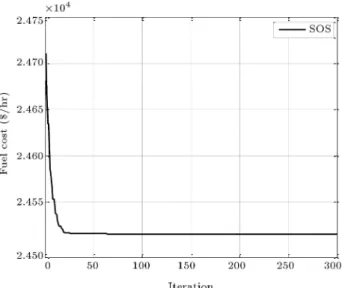
obtained from [35] and presented in Tables A.4 and A.5 in the Appendix. Results obtained from SOS algorithm for these cases are given in Table 7 by comparing other methods reported before. The SOS has the lowest total fuel costs by 18134.2805 $/hr and 24515.2275 $/hr for 1800 MW and 2520 MW load demands, respectively. The convergence curves for these cases are shown in Figures 10 and 11. It is seen from these gures that for both load demands, the SOS algorithm converges on the global optima after about 20 iterations. The total fuel cost values obtained from the proposed SOS algorithm in the solutions done 40 times for Test Case 4 are shown in Figures 12 and 13. From Figures 12 and 13, it is apparent that the total fuel cost values are changed by 0.1924 and 0.1857 unit, respectively.
Results obtained from SOS algorithm for 2520 MW constrained case are presented in Table 8. According to this table, SOS produces the best result together with FPSOGSA among all methods and has the lowest fuel cost with 24252.9363 $/hr. The convergence curve of fuel cost for this case is also shown in Figure 14.
Test Case 5: IEEE 40-machine test system without
Figure 10. Convergence of total fuel cost obtained from SOS for 1800 MW load demand.
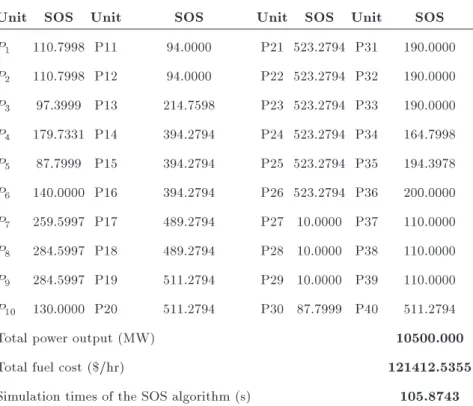
loss is considered in this case. Total load demand is 10500 MW. Generators data are taken from [35, 39] and can be observed in the mentioned studies. Results obtained from the proposed algorithm are given in Table 9 and compared with other results
ob-Table 7. Comparison of the results obtained from SOS for 1800 MW and 2520 MW load demands. Output power (MW)
PD = 1800 MW PD= 2520 MW
Unit SDE [31] FPSOGSA [35] SOS SDE [31] ICA-PSO [33] FPSOGSA [35] SOS
P1 448.80 448.7990 448.7990 628.32 628.32 628.3185 628.3184
P2 297.93 297.9312 296.8851 299.20 299.19 299.1993 299.199
P3 223.30 223.3374 224.3995 299.20 294.51 299.1993 299.1992
P4 109.85 109.8666 109.8666 159.73 159.73 159.7331 159.7331
P5 109.85 109.8666 109.8665 159.73 159.73 159.7331 159.7329
P6 159.71 159.7331 159.7331 159.73 159.73 159.7331 159.7331
P7 109.86 109.8666 109.8665 159.73 159.73 159.7331 159.7331
P8 60.00 60.0000 60.0000 159.73 159.73 159.7331 159.733
P9 109.82 109.8666 109.8665 159.73 159.73 159.7331 159.7331
P10 40.00 40.0000 40.0000 77.40 114.80 76.9368 77.3988
P11 40.00 40.0000 40.0000 113.12 116.45 114.2795 113.4981
P12 55.00 55.0000 55.0000 92.40 55.00 92.2438 92.3998
P13 55.00 55.0000 55.0000 92.40 92.40 92.2007 92.3997
Total power
output (MW) 1819.13 1819.2671 1819.2828 2560.43 2559.05 2560.7765 2560.8113
Ploss (MW) 19.13 19.2669 19.2829 40.43 39.05 40.7765 40.8112
Total fuel
cost ($/hr) 18134.49 18134.39457 18134.2805 24514.88 24540.06 24515.35543 24515.2275 Average fuel
cost ($/hr) 18138.56 18136.96721 18134.2977 24516.31 24561.46 24516.68231 24515.2626 Simulation times of the SOS algorithm (s) 45.7831 Simulation times of the SOS algorithm (s) 45.6429
Table 8. Comparison of the results obtained from SOS for 2520 MW constrained load demand.
Unit EP-SQP
[34]
PSO-SQP [34]
ICA-PSO [33]
RQEA [36]
SDE [32]
FPSOGSA
[35] SOS
P1 628.3136 628.3205 628.32 628.3170 628.31853071796 628.3185 628.3185
P2 299.1715 299.0524 299.20 299.1991 299.1990034188 299.1993 299.1993
P3 299.0474 298.9681 291.90 299.1990 299.19930034189 299.1993 299.1993
P4 159.6399 159.4680 159.73 159.7334 159.73310011396 159.7331 159.7331
P5 159.6560 159.1429 159.73 159.7331 159.73310011396 159.7331 159.7331
P6 158.4831 159.2724 159.73 159.7330 159.73310011396 159.7331 159.7331
P7 159.6749 159.5371 159.73 159.7324 159.73310011396 159.7331 159.7331
P8 159.7265 158.8522 159.73 159.7329 159.73310011396 159.7331 159.7331
P9 159.6653 159.7845 159.73 159.7331 159.73310011396 159.7331 159.7331
P10 114.0334 110.9618 114.80 107.4875 107.48435537177 107.4843 107.4844
P11 75.0000 75.0000 75.00 75.0000 75.00000000000 75.0000 75.0000
P12 60.0000 60.0000 60.00 60.0000 60.00000000000 60.0000 60.0000
P13 87.5884 91.6401 92.40 92.3994 92.39991254274 92.3999 92.3999
Total power output (MW) 2520.0000 2520.0000 2520.00 2519.9999 2520.000000000 2520.0000 2520.0000 Total fuel cost ($/hr) 24266.440 24261.050 24261.69 24252.950 24252.936305152 24252.9362294 24252.9363
Simulation times of the SOS algorithm (s) 62.6591
Table 9. Results obtained from SOS for Test Case 5.
Unit SOS Unit SOS Unit SOS Unit SOS
P1 110.7998 P11 94.0000 P21 523.2794 P31 190.0000
P2 110.7998 P12 94.0000 P22 523.2794 P32 190.0000
P3 97.3999 P13 214.7598 P23 523.2794 P33 190.0000
P4 179.7331 P14 394.2794 P24 523.2794 P34 164.7998
P5 87.7999 P15 394.2794 P25 523.2794 P35 194.3978
P6 140.0000 P16 394.2794 P26 523.2794 P36 200.0000
P7 259.5997 P17 489.2794 P27 10.0000 P37 110.0000
P8 284.5997 P18 489.2794 P28 10.0000 P38 110.0000
P9 284.5997 P19 511.2794 P29 10.0000 P39 110.0000
P10 130.0000 P20 511.2794 P30 87.7999 P40 511.2794
Total power output (MW) 10500.000
Total fuel cost ($/hr) 121412.5355
Figure 11. Convergence of total fuel cost obtained from SOS for 2520 MW load demand.
Figure 12. The total fuel cost values obtained from the SOS method for 40 trials (for 1800 MW).
Figure 13. The total fuel cost values obtained from the SOS method for 40 trials (for 2520 MW).
Figure 14. Convergence of total fuel cost obtained from SOS for 2520 MW constrained load demand.
Figure 15. Convergence of total fuel cost obtained from SOS for Test Case 5.
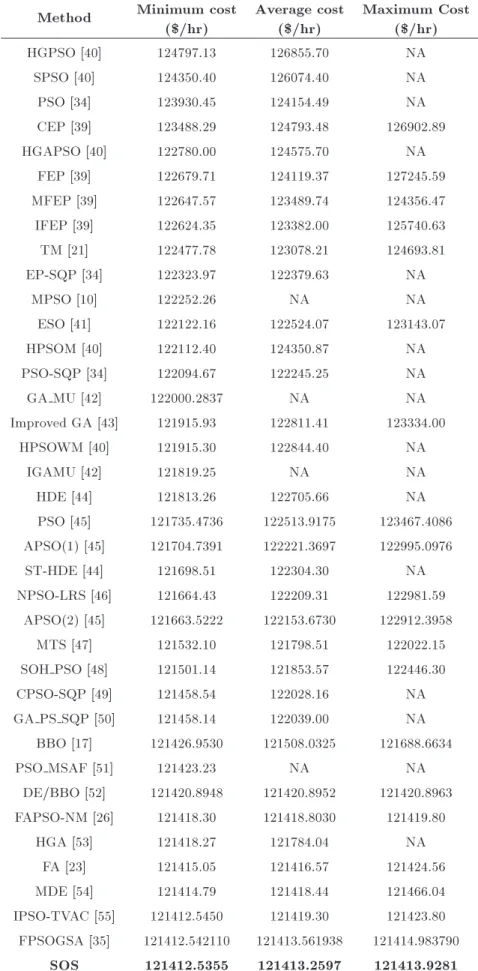
tained from dierent methods in the literature, pro-vided in Table 10. It can be seen in Table 10 that the proposed algorithm has the lowest fuel cost function with 121412.5355 $/hr among all methods, which is the best value produced up to now. The convergence curve of the total fuel cost obtained from SOS is shown in Figure 15. The optimal solution is found after about 50 iterations as seen in Figure 15. 5. Conclusion
This paper has employed SOS algorithm for the ELD problem with valve-point eect, which is one of the important optimization problems in power systems. The proposed algorithm was examined on 3-machine 6-bus, IEEE 5-machine 14-bus, IEEE 6-machine 30-bus, and 13- and 40-unit test systems both with trans-mission loss and without transtrans-mission loss. Obtained results showed that SOS algorithm solved the ELD problem successfully and eectively. From this com-parative study, it could be concluded that the proposed algorithm could be eectively used to solve dierent types of ELD problems. In order to prove feasibility of the proposed method, results obtained from SOS were compared with other methods existing in the literature. According to the comparisons, the proposed algorithm reduced the total fuel cost values for 5-machine 14-bus system with 210 MW load demand by 6.99 $/hr, for 5-machine 14-bus system with 259 MW load demand by 0.99 $/hr (the results of SOS for 6-machine 30-bus system are same as the result of FPSOGSA), for 13-machine system with 1800 MW load demand by 2.669 $/hr, for 13-machine system with 2520 MW load demand by 1.419 $/hr, and for 40-machine system with 10500 MW load demand by 0.00661 $/hr. It could be clearly seen from the results that SOS produced better
Table 10. Comparison of results for Test Case 5. Method Minimum cost
($/hr)
Average cost ($/hr)
Maximum Cost ($/hr)
HGPSO [40] 124797.13 126855.70 NA
SPSO [40] 124350.40 126074.40 NA
PSO [34] 123930.45 124154.49 NA
CEP [39] 123488.29 124793.48 126902.89
HGAPSO [40] 122780.00 124575.70 NA
FEP [39] 122679.71 124119.37 127245.59 MFEP [39] 122647.57 123489.74 124356.47 IFEP [39] 122624.35 123382.00 125740.63
TM [21] 122477.78 123078.21 124693.81
EP-SQP [34] 122323.97 122379.63 NA
MPSO [10] 122252.26 NA NA
ESO [41] 122122.16 122524.07 123143.07
HPSOM [40] 122112.40 124350.87 NA
PSO-SQP [34] 122094.67 122245.25 NA
GA MU [42] 122000.2837 NA NA
Improved GA [43] 121915.93 122811.41 123334.00
HPSOWM [40] 121915.30 122844.40 NA
IGAMU [42] 121819.25 NA NA
HDE [44] 121813.26 122705.66 NA
PSO [45] 121735.4736 122513.9175 123467.4086 APSO(1) [45] 121704.7391 122221.3697 122995.0976
ST-HDE [44] 121698.51 122304.30 NA
NPSO-LRS [46] 121664.43 122209.31 122981.59 APSO(2) [45] 121663.5222 122153.6730 122912.3958
MTS [47] 121532.10 121798.51 122022.15 SOH PSO [48] 121501.14 121853.57 122446.30
CPSO-SQP [49] 121458.54 122028.16 NA
GA PS SQP [50] 121458.14 122039.00 NA
BBO [17] 121426.9530 121508.0325 121688.6634
PSO MSAF [51] 121423.23 NA NA
DE/BBO [52] 121420.8948 121420.8952 121420.8963 FAPSO-NM [26] 121418.30 121418.8030 121419.80
HGA [53] 121418.27 121784.04 NA
FA [23] 121415.05 121416.57 121424.56
MDE [54] 121414.79 121418.44 121466.04 IPSO-TVAC [55] 121412.5450 121419.30 121423.80
FPSOGSA [35] 121412.542110 121413.561938 121414.983790 SOS 121412.5355 121413.2597 121413.9281
results than other well-known meta-heuristic methods for both small and big test systems. Moreover, the proposed approach has some merits such as simple concept, easy implementation, and better eectiveness than previous methods.
References
1. Farag, A., Al-Baiyat, S., and Cheng, T.C. \Economic load dispatch multiobjective optimization procedures using linear programming techniques", IEEE Trans Power Syst, 10(2), pp. 731-738 (1995).
2. Vargas, L.S., Quintana, V.H., and Vannelli, A. \A tutorial description of an interior point method and its applications to security-constrained economic dis-patch", Power Systems, IEEE Transactions on , 8(3), pp. 1315-1324 (1993).
3. Irisarri, G., Kimball, L.M., Clements, K.A., Bagchi, A., and Davis, P.W. \Economic dispatch with network and ramping constraints via interior point methods", Power Systems, IEEE Transactions on , 13(1), pp. 236-242 (1998).
4. Liang, Z.-X. and Duncan Glover, J. \A zoom feature for a dynamic programming solution to economic dis-patch including transmission losses", Power Systems, IEEE Transactions on, 7(2), pp. 544-550 (1992).
5. Wong, K.P. and Fung, C.C. \Simulated annealing based economic dispatch algorithm", IEE Proceedings C (Generation, Transmission and Distribution), IEE, 140(6), pp. 509-515 (1993).
6. Walters, D.C. and Sheble, G.B. \Genetic algorithm so-lution of economic dispatch with valve point loading", Power Systems, IEEE Transactions on, 8(3), pp. 1325-1332 (1993).
7. Chiang, C.L. \Improved genetic algorithm for power economic dispatch of units with valve-point eects and multiple fuels", Power Systems, IEEE Transactions on, 20(4), pp. 1690-1699 (2005).
8. Lin, W.H., Cheng, F.S., and Tsay, M.T. \An improved tabu search for economic dispatch with multiple min-ima", Power Systems, IEEE Transactions on, 17(1), pp. 108-112 (2002).
9. Gaing, Z.L. \Particle swarm optimization to solv-ing the economic dispatch considersolv-ing the generator constraints", Power Systems, IEEE Transactions on, 18(3), pp. 1187-1195 (2003).
10. Park, J.B., Lee, K.S., Shin, J.R., and Lee, K.Y. \A par-ticle swarm optimization for economic dispatch with nonsmooth cost functions", Power Systems, IEEE Transactions on, 20(1), pp. 34-42 (2005).
11. Noman, N. and Iba, H. \Dierential evolution for economic load dispatch problems", Electric Power Systems Research, 78(8), pp. 1322-1331 (2008).
12. Hou, Y.H., Wu, Y.W., Lu, L.J., and Xiong, X.Y. \Generalized ant colony optimization for economic dis-patch of power systems", In International Conference on Power System Technology, pp. 225-229 (2002).
13. Pothiya, S., Ngamroo, I., and Kongprawechnon, W. \Ant colony optimisation for economic dispatch prob-lem with non-smooth cost functions", International Journal of Electrical Power & Energy Systems, 32(5), pp. 478-487 (2010).
14. Panigrahi, B.K. and Pandi, V.R. \Bacterial foraging optimisation: Nelder-Mead hybrid algorithm for eco-nomic load dispatch", IET Generation, Transmission & Distribution, 2(4), pp. 556-565 (2008).
15. Hemamalini, S. and Simon, S.P. \Articial bee colony algorithm for economic load dispatch problem with non-smooth cost functions", Electric Power Compo-nents and Systems, 38(7), pp. 786-803 (2010).
16. Duman, S., Guvenc, U., and Yorukeren, N. \Gravi-tational search algorithm for economic dispatch with valve-point eects", International Review of Electrical Engineering, 5(6), pp. 2890-2895 (2010).
17. Bhattacharya, A. and Chattopadhyay, P.K. \Bio-geography-based optimization for dierent economic load dispatch problems", Power Systems, IEEE Trans-actions on, 25(2), pp. 1064-1077 (2010).
18. Han, F. and Lu, Q.S. \An improved chaos optimization algorithm and its application in the economic load dispatch problem", International Journal of Computer Mathematics, 85(6), pp. 969-982 (2008).
19. Al-Sumait, J.S., Al-Othman, A.K., and Sykulski, J.K. \Application of pattern search method to power sys-tem valve-point economic load dispatch", International Journal of Electrical Power & Energy Systems, 29(10), pp. 720-730 (2007).
20. Shaw, B., Mukherjee, V., and Ghoshal, S.P. \Seeker optimisation algorithm: application to the solution of economic load dispatch problems", IET Generation, Transmission & Distribution, 5(1), pp. 81-91 (2011).
21. Liu, D. and Cai, Y. \Taguchi method for solving the economic dispatch problem with nonsmooth cost functions", Power Systems, IEEE Transactions on, 20(4), pp. 2006-2014 (2005).
22. Narimani, M.R. \A new modied shue frog leaping algorithm for non-smooth economic dispatch", World Applied Sciences Journal, 12(6), pp. 803-814 (2011).
23. Yang, X.S., Sadat Hosseini, S.S., and Gandomi, A.H. \Firey algorithm for solving non-convex economic dispatch problems with valve loading eect", Applied Soft Computing, 12(3), pp. 1180-1186 (2012).
24. Coelho, L.D.S. and Mariani, V.C. \An ecient cul-tural self-organizing migrating strategy for economic dispatch optimization with valve-point eect", Energy Conversion and Management, 51(12), pp. 2580-2587 (2010).
25. Coelho, L.D.S. and Mariani, V.C. \Combining of chaotic dierential evolution and quadratic program-ming for economic dispatch optimization with valve-point eect", Power Systems, IEEE Transactions on, 21(2), pp. 989-996 (2006).
26. Niknam, T. \A new fuzzy adaptive hybrid particle swarm optimization algorithm for linear, non-smooth and non-convex economic dispatch problem", Applied Energy, 87(1), pp. 327-339 (2010).
27. He, D., Wang, F., and Mao, Z. \A hybrid genetic algorithm approach based on dierential evolution for economic dispatch with valve-point eect", Interna-tional Journal of Electrical Power & Energy Systems, 30(1), pp. 31-38 (2008).
28. Mirjalili, S. and Hashim, S.Z.M. \A new hybrid PSOGSA algorithm for function optimization", In In-ternational Conference on Computer and Information Application (ICCIA 2010), pp. 374-377 (2010).
29. Malik, T.N., ul Asar, A., Wyne, M.F., and Akhtar, S. \A new hybrid approach for the solution of nonconvex economic dispatch problem with valve-point eects", Electr Power Syst Res, 80, pp. 1128-1136 (2010).
30. Yasar, C. and Ozyon, S. \A new hybrid approach for nonconvex economic dispatch problem with valve-point eect", Energy, 35, pp. 5838-5845 (2011).
31. Reddy, A.S. and Vaisakh, K. \Shued dierential evolution for large scale economic dispatch", Electr Power Syst Res, 96, pp. 237-245 (2013).
32. Reddy, A.S. and Vaisakh, K. \Shued dierential evo-lution for economic dispatch with valve point loading eects", Int J Electr Power Energy Syst, 46, pp. 342-352 (2013).
33. Vlachogiannis, J.G. and Lee, K.Y. \Economic load dis-patch - A comparative study on heuristic optimization techniques with an improved coordinated aggregation based PSO", IEEE Trans Power Syst, 24(2), pp. 991-1001 (2009).
34. Victoire, T.A.A. and Jeyakumar, A.E. \Hybrid PSO-SQP for economic dispatch with valve-point eect", Electr Power Syst Res, 71(1), pp. 51-59 (2004).
35. Duman, S., Yorukeren, N., and Altas, I.H. \A novel modied hybrid PSOGSA based on fuzzy logic for non-convex economic dispatch problem with valve-point eect", International Journal of Electrical Power & Energy Systems, 64, pp. 121-135 (2015).
36. Babu, G.S.S., Das, D.B., and Patvardhan, C. \Real pa-rameter quantum evolutionary algorithm for economic load dispatch", IET Gener Transm Distrib, 2(1), pp. 22-31 (2008).
37. Meng, K., Wang, H.G., Dong, Z., and Wong, K.P. \Quantum-inspired particle swarm optimization for valve-point economic load dispatch", Power Systems, IEEE Transactions on, 25(1), pp. 215-222 (2010).
38. Cheng, M.Y. and Prayogo, D. \Symbiotic Organisms Search: A new metaheuristic optimization algorithm", Computers & Structures, 139, pp. 98-112 (2014).
39. Sinha, N., Chakrabarti, R., and Chattopadhyay, P.K. \Evolutionary programming techniques for economic load dispatch", IEEE Trans Evol Comput, 7(1), pp. 83-94 (2003).
40. Ling, S.H., Lu, H.H.C., Chan, K.Y., Lam, H.K., Yeung, B.C.W., and Leung, F.H. \Hybrid particle swarm optimization with wavelet mutation and its industrial applications", IEEE Trans Syst Man Cybern Part B: Cybern, 38(3), pp. 743-763 (2008).
41. Pereira-Neto, A., Unsihuay, C., and Saavedra, O.R. \Ecient evolutionary strategy optimization proce-dure to solve the nonconvex economic dispatch prob-lem with generator constraints", IEE Proc Gener Transm Distrib, 152(5), pp. 653-660 (2005).
42. Chiang, C.L. \Genetic-based algorithm for economic load dispatch", IET Gener Transm Distrib, 1(2), pp. 261-269 (2007).
43. Ling, S.H. and Leung, F.H.F. \An improved genetic algorithm with average-bound crossover and wavelet mutation operation", Soft Comput, 11(1), pp. 7-31 (2007).
44. Wang, S.K., Chiou, J.P., and Liu, C.W. \Non-smooth/non-convex economic dispatch by a novel hybrid dierential evolution algorithm", IET Gener Transm Distrib, 1(5), pp. 793-803 (2007).
45. Selvakumar, A.I. and Thanushkodi, K. \Anti-predatory particle swarm optimization: Solution to nonconvex economic dispatch problems", Electr Power Syst Res, 78, pp. 2-10 (2008).
46. Selvakumar, L. and Thanushkodi, K. \A new particle swarm optimization solution to nonconvex economic dispatch problems", IEEE Trans Power Syst, 22(1), pp. 42-51 (2007).
47. Sa-ngiamvibool, W., Pothiya, S., and Ngamro, I. \Multiple tabu search algorithm for economic dispatch problem considering valve-point eects", Electr Power Energy Syst, 33, pp. 846-854 (2011).
48. Chaturvedi, K.T., Pandit, M., and Srivastava, L. \Self-organizing hierarchical particle swarm optimization for nonconvex economic dispatch", IEEE Trans Power Syst, 23(3), pp. 1079-1087 (2008).
49. Cai, J., Li, Q., Li, L., Peng, H., and Yang, Y. \A hybrid CPSO-SQP method for economic dispatch considering the valve-point eects", Energy Convers Manage, 53, pp. 175-81 (2012).
50. Alsumait, J.S., Sykulski, J.K., and Al-Othman, A.K. \A hybrid GA-PS-SQP method to solve power sys-tem valve-point economic dispatch problems", Appl Energy, 87, pp. 1773-1781 (2010).
51. Subbaraj, P., Rengaraj, R., Salivahanan, S., and Senthilkumar, T.R. \Parallel particle swarm optimiza-tion with modied stochastic acceleraoptimiza-tion factors for solving large scale economic dispatch problem", Electr Power Energy Syst, 32, pp. 1014-1023 (2010).
52. Bhattacharya, A. and Chattopadhyay, P.K. \Hybrid dierential evolution with biogeography-based opti-mization for solution of economic load dispatch", IEEE Trans Power Syst, 25(4), pp. 1955-1964 (2010).
53. Dakuo, H., Fuli, W., and Zhizhong, M. \A hybrid genetic algorithm approach based on dierential evo-lution for economic dispatch with valve-point eect", Electr Power Energy Syst, 30, pp. 31-38 (2008).
54. Amjady, N. and Sharifzadeh, H. \Solution of
non-convex economic dispatch problem considering valve loading eect by a new modied dierential evolution algorithm", Electr Power Energy Syst, 32, pp. 893-903 (2010).
55. Mohammadi-Ivatloo, B., Rabiee, A., Soroudi, A., and Ehsan, M. \Iteration PSO with time varying accel-eration coecients for solving non-convex economic dispatch problems", Int J Electr Power Energy Syst, 42, pp. 508-516 (2012).
Appendix
Tables A.1.to A.5 are described as data of the test cases.
Table A.1. Setting parameters of the SOS algorithm for the ELD problem.
Test system Number of organisms
(eco size) max iter
6-bus 3-machine system 50 100
IEEE 14-bus 5-machine system 50 100
IEEE 30-bus 6-machine system 50 200
13-unit test system (for 1800 MW and 2520 MW) 80 300 13-unit test system (for 2520 MW constrained ) 100 500
40-unit test system 100 500
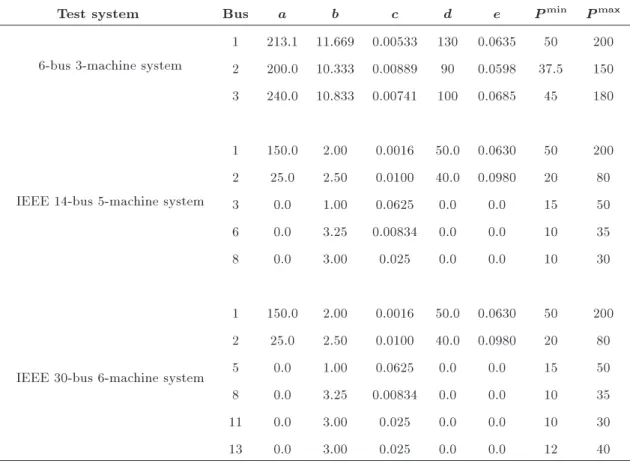
Table A.2. Cost coecients of the generating units [29,34].
Test system Bus a b c d e Pmin Pmax
1 6-bus 3-machine system
1 213.1 11.669 0.00533 130 0.0635 50 200 2 200.0 10.333 0.00889 90 0.0598 37.5 150 3 240.0 10.833 0.00741 100 0.0685 45 180
2 IEEE 14-bus 5-machine system
1 150.0 2.00 0.0016 50.0 0.0630 50 200 2 25.0 2.50 0.0100 40.0 0.0980 20 80
3 0.0 1.00 0.0625 0.0 0.0 15 50
6 0.0 3.25 0.00834 0.0 0.0 10 35
8 0.0 3.00 0.025 0.0 0.0 10 30
3 IEEE 30-bus 6-machine system
1 150.0 2.00 0.0016 50.0 0.0630 50 200 2 25.0 2.50 0.0100 40.0 0.0980 20 80
5 0.0 1.00 0.0625 0.0 0.0 15 50
8 0.0 3.25 0.00834 0.0 0.0 10 35
11 0.0 3.00 0.025 0.0 0.0 10 30
Table A.3. B-coecients for test systems [29,34].
Test system B-Coecients
1 6-bus 3-machine system
[B] = 2 6 6 4
0:0552 0:0062 0:0046 0:0062 0:0253 0:0064
0:0046 0:0064 0:0286 3 7 7 5
[B0] =
h
0:0046 0:0035 0:0019i B00= 0:00055711
2 IEEE 14-bus 5-machine system
[B] = 2 6 6 6 6 6 6 6 4
0:0212 0:0085 0:0009 0:0021 0:0007 0:0085 0:0206 0:0041 0:0037 0:0001 0:0009 0:0041 0:0395 0:0207 0:0251 0:0021 0:0037 0:0207 0:0613 0:0071 0:0007 0:0001 0:0251 0:0071 0:0406
3 7 7 7 7 7 7 7 5
[B0] =
h
0:0002 0:0030 0:0017 0:0101 0:0038i B00= 0:00085357
3 IEEE 30-bus 6-machine system
[B] = 2 6 6 6 6 6 6 6 6 6 4
0:0224 0:0103 0:0016 0:0053 0:0009 0:0013 0:0103 0:0158 0:0010 0:0074 0:0007 0:0024 0:0016 0:0010 0:0474 0:0687 0:0060 0:0350
0:0053 0:0074 0:0687 0:3464 0:0105 0:0534 0:0009 0:0007 0:0060 0:0105 0:0119 0:0007 0:0013 0:0024 0:0350 0:0534 0:0007 0:2353
3 7 7 7 7 7 7 7 7 7 5
[B0] =
h
0:0005 0:0016 0:0029 0:0060 0:0014 0:0015i B00= 0:0011
Table A.4. Generators data of Test Case 4 [35]. Test
system Units a b c d e P
min Pmax
4
1 550 8.10 0.00028 300 0.035 0 680 2 309 8.10 0.00056 200 0.042 0 360 3 307 8.10 0.00056 200 0.042 0 360 4 240 7.74 0.00324 150 0.063 60 180 5 240 7.74 0.00324 150 0.063 60 180 6 240 7.74 0.00324 150 0.063 60 180 7 240 7.74 0.00324 150 0.063 60 180 8 240 7.74 0.00324 150 0.063 60 180 9 240 7.74 0.00324 150 0.063 60 180 10 126 8.60 0.00284 100 0.084 40 120 11 126 8.60 0.00284 100 0.084 40 120 12 126 8.60 0.00284 100 0.084 55 120 13 126 8.60 0.00284 100 0.084 55 120
Table A.5. B-coecients for 13-unit test system [31,35]. B-Coecients [B] = 2 6 6 6 6 6 6 6 6 6 6 6 6 6 6 6 6 6 6 6 6 6 6 6 6 6 6 6 4
0:0014 0:0012 0:0007 0:0001 0:0003 0:0001 0:0001 0:0001 0:0003 0:0005 0:0003 0:0002 0:0004 0:0012 0:0015 0:0013 0 0:0005 0:0002 0 0:0001 0:0002 0:0004 0:0004 0 0:0004 0:0007 0:0013 0:0076 0:0001 0:0013 0:0009 0:0001 0 0:0008 0:0012 0:0017 0 0:0026
0:0001 0 0:0001 0:0034 0:0007 0:0004 0:0011 0:005 0:0029 0:0032 0:0011 0 0:0001 0:0003 0:0005 0:0013 0:0007 0:009 0:0014 0:0003 0:0012 0:001 0:0013 0:0007 0:0002 0:0002 0:0001 0:0002 0:0009 0:0004 0:0014 0:0016 0 0:0006 0:0005 0:0008 0:0011 0:0001 0:0002 0:0001 0 0:0001 0:0011 0:0003 0 0:0015 0:0017 0:0015 0:0009 0:0005 0:0007 0 0:0001 0:0001 0 0:005 0:0012 0:0006 0:0017 0:0168 0:0082 0:0079 0:0023 0:0036 0:0001 0:0003 0:0002 0:0008 0:0029 0:001 0:0005 0:0015 0:0082 0:0129 0:0116 0:0021 0:0025 0:0007 0:0005 0:0004 0:0012 0:0032 0:0013 0:0008 0:0009 0:0079 0:0116 0:02 0:0027 0:0034 0:0009 0:0003 0:0004 0:0017 0:0011 0:0007 0:0011 0:0005 0:0023 0:0021 0:0027 0:014 0:0001 0:0004 0:0002 0 0 0 0:0002 0:0001 0:0007 0:0036 0:0025 0:0034 0:0001 0:0054 0:0001 0:0004 0:0004 0:0026 0:0001 0:0002 0:0002 0 0:0001 0:0007 0:0009 0:0004 0:0001 0:0103
3 7 7 7 7 7 7 7 7 7 7 7 7 7 7 7 7 7 7 7 7 7 7 7 7 7 7 7 5
[B0] =
"
0:0001 0:0002 0:0028 0:0001 0:0001 0:0003
0:0002 0:0002 0:0006 0:0039 0:0017 0 0:0032 #
B00= 0:0055
Biographies
Ugur Guvenc was born in Zile, Turkey, in 1980. He received the BS degree in Electrical Education from Abant _Izzet Baysal University, Bolu, Turkey, in 2002, and the MS and PhD degrees from Gazi University, Turkey, in 2005 and 2008, respectively. He is currently Associate Professor in the Department of Electrical and Electronics Engineering in the Faculty of Technology at Duzce University, Turkey. His main research interests are articial intelligence, power systems, and image processing.
Serhat Duman was born in Bandrma, Turkey, in 1981. He received the BS degree in Electrical Ed-ucation from Abant _Izzet Baysal University, Bolu, Turkey, in 2008, the MS degree from the Department of Electrical Education at Duzce University, Turkey, in 2010, and the PhD degree from the Department of Electrical Engineering at Kocaeli University, Turkey, in 2015. He is currently Assistant Professor in the Department of Electrical and Electronics Engineering in the Faculty of Technology at Duzce University, Turkey. His areas of research include power system stability, FACTS, optimization techniques, optimiza-tion problems in power systems, renewable energy resources, and articial intelligence.
Yusuf Sonmez was born in Ankara, Turkey, in 1980. He received the BS degree in Electrical Education from Gazi University, Turkey, in 2002. Also, he received MS and PhD degrees in 2005 and 2008 from Gazi University, where he has been working as Associate Professor since 2014. His research interests are arti-cial intelligence, optimization methods, power system stability, and FACTS devices.
Hamdi Tolga Kahraman received the BS and the PhD degrees from the Institute of Science and Technology at Gazi University, Turkey, in 2004 and 2009, respectively. He worked as a scholar visitor and researcher in Ford Interdisciplinary Research Cen-ter at North Carolina A&T State University, USA, in 2012. He is now Associate Professor and head of the Department of Software Engineering at Ka-radeniz Technical University. His research interests include modern heuristic and intuitive optimization techniques (genetic algorithms, articial bee colony algorithm, and symbiotic organism search), articial neural networks, hybrid classication and estimation algorithms, searching algorithms, data mining, fuzzy logic, intelligent systems, user modeling, hypermedia reference models, human-computer interaction, and web-based smart applications. He is an editorial board member of Algorithms Research and International Journal of Renewable Energy Research-IJRER, and program committee member of numerous international conferences. He received his rst patent on a supervised adaptive hypermedia system.
Mehmet Kenan Dosoglu was born in Gaziantep, Turkey, in 1983. He received the BS degree in Electrical Education from Abant Izzet Baysal University, Bolu, Turkey, in 2006, the MS degree from the Department of Electrical Education at Duzce University, Turkey, in 2010, and the PhD degree from the Department of Electrical Engineering at Kocaeli University, Turkey, in 2014. He is currently Assistant Professor in the De-partment of Electrical and Electronics Engineering in the Faculty of Technology at Duzce University, Turkey. His areas of research include power system stability, FACTS devices, and wind farm dynamic modelling.