The Optimization of Microraft Production and Use for Cell Identification and Sorting
Robert Hinson
!
Abstract
Microwell arrays containing magnetic microrafts provide an alternative to fluorescence-activated cell sorting (FACS) that allows for the sorting of cells using temporal characteristics and improved viability for adherent cell lines. Making these arrays from thicker layers of polydimethylsiloxane (PDMS) improved the imaging quality by reducing the sagging of the array caused by the weight of cell culture media and did not hinder the effectiveness of releasing the rafts for cell sorting. It was also found that centrifugation of cells in these arrays drastically reduced the time it took for the cells to sediment into the wells at the desired density and did not reduce the viability of the cells.
!
Introduction
The efficient and reliable identification and isolation of specific cell lines is of paramount importance in diagnostics and biomedical research. A single tissue sample may contain a multitude of different cell types while only one type is of interest. For example, it might be pertinent to isolate cancerous cells from a sample containing healthy cells as well. Upon successful identification and isolation of the desired cell line, the cells can be cultured and studied1.
One of the current methods for isolating cell lines is fluorescence-activated cell sorting (FACS), which is a variation of flow cytometry. FACS consists of a system where cells are suspended in a stream of fluid, which flows by an electronic apparatus that can measure light scattering and fluorescent properties. Based on these sorting techniques, FACS can be used to identify and isolate cells with and without fluorescent markers. The channel through which fluid flows is narrow enough to ensure only one cell passes by the sensor at a time. The cell is then eluted in a drop and based on the readings the cell produced, the drop of fluid receives a charge and is deflected by an electric field into the designated container2.
This method of cell sorting is commonly used in biomedical research and medicine. It is an effective method of sorting and isolating desired cell lines. However, it is not capable of sorting based on temporal characteristics. The instant the cell is being read by the sensors is the only information used to sort the cell. Therefore, using FACS to isolate and sort cells based on generation time or changes over time is not viable. Another drawback is the fact that cells must be suspended in a solution to undergo FACS. This reduces viability of adherent cell lines that are of interest to researchers.
Because of these limitations, an alternative method of cell identification and sorting is necessary. One such method is the use of magnetism to isolate desired cell lines. These methods have primarily relied upon the binding of magnetic particle to cells or being absorbed into cells. The use of a magnetic field allows for easy and effective manipulation of the cells3. However,
dipcoating process. The aforementioned arrays are then glued to plastic cassettes using PDMS4.
However, the arrays also have drawbacks. One major drawback is sagging of the array, which leads to non-uniform focus in different regions of the array. This arises from the fact that the array is made from an elastomer which is simply pulled as taut as possible and glued to the cassette. Tissue culture media is then added to the array, but the weight of the media introduces sag across the elastomeric array. Furthermore, the sag complicates the release of the rafts, as the needle that punctures the PDMS from below performs optimally when the PDMS is under tension. Therefore, reducing PDMS sag is necessary in order to optimize the imaging and eventual sorting of cells using this microarray technology.
An additional complication of the current array setup is the time required for cells to settle onto the rafts. The current protocol for using these devices calls for plating 3 mL of media containing cells in each array and waiting approximately 1 hour for the cells to sediment to the bottom before beginning experiments. A more time-efficient method for forcing cells to settle without reducing viability is desirable. Centrifugation makes cells experience accelerations many times the normal acceleration due to gravity while in solution, and thus rapidly increases the rate of sedimentation. However, the strain placed on the cells by this increased acceleration risks killing the cells and reducing the viability of the cells. To find the optimum centrifugation parameters, various spin speeds and times need to be tested to check for accurate sedimentation and maintained viability of cell lines.
!
Materials and Methods
!
Materials
Poly(dimethylsiloxane) (PDMS, Sylgard 184 silicone elastomer kit) was purchased from Dow Corning. Iron(II) chloride tetrahydrate (99%), iron(III) chloride anhydrous (98%), iron(III) nitrate nonahydrate (99+%), 28% ammonium hydroxide solution, oleic acid (90%), toluene (reagent grade), triarylsulfonium hexafluorophosphate salts (mixed, 50% in propylene carbonate), 99+% pure ɣ-butyralactone (GBL), 1-methoxy-2-propanol (1002F developer, 98.5%), glutaraldehyde, rhodamine B, 2,2’-azobisisobutyionitrile (AIBN, 98%), styrene (99%), and acrylic acid (99.5%) were obtained from Alrich Chemical Company. EPON resin 1002F was obtained from Miller-Stephenson.
!
Magnetic Polystyrene Synthesis
Iron salts were co-precipitated in deionized water by using ammonium hydroxide to yield nanoparticles of Fe3O4. The magnetic nanoparticles were magnetically decanted and mixed with
fresh deionized water and iron nitrate. The nanoparticles were oxidized to ɣFe2O3 by heating at
80oC for 1 hour. The nanoparticles were suspended in deionized water and extracted using oleic
acid and magnetically decanting the particles. This made the nanoparticles hydrophobic. Excess oleic acid was removed by three ethanol washes and the nanoparticles were suspended in toluene. The nanoparticles were mixed with a solution of polystyrene-acrylic acid (PS-AA) in toluene. The toluene was evaporated utilizing a rotary evaporator and GBL was added until the solution reached the desired viscosity.
Microwell Array Mold Synthesis
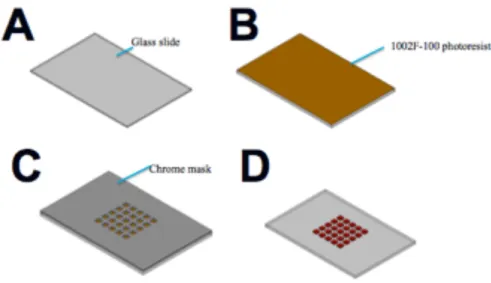
The templates for the aforementioned microwell arrays were synthesized using standard photolithography. Two array geometries were utilized: 200 µm x 200 µm x 100 µm tall and 200 µmcubes. 1002F-100 photoresist was spin coated onto a 50 mm x 75 mm glass slide for 10 sec at 500 rpm, followed by 30 sec at 1800 rpm (for 100 µm tall) and 10 sec at 500 rpm followed by 30 seconds at 1500 rpm (for 200 µm tall), creating a uniform layer of photoresist. The photoresist was heated at 95ºC for 90 min (100 µm tall) or 65 min (200 µm tall). The photoresist was covered with a chrome mask containing an array of 49,000 200 µm squares and exposed to 700 mJ of UV light (100 µm tall) and 1100 mJ (200 µm tall), cross-linking the photoresist not covered by the mask. The templates were baked at 95ºC for 10 min (100 µm tall) or 12 min (200 µm tall). The templates were developed in 1-methoxy-2-propanol (developer fluid) for 15 min (100 µm tall) or 5 min (200 µm tall), leaving an array of 49,000 pillars. The templates were hard baked at 120ºC overnight and vapor silanized with 100 µL trichlorooctylsilane for 24 hours. The fabrication process is summarized in Figure 1.
Microwell Array Synthesis
PAA (polyacrylic acid) was spin coated onto a 50 mm x 75 mm glass slide at 2000 rpm for 30 sec. The PAA-coated glass slides were baked at 95ºC for 1 h. Uncured PDMS was poured onto the molds described above and cyclic olefin copolymer (COC) spacers were placed on the sides of the molds to control the thickness of the array. Each piece of COC was 100 µm thick and
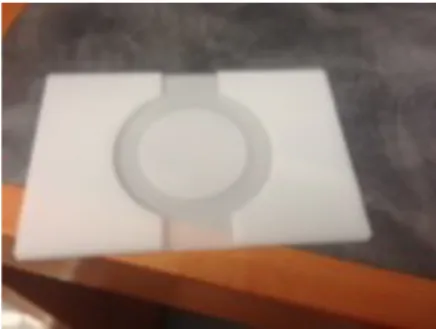
were stacked to achieve various thicknesses. The PDMS was degassed and the PAA-coated glass slides were placed PAA side down on the PDMS and clipped to the mold, sandwiching the PDMS to the thickness determined by the spacers. The arrays were baked at 95ºC for 20 min to cure the PDMS. The PAA-coated slides with PDMS arrays on top were separated from the molds and were covered with a solution of magnetic polystyrene in GBL. The arrays were degassed to draw the polystyrene solution to the bottoms of the well. The arrays were dipcoated in a solution of magnetic polystyrene dissolved in GBL, using the surface tension of the solution to pull off excess solution, leaving magnetic polystyrene only at the bottoms of the wells. After dipcoating, the solvent was removed by baking overnight at 95ºC. The glass slide-backed array was glued to a custom plastic cassette (Figure 2) using PDMS. The array glued to the cassette was released from the glass slide by dissolving the PAA in water. The production process is summarized below in Figure 3.
D
E
F
Figure 3. A summary of microwell array production. (A) The mold is coated with PDMS and sandwiched with a PAA-coated glass slide with COC spacers to determine thickness. (B) After curing, an array of microwells in PDMS is left. (C) The microwell array is then coated with magnetic polystyrene and (D) dip coated in magnetic polystyrene. (E) The solvent is baked off, leaving a magnetic plastic raft at the bottom of each well. (F) The array is then glued to a cassette and the PAA is dissolved to release the glass slide.
Microraft Release and PDMS Thickness Characterization
Thickness of the PDMS arrays was varied for the 200 µm x 200 µm x100 µm templates by using the COC spacers as described above. Array thicknesses that were studied were 100 µm, 200 µm, 300 µm, 400 µm, and 1,000 µm. Three arrays of each thickness were synthesized using the above protocol and were plasma oxidized for 5 min. The arrays were covered with 3 mL of RPMI cell culture media. The lid of a small petri dish was placed over the cassette and a torus-shaped magnet was placed on top of the lid. The array was placed on a custom-made acrylic holder and inserted onto the motorized stage of an Olympus MVX10 microscope. The stage was adjusted to view the array through the central hole of the magnet. Using a MATLAB program to control a stepper motor, a microneedle (12.5 µm wide at the tip, 150 µm wide at the base) was raised up, punctured the PDMS, and released the magnetic raft, which was collected at the lid of the petri dish by the magnet. The needle position on the screen was verified by marking on the computer screen where the needle punctured the PDMS and adjusting the stage until the image lined up with the desired release point. The distance travelled by the needle was increased by 0.1 mm until a raft was released. Ten rafts were released, skipping every other raft, and the number of punches required to release each raft was counted. Any additional raft releases were also noted. The same procedure was repeated twice with a 1 mm or a 2 mm increase in the needle travel distance. This was done in triplicate for each PDMS thickness. The needle steps used were 9.2 mm, 10.2 mm and 11.2 mm.
Centrifugation of T2 Cells
The 200 µmcube array template was selected for these experiments. The microwell arrays were fabricated using 300 µm-thick spacers.
T2 cells, a non-adherent cell line, were cultured in RPMI tissue culture media supplemented with 10% fetal bovine serum, penicillin (100 units/mL) and streptomycin (100 µg/mL). Cells were maintained at 37oC in 5% CO2. Cell concentration was
determined with a hemocytometer and cell viability was assessed with trypan blue stain. 3 mL of media containing 490,000 cells was added to the array to reach the target number of 10 cells per raft. Spin speeds and times utilized were: 50, 200, and 400 relative centrifugal force (RCF) for either 30 or
120 sec. The control followed the current protocol of simply letting the arrays sit undisturbed for 1 hour. A custom-designed cartridge insert for a 96-well plate centrifuge (Figure 4) was used to spin the cassettes. Triplicate trials were performed for each sample condition. After centrifugation, the media was immediately aspirated and replaced with media mixed with Sytox Green, an indicator of cell death. Three separate areas of each array were imaged utilizing bright field and fluorescent microscopy. The arrays were returned to the incubator and the same areas of the arrays were imaged 24 hours later. The rate of cell death and the density of cells per well was calculated immediately following centrifugation and after 24 hours to determine if the rate of cell death varied.
!
Mathematical Analysis
The standard error for all reported means was calculated based on a sample size of three. The data in all sections was analyzed using a student’s t-test to determine statistical significance (if P < 0.05).
The theoretical centrifugation rate was calculated according to the equation for spherical objects in solution being centrifuged:
5
!
In the above equation, vdrift denotes the speed at which the particles settle, ƿp denotes the density
of the particles, ƿ denotes the density of the solvent, R denotes the radius of the particles, gc
denotes the gravitational acceleration experienced, and ƞ represents the viscosity of the solvent. The viscosity of water was assumed for the media (8.90 x 10⁻⁴ Pa-s). The density of the solvent
was assumed to be the same as water: 1000 kg/m3. The density of the T2 cells was approximated
at 1025 kg/m3, the density of blood cells. Finally, the radius of the T2 cells was estimated to be
approximately 5 µm. The gravity experienced was the RCF setting multiplied by 9.81 m/s2. With
the known drift velocity and the centrifugation time known, the average distance traveled by the cells was calculated using:
!
Because the cells were mixed up before plating on the arrays, a uniform distribution of the cells in the 3 mL of media can be assumed. The area of the cassette reservoir (6.28 cm2) was then used
with the calculated distances traveled to determine how many mL of cells could reach the bottom in that centrifugation time. This fraction of the 3 mL was then multiplied by the theoretical density of the cells (10 cells per well) to calculate the theoretical density of cells per well that should be achieved.
!
Results
!
Microraft Release and PDMS Thickness Characterization
For the 100 µm thick arrays it was found that 2.43 ± 0.73 (n=3) needle punches of distance 9.2 mm were needed to release the raft. The average number of rafts released for this punch distance was 1.07 ± 0.07 (n=3) rafts. For a punch distance of 10.2 mm, 1.10 ± 0.10 (n=3) needle punches were needed to release the rafts. No accidental raft releases occurred for this group. For a punch distance of 11.2 mm, 1.03 ± 0.03 (n=3) needle punches were needed to release the rafts and for each needle punch, 1.03 ± 0.03 (n=3) rafts were released.
For the 200 µm thick arrays it was found that 2.10 ± 0.47 (n=3) needle punches of distance 9.2 mm were needed to release the raft. No accidental raft releases were observed. For a punch distance of 10.2 mm, it 1.47 ± 0.42 (n=3) needle punches were needed to release the rafts. No accidental raft releases occurred for this group. For a punch distance of 11.2 mm, 1.20 ± 0.15 (n=3) needle punches were needed to release the rafts while no additional rafts were released.
For the 300 µm thick arrays it was found that 2.37 ± 0.52 (n=3) needle punches of distance 9.2 mm were needed to release the raft. The average number of rafts released for this
vdrift =
2(ρp−ρ)
9η R
2
gc
punch distance was 1, with no accidental raft releases observed. For a punch distance of 10.2 mm, 1.10 ± 0.07 (n=3) needle punches were needed to release the rafts. The average number of rafts released per each desired raft was 1.10 ± 0.7 (n=3). For a punch distance of 11.2 mm, 1 needle punch was needed to release the rafts with no additional punches necessary. For each desired raft released, 1.23 ± 0.12 (n=3) rafts were released.
For the 400 µm thick arrays it was found that on average 2.63 ±
0.88 (n=3) needle punches of distance 9.2 mm were needed to release the raft. The average number of rafts released for this punch distance was 1 with no accidental raft releases observed. For a punch distance of 10.2 mm, 1.20 ± 0.06 (n=3) needle punches were needed to release the rafts. No accidental raft releases occurred for this group. For a punch distance of 11.2 mm, 1.07 ± 0.03 (n=3) needle punches were needed to release the rafts while for each desired raft released, 1.40 ± 0.25 (n=3) rafts were released.
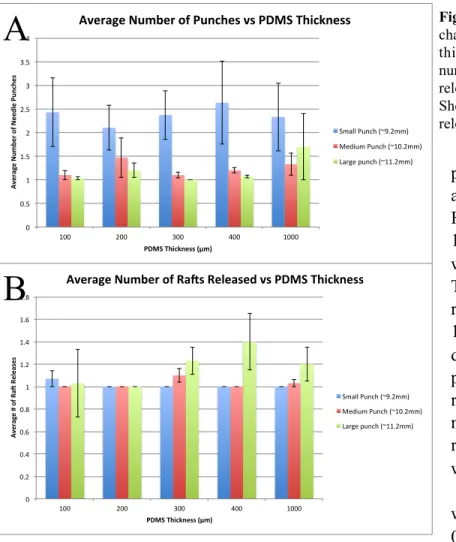
Finally, for the 1,000 µm thick arrays it was found that on average 2.33 ± 0.72 (n=3) needle punches of distance 9.2 mm were needed to release the raft. The average number of rafts released for this punch distance was 1, as no additional raft releases were observed. For a punch distance of 10.2 mm, 1.33 ± 0.24 (n=3) needle punches were needed to release the rafts. The average number of rafts released per desired raft was 1.03 ± 0.03 (n=3). For a punch distance of 11.2 mm, 1.70 ± 0.70 (n=3) needle punches were needed to release the rafts while for each desired raft released, 1.20 ± 0.15 (n=3) rafts were released. The results are summarized in Figure 5.
!
Centrifugation of T2 Cells
Characterization of the standard protocol of allowing the cells to sediment for 1 hour yielded a result of 6.42 ± 1.22 (n=3) cells per well with an increase in death rate after 24 hours of
0" 0.5" 1" 1.5" 2" 2.5" 3" 3.5" 4"
100" 200" 300" 400" 1000"
Av er ag e' N um be r'o f'N ee dl e' Pu nc he s' PDMS'Thickness'(μm)' Average'Number'of'Punches'vs'PDMS'Thickness' Small"Punch"(~9.2mm)" Medium"Punch"(~10.2mm)" Large"punch"(~11.2mm)" 0" 0.2" 0.4" 0.6" 0.8" 1" 1.2" 1.4" 1.6" 1.8"
100" 200" 300" 400" 1000"
Av er ag e' #' of 'Ra , 'Re le as es ' PDMS'Thickness'(μm)' Average'Number'of'Ra,s'Released'vs'PDMS'Thickness' Small"Punch"(~9.2mm)" Medium"Punch"(~10.2mm)" Large"punch"(~11.2mm)"
Figure 5. A summary of the raft release characteristics with respect to PDMS thickness. (A) Shows the average number of needle punches necessary to release a raft for each thickness. (B) Shows the average number of rafts released per each targeted raft.
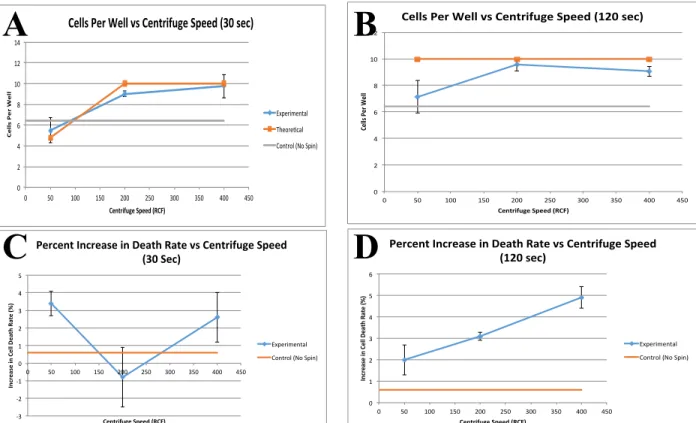
0.6% ± 0.7% (n=3). For a spin speed of 50 RCF for 30 sec, there were 5.50 ± 0.28 (n=3) cells per well and an increase in death rate of 3.4% ± 1.7% (n=3) was observed. For 120 sec at the same spin speed, 6.51 ± 0.49 (n=3) cells per well was observed along with a 2.0% ± 0.2% (n=3) increase in death rate. After centrifugation at 200 RCF for 30 sec, there were 9.00 ± 1.10 (n=3) cells per well. The increase in death rate was found to be -0.8% ± 1.4% (n=3). Centrifugation at 200 RCF for 120 sec yielded 9.58 ± 0.37 (n=3) and 3.1% ± 0.5% (n=3) for cells per well and increase in death rate, respectively. Centrifugation of the T2 cells at 400 RCF for 30 sec yielded 9.73 ± 2.54 (n=3) cells per well and an increase in death rate of 2.5% ± 1.2% (n=3). For the same centrifugation speed for 120 sec, 9.06 ± 3.11 (n=3) cells per well was observed alongside a death rate increase of 4.9% ± 1.3% (n=3). The results are summarized in Figure 6.
For the 30 sec centrifugations, the observed cells per well data did not deviate significantly from the theoretical projections (P=0.73). The same was observed for the 120 sec centrifugations (P=0.20). It was also found the increase in cells per well from 50 RCF for 30 sec and 200 RCF for 30 sec was significant (P=0.03). The same was observed for the increase from 50 RCF for 30 sec to 400 RCF for 30 sec (P=0.01). However, there was not a significant change between 200 RCF for 30 sec and 400 RCF for 30 sec (P=0.11).
For the 120 sec centrifugations, the observed cells per well data did not deviate significantly from the theoretical (P=0.20). For the same spin time, a significant increase in cells per well was observed with the increase from 50 RCF to 200 RCF (P=0.002), but not for the increases from 50 RCF to 400 RCF (P=0.23) and 200 RCF to 400 RCF (P=0.39).
!
Conclusions
!
Microraft Release and PDMS Thickness Characterization
From the above data, it was concluded that the use of thicker PDMS to construct the microwell arrays is viable up to 400 µm. However, this is only viable with respect to eventual automation for the 10.2 mm needle punch distance. For the 10.2 mm needle punch, the rafts were effectively released after a single punch and the risk of accidental microraft releases was small. Therefore, for PDMS arrays up to 400 µm thick, the viability of release remains intact. The 9.2 mm punch distance did not always puncture the PDMS completely enough to release the microraft with a single punch and averaged more than 2 attempts per trial. However, because the needle increases to 150 µm wide at its base, the 11.2 mm punch distance is also not viable, as it is wide enough to accidentally release adjacent microrafts if the punch is even slightly off center from the microraft. At this PDMS thickness, it was also noted that the overall quality of the imaging improved, as the focus of the array image was more uniform across the entire surface of the array. This is due to the glass slide backing keeping the array perfectly level and the thicker PDMS allowing for stronger support of the media. The thicker arrays are also easier to manufacture, as they are less likely to tear or be punctured accidentally. Therefore, the use of 300
µm and 400 µm PDMS with a 10.2 mm needle punch was optimal for releasing the rafts.
efficiency and reliability of an automated cell sorting technology, leading to improvements in research and diagnostics.
Centrifugation of T2 Cells
The faster centrifugation speeds did lead to more effective sedimentation of the T2 cells into the wells, as the results asymptotically approached the target number of cells per array with the increase in centrifugation speed. This is consistent with the theory behind centrifugation. No discernable trend was found for the increase in cell death rate after 24 hours (a marker of viability) for the studied speeds for 30 sec. However, there was a steady increase in the death rate for centrifugation with respect to an increase in centrifugation speed for 120 sec. Under these conditions, the cells are experiencing the forces for four times longer than in the 30 sec trials. This data indicates that the cells are capable of surviving and remaining viable for these increased forces for short periods of time but cannot remain viable when exposed to them for too long.
While these microdevices have been very successful at sorting and identifying cells, the time efficiency of the process was hindered by simply allowing the arrays to sit for an hour, reducing the amount of productivity these devices could achieve. However, centrifugation at 200 and 400 RCF achieved results closer to the target cell number per well than the sedimentation in less than one-hundredth the time as letting the cells sediment slowly. The increase in cell death
0" 2" 4" 6" 8" 10" 12" 14"
0" 50" 100" 150" 200" 250" 300" 350" 400" 450"
Cel ls%Per%Wel l% Centrifuge%Speed%(RCF)% Cells%Per%Well%vs%Centrifuge%Speed%(30%sec)% Experimental" Theore8cal" Control"(No"Spin)" 0" 2" 4" 6" 8" 10" 12"
0" 50" 100" 150" 200" 250" 300" 350" 400" 450"
Cel ls%Per%Wel l% Centrifuge%Speed%(RCF)% Cells%Per%Well%vs%Centrifuge%Speed%(120%sec)% 0" 1" 2" 3" 4" 5" 6"
0" 50" 100" 150" 200" 250" 300" 350" 400" 450"
In cr ea se (in (C el l(D ea th (Ra te ((%) ( Centrifuge(Speed((RCF)( Percent(Increase(in(Death(Rate(vs(Centrifuge(Speed( (120(sec)( Experimental" Control"(No"Spin)" !3# !2# !1# 0# 1# 2# 3# 4# 5#
0# 50# 100# 150# 200# 250# 300# 350# 400# 450#
In cr ea se (in (C el l(D ea th (Ra te ((%) ( Centrifuge(Speed((RCF)( Percent(Increase(in(Death(Rate(vs(Centrifuge(Speed( (30(Sec)( Experimental# Control#(No#Spin)#
A
B
!
!
!
C
D
rate after 24 hours is largely unaffected by these two centrifugation conditions. However, performing these centrifugations for 120 seconds did lead to a noticeable increase in cell death rate. Thus, centrifugation for 30 seconds achieved the desired cell density in a much more time-efficient manner while maintaining the viability of the cells to allow the cells to be sorted and experiments to be performed on them. This will improve the productivity of labs utilizing this technology and allow for faster experiments and diagnostics to improve research and diagnostics in general.
!
Acknowledgements
This project was supported by the Tom and Elizabeth Long Excellence Fund for Honors, administered by Honors Carolina.
!
References
1. Patel D., Separating Cells (Springer-Verlag, New York, 2001).
2. Shapiro H. M., Practical Flow Cytometry, 4th ed. (Wiley-Liss, New York, 2003).
3. Kemshead J. T. and Ugelstad J., Mol. Cell. Biochem. 67, 11 (1985).10.1007/BF00220980 4. Gach P. Isolation and manipulation of living adherent cells by micromolded magnetic rafts.
Biomicrofluidics. 2011-09;5:32002-3200212.