Improving the Hepatitis B Birth Dose Rate at UNC Hospitals
By
Susan A. Klodnicki
A Master’s Paper submitted to the faculty of
the University of North Carolina at Chapel Hill
in partial fulfillment of the requirements for
the degree of Master of Public Health in
the Public Health Leadership Program
Chapel Hill
2014
_____________________________________
/ Advisor
_____________________________________
Date
_____________________________________
/ Second Reader
_____________________________________
i
Abstract
Introduction:
Re-emergence of vaccine-preventable diseases has become a public health problem in the United States. Vaccine refusals are now a common occurrence for many reasons and leave populations susceptible to infectious disease. The purpose of this study is to examine the immunization rate of one specific childhood vaccine, the Hepatitis B birth dose given prior to discharge from the hospital, at UNC Hospitals in Chapel Hill, North Carolina, and the patient and provider perceptions surrounding it, in order to suggest future quality improvement measures at a hospital level for improving immunization rates.
Methods:
The first part of this study consisted of a retrospective chart review of all births at UNC Hospital for the first quarter of 2014. I collected data on Hepatitis B vaccination, mother’s Hepatitis B status, provider team, and other demographics in order to estimate the birth dose immunization rate as well as examine specific characteristics of vaccine refusers. The second part of this study was a small face-to-face interview project in which I spoke to patients and providers about their views and practices on the Hepatitis B birth dose using a survey I developed to administer in the newborn nursery at UNC Hospitals. I synthesized data from both the chart review and interviews to suggest policy changes.
Results:
I reviewed chart data from 722 births in the first quarter of 2014 and revealed a Hepatitis B birth dose refusal rate of 18.0% at UNC Hospitals. Infants who did not receive the birth dose before discharge were more likely to have a white, slightly older mother and private insurance than were those who did receive the vaccine inpatient. In the chart data, patients served by private family medicine providers and Chapel Hill Children’s Clinic had the highest refusal rates of receiving the vaccine while the infants were still inpatient. The interviewed patients cited health and prevention as the most important reason for Hepatitis B vaccination, followed in frequency of mention by recommendations from their health care provider. Waiting to get the vaccine in the outpatient setting was the most frequent reason for inpatient refusal. Individual providers have varying methods to approach the birth dose with patients, resulting in the inconsistent refusal rates across specialties.
Conclusion:
ii
Acknowledgements
Thank you to my advisor and teacher, Dr. Sue Tolleson-Rinehart, for providing guidance
and enthusiasm throughout my year of studies at UNC.
Thanks to Dr. Carl Seashore for providing insight and guidance in my practicum work,
and for preaching the importance of vaccination in his patients.
Thanks to Dr. Anthony Viera and Dr. Russ Harris for contributing to my background
knowledge in prevention in public health and critical appraisal skills.
iii
Table of Contents
Abstract……….……i
Acknowledgements………..ii
Table of Contents……….iii
List of Tables and Figures……….iv
Introduction……….1
Background and Significance………2
Methods………...….4
Findings: Chart Review, Parent Interviews and Provider Perspectives Converge
on Areas for Improvement..………7
Conclusion………15
References………..………..17
Tables………...………..19
Figures………..………..23
Appendix A, Limited Systematic Review……….…..30
iv
List of Tables and Figures
Table 1……….19
Table 2……….20
Table 3……….……....21
Table 4……….…..…..22
Figure 1……….……..23
Figure 2……….……..24
Figure 3……….……..25
Figure 4……….……..26
Figure 5……….……..27
Figure 6……….……..28
1
Introduction
Last year, 189 cases of measles were reported in the United States, over three times the
average 60 cases typically seen each year and the second largest number since the year 2000,
when measles was considered “eliminated” from the country (1). In 2010, the state of California
reported 9120 cases of pertussis, or whooping cough, the most in one year since 1947. Study of
the outbreak region revealed clustering of nonmedical exemptions, or refusals for some reason
other than a medical condition, to be one of many contributing factors (2). In California and other
states, refusal rates have been rising over the past few years (3). These data show a disturbing
trend that will ultimately lead to more outbreaks of easily-prevented communicable diseases in
the United States.
One reason for an increase in refusals is that since vaccination has become widespread,
infectious disease rates have plummeted. Most people now have never encountered measles or
polio and have forgotten the severity of vaccine-preventable diseases (4). The media and
pop-culture views of vaccines have become more prominent than is the evidence-based medical
information provided to patients at the physician’s office. Fear of the vaccine has now
outstripped fear of the disease. These themes apply to many vaccines, especially those given to
young children. Mothers strive to do what is best for their children, and, unfortunately,
misinformation and fear can lead to refusal of vaccinations that are shown to protect the child
from disease. This is a public health problem that we see unfold right from the very beginning,
2
Background and Significance
Hepatitis B is blood-borne and sexually transmitted virus that can be transmitted to an
infant vertically, from the mother during birth, or horizontally, through household or environment
exposure. Although transmission rates are highest in adults, HBV is a serious matter during
infancy because about 90% of children who contract HBV in their first year of life will go on to
develop chronic infection (5). Patients who have chronic HBV infection may go on to develop
later complications of liver failure or cancer.
With the goal of decreasing the burden of disease and lowering transmission rates of
HBV, the Advisory Committee on Immunization Practices (ACIP) presented new guidelines in
2005. To prevent perinatal and early childhood disease, the guidelines include this
recommendation: “administer a birth dose of hepatitis B vaccine to medically stable infants who
weigh >2,000 g and who are born to HBsAg-negative mothers” before hospital discharge (6).
This recommendation is supported across specialties and endorsed by the American Academy
of Pediatricians, the American Academy of Family Physicians, and the American College of
Obstetricians and Gynecologists. Despite the time elapsed since the updated recommendation,
the Hepatitis B birth dose rate in the United States was estimated to be only 64.1% in 2010 (7).
As a country, we have a long way to go to achieve the Healthy People 2020 goal of 85% birth
dose immunization (8).
Many variables explain the low Hepatitis birth dose rate, and hospital policy is one of
them. Some hospitals simply do not have a policy to offer HBV immunization to all newborns
prior to discharge (9). Many providers believe their patient population to be low risk (10) and
consequently place little importance on the birth dose when they plan on providing a dose at the
two month visit. However, risk factors for HBV infections cannot be identified in more than 30%
3 have shown that those patients who receive the Hepatitis birth dose are more likely to complete
the HBV series on time, by age 19-35 months (12) as well as to stay up-to-date on other
childhood vaccines (13). To acknowledge the hospitals and birthing centers that succeed in
achieving a high birth dose rate (≥ 90%), the Immunization Action Coalition (IAC) awards the
distinction of “Hepatitis B Birth Dose Honor Roll” (14).
Some vaccine studies examine demographic patterns and reasons for vaccine refusal in
order to focus efforts on that specific population. Maternal characteristics of high educational
level and high income were shown to be associated with refusal of the HBV birth dose (9). Data
from the National Immunization Survey showed that children below the poverty level were
actually more likely to receive the birth dose than were children above the poverty level (7).
These demographics reflect those found in studies that examined parent demographics of other
childhood vaccinations as well (15). When asked for the reason for childhood vaccination
refusals, parents acknowledged concern over safety of the vaccine as the primary factor
(15-17). Regardless of vaccine acceptance or refusal, most parents found vaccine information from
their physician to be credible and valuable, and hesitant parents often chose to vaccinate after
having an open discussion with their child’s physician (16). These themes and demographic
patterns associated with vaccine refusal are potential avenues at which to target future
interventions to increase vaccination coverage.
My quality improvement study was designed to examine the perinatal Hepatitis B
vaccination rate at UNC Hospitals in two ways – first, through a retrospective chart review that
allows me to also identify demographic patterns of refusal, and second, through interviews with
patients and providers that provide insight into ideas and perceptions about the birth dose. The
information I collected and present here is meant to serve as a stepping stone toward improving
4
Methods
Data Collection
This study comprises two parts – Part A, a retrospective chart review of births at UNC
Hospitals and Part B, interviews of patients’ caretakers (almost entirely their parents) as well as
providers at UNC Hospitals. From here forward these parts will be addressed separately.
Part A: Retrospective Chart Review
The primary purposes of this part of the study were to estimate the Hepatitis B
vaccination rate of infants prior to hospital discharge at UNC Hospitals and observe patterns in
the demographics of those who refused the vaccine. I reviewed charts of all births in the first
quarter of the year, which included births from December 30, 2013 to March 29, 2014. From the
charts, I extracted data on Hepatitis B vaccination, mother’s Hepatitis B status, hospital care
team, particularly the dominant specialty of the team (e.g. Family Practice, Pediatrics, or
others), and other demographic information (see Chart Extraction Tool in Appendix B). I
recorded data without identifiers in order to preserve patient anonymity.
Part B: Interviews
I conducted in-person interviews to assess patient and provider perceptions of
perinatal Hepatitis B vaccination. I conducted them between April 28, 2014 and May 30, 2014,
meaning that none of the parent/caregivers I interviewed were a part of the chart review study.
Patient interviews took place in the patient rooms located in Newborn Nursery at UNC
Hospitals. I selected respondents by identifying English-speakers on the patient whiteboard,
excluding the patients from Piedmont Health Services, a federally qualified health center that
serves a large Hispanic population. Upon entering a room, I excluded the patient if I found she
5 also excluded a couple of interviews during which the parent/caregiver did not appear to
understand what I was asking or responded to a question in an unclear manner. Interview
questions addressed importance of vaccine, reasons for refusal, and provider team (see
Parent/Guardian Interview Protocol in Appendix B).
I had originally intended to conduct provider interviews in conjunction with patient
parent interviews. However, the nature of hospital-based care made it too difficult to obtain
accurate accounts of each patient-provider interaction. Most of my provider interviews, thus,
were brief exchanges with interns and attending physicians in the newborn nursery. In order to
gain a more comprehensive knowledge of viewpoints, I contacted some physicians via phone or
e-mail to learn their thoughts and ideas about perinatal Hepatitis B vaccination. This allowed me
to interview representatives from both family medicine and pediatrics.
I submitted both the chart review and interview portions of the study to the UNC
Institutional Review Board, who ruled this project “not human subjects research” because of its
6 Analysis Plan
Part A: Retrospective Chart Review
I reviewed the charts for a total of 727 births that took place in the first quarter of
2014. Five infants were stillbirths or passed away shortly after birth and were excluded from
analysis, leaving a total of 722 live infants the charts of whom I could analyze. I operationalized
ethnicity, vaccination status, provider group, and insurance type variables by assigning numeric
codes in order to perform statistical analysis. I sorted and grouped the data according to
vaccination acceptance/refusal. I used Microsoft Excel to perform simple statistics on each
group and the entire birth cohort overall. I also used the Zip Codes of refusals to create a
Geographic Information System (GIS) map to show distribution of refusers across geographical
regions.
Part B: Interviews
I conducted a total of 106 patient interviews over the given dates. Interview data
were organized in Microsoft Excel according to date of interview. I operationalized the variables
vaccination status, reason for refusal, importance of vaccine, and provider team in simple
ordinal or binary codes to allow for easy analysis, and I then performed simple statistical
calculations in Excel. I was informed that after an educational discussion with one family, the
family then chose to vaccinate their child in the hospital. Because I was analyzing under an
Intention to Treat strategy, I kept this family in the “refusal” category.
I recorded other information from open-ended questions in the provider
interviews in a separate document with the intention to use these data as an illustrative
7
Findings: Chart Review, Parent Interviews and Provider Perspectives
Converge on Areas for Improvement
Part A: Retrospective Chart Review
My review of all births at UNC Hospital in the first quarter of 2014 revealed an overall
vaccination refusal rate of 18.0% (See Table 1) among the 722 infants who survived at least to
time of vaccination for whom I had chart data. The birth cohort was ethnically diverse, with
42.8% white and 19.3% African American infants; the remaining infants were coded in the chart
by health care providers in the categories of “Asian”, “other”, and “unknown”. The average age
of the mother was 29.5 years, with a range from 15 years to 45 years. Insurance type was split
almost evenly between public and private, with slightly more patients having public insurance
(52.8%). The vast majority of infants were cared for by the UNC Pediatrics provider team
(78.4%), followed by Family Medicine (14.3%), Piedmont Health Services, and the private
providers, including private family medicine practices (referred to as External FM in chart data)
and Chapel Hill Children’s Clinic (CHCC).
Upon examination of vaccine acceptances and refusals, I observed the shifts in
demographics between these two groups that the literature suggests. The refusal group was
made up of patients with older, predominantly white mothers who were more likely to have
private insurance (see Table 2). This pattern has been observed in previous vaccination refusal
studies (15). The source of the pattern is not particularly clear, but women with higher
socioeconomic status and education level may have access to and use resources outside of
physician visits (e.g. social media, internet, etc.), to learn about vaccines. These searches
inevitably lead to personal accounts of health problems that are attributed to vaccines and faulty
information from anti-vaccine groups. Concerned mothers who come across these sites may not
8 If we accept private insurance as a rough proxy for socioeconomic status, it follows that the
mothers of higher socioeconomic status may be overrepresented among refusers, although the
relationship between insurance status and wealth is not perfect. White mothers are also a much
larger proportion of the refusal group than that of the overall cohort, and each of the other
ethnicities are concomitantly a smaller proportion of the refusal group than of the overall cohort,
although each change in proportion varies in magnitude.
The chart review also shows differences by provider team. Most infants are cared for by
the UNC Health Care Pediatrics service after delivery. However, several other groups care for
infants as well, including the UNC Health Care Family Medicine service, Piedmont Health
Services (PHS), the federally qualified health center, Chapel Hill Children’s Clinic (CHCC), a
private practice, and a number of external (non-UNC Health Care) private family medicine
physicians. Vaccination refusals are not evenly distributed within or across these different
provider teams, and this variation indicates that the role of the provider and how he or she
approaches the Hepatitis B vaccination influences the vaccination rate. For example, virtually all
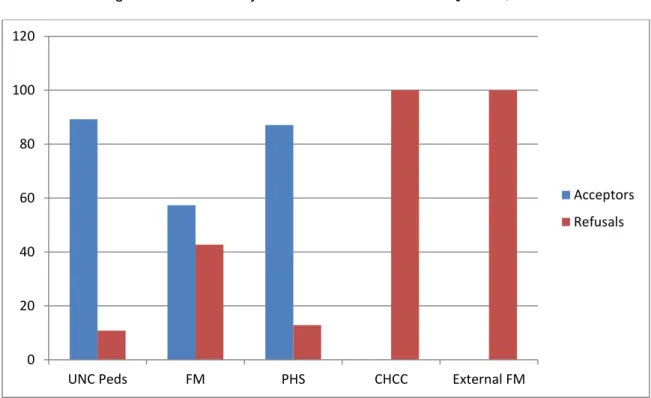
CHCC and external FM patients appear to be vaccination refusals (see Figure 1). The results of
the provider interviews (discussed at greater length below) suggests that parents receiving care
from these private providers are told they can receive their first dose of Hepatitis B vaccination
at their first outpatient visit, and they are told that this is standard protocol. My research cannot
ascertain whether the primary reason for this practice is private providers who are not quite up
to date on CDC recommendations, a preference for directing vaccination payment to their own
practice, some combination of these, or some other reason entirely.
It is also difficult to blame refusals on specific services, as their numerous individual
providers may have different practice preferences. Just one or two high-volume providers with
high refusal rates may skew a whole service’s distribution of vaccinations. This could very well
9 from the private groups whose representation was greater in the refusal group than in the
original cohort, but the data don’t permit this kind of analysis at the level of the individual
provider.
Number of refusals may also be a reflection of the patient population served by the
provider. PHS patients are part of an underserved population, including a large number of
Hispanics and other immigrants. Typically, as seen in practice and studies (18), these patients
refuse vaccination infrequently. One reason for this observation may be that, culturally, the
doctor-patient relationship is more paternalistic in these populations. Americans value autonomy
and often do not hesitate to challenge a recommendation, but many other cultures may view this
practice as disrespectful and, consequently, accept physicians’ plans without pushback.
In order to assess the geographical distribution of refusals, I used Google Maps to
create a GIS map. Originally I was hoping to find “hotspots” of high refusal numbers in
geographical areas known to be of higher education and socioeconomic status. However, I
found a more concentric pattern of refusal numbers surrounding the location of UNC Hospital.
This is to be expected, as the population of patients seen at UNC Hospital is most dense in the
geographically near regions and sparser as you travel farther away. But it is also true that the
geographic area around UNC Hospitals is one of considerable affluence and educational
attainment, precisely those characteristics associated with refusal.
Part B: Interviews of Parents and Providers
Parents and Caregivers
I used my survey to interview caregivers, most of whom were parents, of the infants.
Much of the interview data is a compilation of what multiple caregivers/parents of a single infant
provided. These interviews produced a 19.8% refusal rate, similar to the 18.0% I found in my
10 respondents could be that I excluded non-English speakers and all PHS patients, patients who
typically accept Hepatitis B vaccination as observed in practice, from the interview sample. I
also included “Pending” vaccinations as “vaccine acceptances” in my interview sample because
these parents were merely waiting on nurses to administer the vaccine that had already been
ordered by the physician.
I asked why the Hepatitis B vaccination was important or not important for their child,
and parents responded with a variety of answers (see Table 3). The most common
pro-vaccination answer by far was for the health of their child and/or prevention of Hepatitis B
(59.4%). The second most common answer was that the vaccine was recommended and/or that
it was part of normal protocol for child care (18.9%). Many of these parents had previous
children who had received the vaccine and planned to vaccinate their newborn in the same way.
Some parents understood the Hepatitis B vaccine to be normal procedure for newborn care or
something to check off before hospital discharge. Surprisingly, a large number of parents cited
only the doctor’s recommendation, without any reference to prevention or health, as the reason
the vaccine was important. This finding suggests that physician discussion and recommendation
is influential, and making use of physician influence could be a potential focus area for further
improvement. Provider recommendation and communication is cited as an important factor of
vaccine acceptance in former studies as well (16, 17). Other less common reasons for
importance cited by parents include protection of society and “other”, which included the overall
importance of all vaccines.
I asked all respondents why the Hepatitis B vaccine was or was not important for their
child. A substantial minority of all respondents did not know why the vaccine is important (8.5%).
This finding was unexpected, and shows another area with room for improvement. It is unclear
whether these patients responded in this manner because they might have felt as if they were
11 importance of vaccines because providers had not offered adequate discussion, or because
parents had low health literacy, or for other reasons. Parents who believed the vaccine was not
important said that it was unnecessary and/or the child had a low risk for disease (7.5%) and
that the vaccine was not safe or contained harmful ingredients (2.8%). Some parents elaborated
on their belief that their child was low-risk by saying that the child was not sexually active, using
IV drugs, or going to daycare in the near future.
Most “refusers” could perhaps better be characterized as “postponers.” In order to
maintain open lines of communication and obtain frank responses, I very carefully assured
several hesitant parents that I was interested in their perceptions and was not there to judge
their actions or change their mind. I simply wanted to have an open conversation, and after
hearing what they had to say, I answered questions and referred them to the cdc.gov resources.
Of the refusers, most parents did plan to get the Hepatitis B vaccination for their child, but
preferred to wait until an outpatient visit with their pediatrician (47.6%). This decision to wait was
greatly influenced by the practice preferences of their provider (discussed below). The next
most common reason for refusal was that their child was too young or small or had already
undergone many “pokes” in the hospital (28.6%). Others believed the vaccine was unnecessary
or said the child did not have a risky lifestyle (19.0%). Others were concerned about dangerous
vaccine ingredients (14.3%), or they had spiritual/religious/personal reasons not to vaccinate
(9.5%). Almost 5% (4.8%) gave other reasons. Some of the parents who declined Hepatitis B
vaccination because of their child’s lack of risky lifestyle affirmed that they intended to get the
other standard childhood vaccines. This reaction may be comparable to what we see now with
parents who refuse the HPV vaccination for adolescents.
After examination of all parent interview data, I was able to determine estimates of
provider team care of patients. UNC Pediatrics accounted for 72.6% of patients, UNC Family
12 numbers, although they did not include PHS or the non-UNC private Family Medicine
practitioners, resembled the chart review numbers of 78.4%, 14.3%, and 1.5% respectively.
Family Medicine and CHCC appeared in larger proportions in this smaller interview sample size.
This shift in representation of provider groups likely contributed to the slightly higher refusal rate
(discussed above), as both Family Medicine and CHCC contributed higher refusal rates. Upon
stratification by provider team, CHCC showed the highest refusal rate with essentially 100% of
the CHCC parents eschewing the Hepatitis B vaccine prior to discharge (see Figure 6). In
talking to these patients, I was able to clarify that the CHCC providers recommend that their
patients wait until an outpatient pediatrician visit to receive the vaccine. As I noted above, I
cannot ascertain the reasons for this practice preference, but they could include that providers
do not know the updated CDC recommendation (or do not think it is important), the practice
would like to maintain their patients’ vaccination records all in one place, or perhaps the practice
would like to benefit financially from delaying this vaccine and being able to charge for it during
an office visit.
UNC Family Medicine ranked next in refusals at 31.8%, but the large UNC family
medicine service varies in its preferences from provider to provider. Although I did not analyze
the data according to individual provider, I noticed distinct patterns during the chart review that
reflected a strong correlation between individual provider and whether the patient received the
vaccine inpatient. Here again we see that individual practice and procedure strongly affects
whether patients defer vaccination to the outpatient setting. Overall, UNC Pediatrics had the
lowest refusal rate at 11.7%. In speaking to numerous providers, I found that many, if not most,
providers (including nurse practitioners, residents, and attendings) presented the vaccine as a
standard procedure before discharge and were less likely to present parents with later
13 vaccination to the outpatient setting. Most of their refusals were for the other reasons discussed
above.
Although the data become somewhat confusing when stratified and examined, we
should keep in mind that the largest group of “refusers”, 47.6%, did intend to accept the vaccine
in the outpatient setting.
Although the UNC Pediatrics team had the lowest refusal rate, they still contributed the
largest proportion of overall number of refusals simply because they were the providers of care
to the largest proportion of newborns (see Figure 7). This finding reminds us that even if we
focus future quality improvement efforts on the teams with higher refusal rates, the whole
system may benefit from a hospital-wide change that affects all teams.
What surprised me most about refusal data was that patients born in the same hospital
received different standards of care. Who took care of the patient greatly influenced whether
that infant received the CDC-recommended perinatal dose prior to discharge. The typical
anti-vaccine concerns over artificial ingredients or dangers to health were not absent from these
data, but they made up a much smaller proportion of the refusers than I had expected. This
finding that providers may matter more than does anything else is especially important because
most patients do not know the CDC recommendation or the implications of NOT receiving the
vaccine inpatient, and leaving their child at risk, while the payment for eventual vaccination is
going to a different provider.
Providers
Talking to providers enabled me to gather information on current perinatal Hepatitis B
vaccination practices. I began by trying to complete the Provider Protocol interview (found in
Appendix B) but quickly realized the difficulty of keeping up with individual patient interactions
14 quickly changed my methods to instead talk to a variety of providers in person, over the phone,
or through e-mail. I asked them how they approach perinatal Hepatitis B vaccination with their
patients and what can be done to improve the vaccination rate. Summary excerpts of the results
are found in Table 4.
Although I did not have a large number of provider perspectives, the ones I did obtain
somewhat reflected the data discussed above. The pediatricians in general approached
vaccination more as a normal part of standard infant care protocol to be done prior to discharge,
while the family doctors presented vaccination in the outpatient setting as a noninferior option.
However, some pediatricians made the point that outpatient vaccination was not a big problem if
the patient was responsible and had good follow-up care. Representatives from both pediatrics
and family medicine came up with vaccination rate improvement ideas, including having a
discussion about concerns and vaccine importance with parents, and making the vaccination an
opt-out instead of an opt-in or creating a quality metric in the electronic medical record on a
15
Conclusions
My study leads me to three main areas of improvement for UNC Hospital Hepatitis B
birth dose rate: Emphasizing the importance of provider recommendation; Offering an
explanation to parents of risks to the child who does not receive the vaccine; and targeting
providers with low birth dose rates for further education about current recommendations. Both
the results of my study and the literature point to the importance of provider recommendation of
the vaccine as a large factor in parents’ decision-making. Physicians may not fully understand
the effect they may have by simply recommending the vaccine to patients personally. This is an
easy, non-time-consuming change that could make a difference. Explaining the child’s risks of
contracting Hepatitis B if left unvaccinated is more time-consuming but equally as important. At
UNC Hospitals, a number of interviewed patients did not know why the birth dose was
important, even after being given the CDC vaccine information sheet. Parents’ lack of
understanding could emerge from many different causes, as I discussed above, but this
observation demonstrates an opportunity for providers to step in and make sure patients know
the risks of not vaccinating. This explanation is also very important for parents who believe their
child is not at risk during infancy.
Finally, targeting specific providers and services that have lower in-hospital acceptance
rates, including certain family medicine providers and private providers, would likely improve the
overall vaccination rate. Because most of the “refusals” seen by these providers appear to be
“postponers” instead – those who are deferring vaccination to an outpatient visit, it would be
useful to learn the providers’ reasons for this suggestion and proceed from there. It is possible
that some providers simply may not realize the CDC recommendation change. In addition, using
other quality improvement methods, such as tracking and displaying birth dose rates by various
hospital services, and displaying criteria to reach the IAC’s Birth Dose Honor Roll, may also
16 On a hospital level, changing the Hepatitis birth dose to an opt-out instead of an opt-in
through EMR orders may also help improve rates, as it has done in previous studies (19). As it
stands now, providers must add the birth dose as an order instead of having it as part of the
standard set of newborn orders that are automatically added. Although having the order as part
of the standard order set may not specifically facilitate patient-doctor communication about the
vaccine, it would likely increase coverage rates.
The goal of increasing the perinatal Hepatitis B vaccination rate is challenging but
attainable. With the cooperation and dedication of the providers at UNC Hospitals’ newborn
nursery, we may soon join the ranks of other hospitals on the Birth Dose Honor Roll in
17
References
1. Centers for Disease Control and Prevention 2014;Pages on February 17, 2014.
2. Atwell JE, Van Otterloo J, Zipprich J, Winter K, Harriman K, Salmon DA, et al.Nonmedical vaccine exemptions and pertussis in California, 2010. Pediatrics. 2013;132(4):624-30. 3. Omer SB, Pan WK, Halsey NA, Stokley S, Moulton LH, Navar AM, et al.Nonmedical
exemptions to school immunization requirements: secular trends and association of state policies with pertussis incidence. Jama. 2006;296(14):1757-63.
4. Chen RT, Hibbs B. Vaccine safety: current and future challenges. Pediatr Ann. 1998;27(7):445-55.
5. Immunization Action Coalition. Hepatitis B: What Hospitals Need to Do to Protect Newborns; 2013.
6. CDC. A Comprehensive Immunization Strategy to Eliminate Transmission of Hepatitis B Virus Infection in the United States. MMWR. 2005;54(16):1-23.
7. CDC. National and State Vaccination Coverage Among Children Aged 19-35 Months - United States, 2010. MMWR. 2011;60(34):1157-63.
8. US Department of Health and Human Services 2010;Pages. Accessed at US Department of Health and Human Services at www.healthypeople.gov/2020/default.aspx on June 23, 2014 2014.
9. O'Leary ST, Nelson C, Duran J. Maternal characteristics and hospital policies as risk factors for nonreceipt of hepatitis B vaccine in the newborn nursery. Pediatr Infect Dis J.
2012;31(1):1-4.
10. Jiles RB, Daniels D, Yusuf HR, McCauley MM, Chu SY. Undervaccination with hepatitis B vaccine: missed opportunities or choice? Am J Prev Med. 2001;20(4 Suppl):75-83. 11. Ocama P, Opio CK, Lee WM. Hepatitis B virus infection: current status. Am J Med.
2005;118(12):1413.
12. Yusuf HR, Daniels D, Smith P, Coronado V, Rodewald L. Association between administration of hepatitis B vaccine at birth and completion of the hepatitis B and 4:3:1:3 vaccine series. Jama. 2000;284(8):978-83.
13. Mennito SH, Darden PM. Impact of practice policies on pediatric immunization rates. J Pediatr. 2010;156(4):618-22.
14. Immunization Action Coalition 2013;Pages on June 25, 2014 2014.
18 16. Fredrickson DD, Davis TC, Arnould CL, Kennen EM, Hurniston SG, Cross JT, et al.Childhood
immunization refusal: provider and parent perceptions. Fam Med. 2004;36(6):431-9. 17. Salmon DA, Moulton LH, Omer SB, DeHart MP, Stokley S, Halsey NA. Factors associated with
refusal of childhood vaccines among parents of school-aged children: a case-control study. Arch Pediatr Adolesc Med. 2005;159(5):470-6.
18. Freed GL, Clark SJ, Butchart AT, Singer DC, Davis MM. Parental vaccine safety concerns in 2009. Pediatrics. 2010;125(4):654-9.
19
Tables
Table 1: Population Characteristics of Births at UNC Hospital in the First Quarter of 2014
Characteristic Percentage
(n = 722)
Hep B Vaccination Accept Refuse
82.0 18.0
Ethnicity of Infant White African American
Asian Other Unknown
42.8 19.3 4.2 30.1
3.9
Age of Mother (avg) 29.5 yrs
Provider Team UNC Pediatrics Family Medicine
PHS CHCC External FM
78.4 14.3 4.3 1.5 1.5
Insurance Public Private
52.8 47.2
SOURCE: chart abstractions (by S. Klodnicki) of all births surviving to vaccination at UNC Hospitals, 1Q 2014. 5 deceased infants excluded from table. PHS = Piedmont Health Services; CHCC = Chapel Hill Children’s
20 Table 2: Population Characteristics of Vaccine Refusals and Acceptances at UNC
Hospitals in the First Quarter of 2014
Refusals (n = 131) Acceptances (n = 591)
Ethnicity of Infant White African American Asian Other Unknown 72.5% 13.0% 1.5% 9.9% 3.1% 36.4% 20.5% 4.7% 34.5% 3.9%
Age of Mother (avg) 31.2 yrs 29.1 yrs
Provider Team UNC Pediatrics Family Medicine PHS CHCC External FM 46.6% 33.6% 3.1% 8.4% 8.4% 85.4% 10.0% 4.6% 0.0% 0.0%
Insurance Public Private
29.0% 71.0%
58.0% 42.0%
SOURCE: chart abstractions (by S. Klodnicki) of all births surviving to vaccination at UNC Hospitals, 1Q 2014. 5 deceased infants excluded from table. PHS = Piedmont Health Services; CHCC = Chapel Hill Children’s
21 Table 3: Vaccine Receipt, Importance, and Provider Team: Interviews of Parents at UNC
Hosptals Newborn Nursery
Category Percent (number)
Received Vaccine No Pending* Yes 19.8 (21) 17.9 (19) 62.3 (66)
Importance of Vaccine**
Why Vaccine is Important
Health/prevention
Recommended/normal protocol Protect society
Other
Unable to answer (“not sure”)
Why Vaccine is NOT Important
Unnecessary/low risk of disease Vaccine not safe
Other No answer 59.4 (63) 18.9 (20) 2.8 (3) 6.6 (7) 8.5 (9) 7.5 (8) 2.8 (3) 0.9 (1) 1.9 (2) Provider Team UNC Pediatrics Family Medicine CHCC No answer 72.6 (77) 20.8 (22) 4.7 (5) 1.9 (2)
SOURCE: Parent/Caregiver interviews and provider interviews, all conducted by author, from April to May 2014 at UNC Hospitals Newborn Nursery.
Parent/caregiver interviews n = 106
*Patients were waiting on vaccine to be given (had already been ordered by physician) **Patients could choose more than one category
22
Table 4: Provider Interview Data
Open-ended responses about current practices (How do you approach perinatal Hep B vaccination?)
Some physicians ask (about the vaccine) and if the patient says no, they move on.
– Med/peds Intern
Tell the patient “Here we give the Hep B vaccine…” and normalize instead of giving the choice.
- Pediatrics Intern
Can give the vaccine in hospital or outpatient, especially if parent has concerns. Make routine.
– 3rd
yr Family Medicine Resident
Usually broach the subject at the first meeting (mother’s admission) and lump together with other normal things.
- Pediatrics Attending
(I) somewhat discourage the patient from getting the vaccine inpatient and do not see the purpose in giving the vaccine early to reliable patients. I offer/recommend to wait to the 2 month check-up unless parents have chronic Hep B or high-risk behavior. Patients elect to get the vaccine inpatient about 50% of the time. I’m open to changing my practice if there is overwhelming evidence but right now I don’t see a pressing need to do so.
- Family Medicine Attending
Open-ended responses about ideas for improvement
If patient refuses vaccine, the provider should find out why and explain the importance. If patient is deferring vaccine and planning to follow up with outpatient pediatrician, it’s not a big problem.
– Med/peds Intern
Make vaccination opt-out instead of opt-in (in EMR ordering system).
– 3rd
yr Family Medicine Resident
Make Hep B vaccination a quality metric in EPIC.
- Pediatrics Attending
23
Figures
Figure 1: Refusals By Provider Team for the 1st Quarter, 2014
SOURCE: chart abstractions (by S. Klodnicki) of all births surviving to vaccination at UNC Hospitals, 1Q 2014
FM = Family Medicine; PHS = Piedmont Health Services; CHCC = Chapel Hill Children’s Clinic, private pediatric office (not part of UNC); External FM = external family medicine (not part of UNC)
0 20 40 60 80 100 120
UNC Peds FM PHS CHCC External FM
Acceptors
24 Figure 2: GIS Map of Hepatitis B Birth Dose Refusals at UNC Hospital, 1st Quarter 2014
SOURCE: chart abstractions (by S. Klodnicki) of all births surviving to vaccination at UNC Hospitals, 1Q 2014
Each marker represents 1 zip code
1-2 Refusals
3-7 Refusals
8+ Refusals
25 Figure 3: GIS Map of Hepatitis B Birth Dose Refusals at UNC Hospital, 1st Quarter 2014,
Focused on UNC Hospital
SOURCE: chart abstractions (by S. Klodnicki) of all births surviving to vaccination at UNC Hospitals, 1Q 2014
Each marker represents 1 zip code
1-2 Refusals
3-7 Refusals
8+ Refusals
26
0 5 10 15 20 25 30 35 40 45 50
Reasons for Refusal
Figure 4: Patient Interview Reasons for Hepatitis B Birth Dose Refusal By Percentage
27 Figure 5: Provider Teams of All Parents/Caregivers Interviewed
SOURCE: Parent/Caregiver interviews and provider interviews, all conducted by author, from April to May 2014 at UNC Hospitals Newborn Nursery.
Provider Teams (All Parent/Caregiver
Interviews), n = 106
UNC Pediatrics
Family Medicine
CHCC
28 Figure 6: Refusals and Acceptances of the Hepatitis B Birth Dose by Provider Team
SOURCE: Parent/Caregiver interviews and provider interviews, all conducted by author, from April to May 2014 at UNC Hospitals Newborn Nursery.
0 20 40 60 80 100 120
UNC Pediatrics Family Medicine CHCC
Refusal Prevalence Among Provider Group
Refusals
29 Figure 7: Provider Teams of Parent/Caregiver Interview Refusals
SOURCE: Parent/Caregiver interviews and provider interviews, all conducted by author, from April to May 2014 at UNC Hospitals Newborn Nursery.
Provider Teams (Refusals Only), n = 21
UNC Pediatrics
Family Medicine
30
Appendix A, Limited Systematic Review
Introduction
Childhood vaccination is arguably one of the greatest developments in public health over
the last century (Diekema, 2005). The United States has seen dramatic drops in infectious
disease rates since the widespread adoption of childhood vaccination schedules. In 2010, an
estimated 70.2% of children aged 19-35 months received the recommended combined
vaccination series (CDC, 2011). However, barriers to vaccination, including lack of access and
accurate medical information on vaccines, continue to interfere with improvement of childhood
immunization rates. As a country, we have a ways to go before achieving our Healthy People
2020 goal to “increase immunization rates and reduce preventable infectious diseases” (Dept of
HHS, 2010).
Methods to improve childhood vaccination rate have been tried on various levels by
various societies. However, the literature evaluating existing methods that are effective in
increasing childhood vaccination rate is limited.
The purpose of this limited systematic review is to evaluate existing literature on
childhood vaccination policy and practices in developed countries in order to find potential
methods that may be applied to jurisdictions in the United States to increase childhood
vaccination on a national level.
Methods
To identify relevant articles, I searched PubMed for childhood vaccination policy and
applied the filters for humans and English. I scanned the resulting 237 titles and abstracts to
include only articles from the developed nations of Canada, Europe, the United States, and the
United Kingdom. I excluded articles that were older than 20 years (published before 1994)
31 include only articles that addressed vaccination in young children less than 12 years old to
maintain a focus on the bulk of vaccines given early in life. I also decided to exclude studies in
which the intervention was only aimed at reducing a socioeconomic disparity. Although focusing
interventions on specific groups of undervaccinated people may increase overall vaccination
coverage, such as low SES groups, this review excludes these interventions to focus on
broader policies that effect the larger population. Six articles were included in this systematic
review.
Results
The childhood vaccination rate after an instituted policy or program was compared to the
prior rate in 4 of the 6 articles. One article surveyed public clinics to determine factors that
contributed to high vaccination rates in the state of Georgia. The other article evaluated the
effects of CDC funding for childhood vaccinations. The main outcomes examined were
vaccination coverage rates. In 4 of the 6 articles, a variation of the 4:3:1:3:3 schedule (4+ doses
DTaP, 3+ doses polio, 1+ dose MMR, 3+ doses Hib, and 3+ doses Hep B) in an age range
somewhere within 12 months to 35 months old was the primary outcome measure. In one study
influenza vaccination rate of children less than 12 years old was the primary outcome measure.
In the other study, MMR coverage of children less than 2 years old was measured. The
evaluated interventions varied in structure and intensity, ranging from making vaccines free of
charge to using a phone/mail/home visit vaccination reminder system. Methods of evaluation
also varied greatly and included mailed and phone surveys, home interviews, and use of
national immunization databases. The articles are described below and described in the
Summary Table.
Dietz et al evaluated high vaccination coverage rates in Georgia public clinics through a
32 They obtained a 100% response rate from clinics which were stratified by coverage rate. 4:3:1
series coverage data of 21-23 month old children was extracted from clinic records by an
independent staff from the Georgia Immunization Program. Univariate analysis revealed that
high coverage rates were associated with small clinic size, a high proportion of patients enrolled
in WIC, nonurban settings, and numerous vaccine practices/policies. Multivariable analysis
showed that 8 of greater than 150 factors remained associated with high coverage rates: no
wait time, telephone reminder system, home visits for defaulters, restricting WIC vouchers when
children are undervaccinated, and motivational factors for nurses such as incentives to raise
coverage and participation in assessments by state immunization staff.
Ciofi et al evaluated childhood vaccination rates 21 regions and autonomous provinces
as well as three urban areas with population greater than 1 million in the country of Italy. They
used a national EPI-survey in 2003 and conducted home interviews with parents using a
standardized questionnaire. The purpose of the survey was follow up a similar survey done in
1998 in order to gauge whether changes since 1998 had made a difference in coverage. Their
sample included 4602 children, 731 (16%) of which were selected from alternates to replace
those that could not be contacted or declined participation. Children in the sample were
between 12 and 24 months old with a mean of 18.5 months. Outcome measures included
immunization coverage of 12-24 month olds (3+ doses each of diphtheria-tetanus, pertussis,
Hep B, Hib, and 1 dose MMR), where vaccines were given, whether they were given free of
charge, and reasons for missed or delayed vaccinations. Overall, more than 95% children
received immunization coverage, and every region surpassed the 90% mark except for one.
Non-mandated vaccination coverage, such as Hib at 87% and MMR at 77%, remained lower.
95% of vaccines were given at public Local Health Units, and 88% families received all vaccines
free of charge.
Moran et al evaluated the Universal Influenza Immunization Program in Ontario that
33 survey in September 2007 to contact families of 4854 children after exclusion for unknown
vaccination status and obtained a 70.2% response rate from those eligible. Of those surveyed,
the parent most responsible for caring for the child (PMR) was commonly a female in a
married/common law union with the average age of 37. The average surveyed family was a
family of four with two children aged 6 months to 11 years. The primary outcome measures
were influenza vaccination coverage rate for children less than 12 during the 2006-2007 flu
season and comparison to rates of other Canadian provinces that used targeted vaccination
programs. Information on location of where the vaccine was given, reasons for receiving or
refusing the vaccines, presence of chronic medical conditions, and other demographics were
collected. Ontario achieved 22.0% complete coverage for healthy children 2 – 11 years old,
30.8% complete coverage for children 2 – 11 years old with chronic medical conditions, and
10.2% complete coverage for all children 6 – 23 months old. Complete coverage required two
doses of vaccine for those less than 9 years old, and one dose for those older than 9. The
combined coverage rate (both complete and partial immunization statuses) for children 6 – 23
months old was 24.9%, similar to that of Manitoba but lower than those of Nova Scotia, Quebec,
Saskatchewan, and Alberta. The most common reason for receiving the vaccine was a health
reason, followed by vaccine recommendation (this was more prevalent in the 6 – 23 month
range). The most common reason for refusal was that it was not needed, followed by concerns
and barriers to access.
Espey et al evaluated the effects of the Clinical Prevention Initiative (CPI) in the state of
New Mexico. CPI adopted childhood vaccination as a topic in 2002 and established the “Done
By One” program, which consolidated the Advisory Committee on Immunization Practices
(ACIP) recommendations into a shorter time frame to accomplish full immunization by age 1.
The outcome measures included 4:3:1:3:3 coverage rates in 19 – 35 month old children,
obtained from the National Immunization Survey (NIS), and change in state immunization rank
34 from 2002 to 2005, up to 83.5%. New Mexico also moved up state rank from 49th in 2002 to 36th
in 2005.
Cushon et al assessed the effectiveness of the Immunization Reminders Project in the
Saskatoon Health Region (SHR) from October 2007 to October 2009. The project included up to
5 phone calls, a letter, and a home visit to caregivers of children 14 – 20 months old who were
behind on their immunization schedule. The sample included 24,540 children. The primary
outcome measure was MMR coverage rates for children residing in SHR at the time they turned
2 years old that were recorded in the Saskatchewan Immunization Management System
(SIMS). These rates were also stratified by geographical region, which oftentimes reflected
socioeconomic status. Overall, MMR coverage increased in 2 year olds from 2007 to 2009
(68.6% to 75.7%), as well as in each geographical area. Coverage rate was significantly lower
in low-income “core” neighborhoods, sometimes by over 20%.
Rein et al used a fixed-effects model to evaluate CDC immunization grant funding in 56
U.S. jurisdictions (50 states and 6 cities) from 1995 to 2003. Population characteristics included
73.2% vaccination coverage, 14.7% below the federal poverty line (FPL), 24.5% at 5 times the
FPL or higher, 5.8% unemployment, 7.6% without health insurance. The primary outcome
measure was 4:3:1:3:3 coverage in children 19 – 35 months old, obtained using the NIS. The
effect of financial assistance funding per capita was positive and statistically significant. A $10
increase in funding per capita corresponded to a 1.6% increase in vaccination coverage.
Increases in unemployment were also associated with statistically significant increases in
coverage.
Discussion
Overall, this limited systematic review elucidated a few successful methods to increase
childhood vaccination. However, before adopting such methods on a state or national level, the
35 The Georgia public clinic study obtained an excellent response rate with little risk of
selection bias as they surveyed all Georgia public clinics. However measurement bias could
easily have skewed results if clinic records were not accurate. Recall bias and the Hawthorne
effect could also play roles through use of a survey. These biases would likely overestimate
vaccination rate, although inaccurate records would likely underestimate it. Several other
studies made use of surveys, including Ciofi et al and Moran et al. Even the studies that used
reputable vaccination records, such as the SIMS or NIS, could introduce potential bias. The NIS
is a list-assisted random-digit-dialing telephone survey followed by a mailed survey to the child’s
immunization provider (CDC, 2014). Exclusion of patients without landlines, those who declined,
and inaccuracy of records or failure to respond on the provider’s part may all add to a bias of
uncertain direction and magnitude. Other potential sources of bias in these studies include large
numbers of people who declined participation (seen in Ciofi et al and Moran et al), possibly
leading to overestimation of vaccination rates if those who declined were refusals or
noncompliants.
Precision was an issue with a few studies. Some confidence intervals in the CDC
funding study were fairly wide, including that for vaccination coverage (Rein et al, 2006). The
SHR study had relatively tight confidence intervals except for the core neighborhood stratum,
which was attributed to a small sample size (Cushon et al, 2012). The CPI study also had wide
confidence intervals in the NIS data (Espey et al, 2007). The wider the confidence interval, the
less precise we can be about the results reported.
Some of the studies had other limitations that may limit the strength of their conclusions.
For example, the Georgia public clinic study did not track staffing or WIC changes over time,
two factors that could have contributed to the success of their increased vaccination rates (Dietz
et al, 2000). The SHR study examined effects of the Immunization Reminders Project, but it is
difficult to say that the increased immunization rates were solely a result of that project and that
36 allocations, not expenditures, and analyzed only seven years of data. They were also unable to
make any conclusions on how their CDC funding affected other sources of vaccination funding
(Rein et al, 2006). The CPI study was done in New Mexico, a state with large Hispanic and
Native American population, largely uninsured with a high rate of childhood poverty (Espey et al,
2007). Perhaps a similar initiative would not be as successful in a wealthier less diverse
population. Each of these studies was performed in different locations with varying populations
and health care systems, implying that application in a different setting may or may not be as
successful.
Despite these limitations and potential biases, many of the methods found to be
successful in this review could potentially be applied to similar populations. The one method that
did not show an improvement was the Universal Influenza Immunization Program in Ontario
compared to targeted programs of other Canadian provinces (Moran et al, 2009). Each of the
other studies showed moderate improvements with the given methods, and the Georgia study
found some clinic characteristics associated with increased vaccination rate (Ciofi et al, Espey
et al, Cushon et al, Rein et al, and Dietz et al).
I can conclude, upon individual study analysis, most of these methods worked at least
moderately, perhaps with other factors working as well, for the given populations. Thus, it may
be effective to try some of the practices on a local or state level in the U.S. with the hope that
37
Summary Table
Article
Study
Population
Primary
Outcome
Measure
Intervention
Evaluated
Location
Main Result
Potential
for Bias &
Limitations
Dietz et al (2000)
21 – 23 month old children 4:3:1 (4+ DTap, 3+ polio, 1+ measles) coverage Georgia public health clinics
Georgia 8 factors associated w/ high coverage rates
Medium
Ciofi et al (2004)
12 – 24 month old children
3:3:1:3:3 coverage
National goal of 95% coverage, new national immunization schedule, free vaccines within National Health Service
Italy >95% received 3 doses polio, DT, pertussis, HBV. Hib coverage at 87%,
MMR/measles coverage ≥ 16 mos. at 77%.
Medium - High
Moran et al (2009)
< 12 y.o. children Influenza vaccine coverage Universal Influenza Immunization Program
Ontario Rates not better than those in targeted programs Medium - High Espey et al (2007)
19 – 35 month old children 4:3:1:3:3 coverage Clinical Prevention Initiative “Done By One” program
New Mexico ↑ 13.8% vaccine coverage from 2002 to 2005 (up to 83.5%)
Low - Medium
Cushon et al (2012)
2 year-olds MMR coverage Immunization Reminders Project Saskatoon Health Region, Saskatchewan MMR coverage increase from 68.6% to 75.7% from 2007 to 2009
Low
Rein et al (2006)
19 – 35 month old children 4:3:1:3:3 coverage CDC Immunization Grants Program Funding United States (50 states + 6 cities)
$10 increase in funding per capita corresponded to a 1.6% increase in vaccination coverage
38
References
CDC (2011). "National and State Vaccination Coverage Among Children Aged 19-35 Months - United States, 2010." MMWR 60(34): 1157-1163.
CDC (2014, February 26, 2014). "National Immunization Survey." 2014.
Ciofi Degli Atti, M. L., M. C. Rota, A. Bella and S. Salmaso (2004). "Do changes in policy affect vaccine coverage levels? Results of a national study to evaluate childhood vaccination coverage and reasons for missed vaccination in Italy." Vaccine 22(31-32): 4351-4357.
Cushon, J. A., C. O. Neudorf, T. M. Kershaw, T. G. Dunlop, et al. (2012). "Coverage for the entire population: tackling immunization rates and disparities in Saskatoon Health Region." Can J Public Health 103(7 Suppl 1): eS37-41.
Diekema DS; American Academy of Pediatrics Committee on Bioethics. Responding to parental refusals of immunization of children. Pediatrics 2005;115:1428-31.
Dietz, V. J., A. L. Baughman, E. F. Dini, J. M. Stevenson, et al. (2000). "Vaccination practices, policies, and management factors associated with high vaccination coverage levels in Georgia public clinics. Georgia Immunization Program Evaluation Team." Arch Pediatr Adolesc Med 154(2): 184-189.
Espey, D. K., S. L. Baum, A. M. Jung and R. L. Kozoll (2007). "The New Mexico Clinical Prevention Initiative: a statewide prevention partnership." Public Health Rep 122(3): 292-301.
Moran, K., S. Maaten, A. Guttmann, D. Northrup, et al. (2009). "Influenza vaccination rates in Ontario children: implications for universal childhood vaccination policy." Vaccine 27(17): 2350-2355.
Rein, D. B., A. A. Honeycutt, L. Rojas-Smith and J. C. Hersey (2006). "Impact of the CDC's Section 317 Immunization Grants Program funding on childhood vaccination coverage." Am J Public Health 96(9): 1548-1553.
40 In fa nt D at e of B ir th Et hn ic it y V ac ci ne p ri or to di sc ha rg e? (y /n ) M at er na l H ep B St at us (+ /-) M at er na l A ge (y rs ) Pr ov id er te am (p ed s or fa mi ly ) IF n o va cc in e, d oc ume nt ed re as on In su ra nc e (p ub lic o r pr iv at e) Po st al Cod e
1 2 3 4 5 6 7
41
Hepatitis B Vaccination Improvement
PARENT/GUARDIAN Interview Protocol
Hello, my name is Susie Klodnicki. I am a medical student and public health student
working on a project to help more babies get the Hepatitis B vaccination here at UNC. I
am working with Dr. Carl Seashore and Dr. Sue Tolleson-Rinehart. Do you mind if I ask
a few questions about the vaccine today?
[If yes]: My project has been reviewed by the UNC Institutional Review Board…
[if No]: Thank you! I’ll be around for a while – please let me know if you change your
mind!
1.
Has your baby gotten the Hepatitis B vaccine?
Yes
No
[IF NO]
1.A. Why hasn’t your baby had the vaccination?
2.
Why do you think the Hepatitis B vaccine IS/IS NOT important for your baby’s
health?
3.
Who talked to you about the Hepatitis B vaccine today? [get provider role; if
parent/guardian doesn’t spontaneously provide, say “And was that the…doctor,
resident, nurse, medical student, someone else?]
42
4.
After you talked about the vaccine, did you have any questions left that you still
didn’t have answers to?
5.
Thank you! One last question: who cared for you and the baby at the time of the
birth? People in obstetrics, or Family Medicine, or something else?
43