269
Concurrent optimization of integrated macro-ergonomics and
resilience engineering in a pharmaceutical manufacturer
Naser Habibifar
1, Mahdi Hamid
2*, Mohammad Mahdi Nisiri
21School of Industrial Engineering, K. N. Toosi University of Technology, Tehran, Iran 2School of Industrial Engineering, College of Engineering, University of Tehran, Tehran, Iran
n.habibifar@ut.ac.ir, m.hamid31400@ut.ac.ir, mnasiri@ut.ac.ir
Abstract
Pharmaceutical manufacturers have a vital role in the healthcare system insofar as any disruption in their production processes jeopardizes people’s health and the environment they inhabit. Resilience engineering (RE) could shift such systems from an abnormal to a normal state. In addition, macro-ergonomics (ME) can enhance all system factors in a pharmaceutical plant. It is argued that integrating RE with ME could result in the overall optimization of a pharmaceutical unit. This study presents an integrated approach based on RE and ME factors which could be used to optimize the performance of pharmaceutical plants. A standard questionnaire was designed and distributed among experts. Data envelopment analysis (DEA) and fuzzy DEA were used to conduct optimization. Then. Pearson correlation test and paired t-test were used to evaluate the best DEA or fuzzy DEA model. Next, the best model was tested in terms of RE, ME, and combined factors. The results showed that reporting culture, flexibility, and formalization are the most important factors in the pharmaceutical industry. This is the first study to carry out an integrated optimization of RE and ME in a pharmaceutical unit and, thus, provides a practical approach for the pharmaceutical industry.
Keywords: Pharmaceutical plants, performance optimization, resilience engineering (RE), macro-ergonomics, Data Envelopment Analysis (DEA)
Motivation & significance
Today, economic factors are one of the most critical dimensions that influence the sustainability of organizations. Also, pharmaceutical factories have a substantial role in the healthcare system of any country, because any problem in their production procedures might threaten the health of many humans. Given that macro-ergonomics (ME) and resilience engineering (RE) factors have an undeniable impact on the sustainability of any organization, this paper studies these factors in a pharmaceutical unit. Evidently, addressing these factors can help managers provide appropriate directions and prevent adverse events that may occur in their organization.
*Corresponding author
ISSN: 1735-8272, Copyright c 2019 JISE. All rights reserved
Journal of Industrial and Systems Engineering Vol. 12, No. 3, pp. 269- 282
270
1-Introduction
Regardless of the location and field they touch, economic disasters increase competition between companies and alter customer expectations, and lead to complications which oblige firms to be resilient. Resilience is a long-term strategic initiative that changes the way a firm operates by adjusting linkages between competitive strategies and functional strategy. The need to be resilient against disturbances is paramount for firms in countries with developing economies. Developing economies that aim at economic progress are often challenged by some giant firms from developed economies (Dangayach and Deshmukh 2001, Khanna and Palepu 2006). Resilience is typically regarded as the power of an organization to face with big alterations in the business and economic environment or the power to resist interruption and unfavorable events (Sheffi and Rice 2005, Beverly and Rodysill 2007). Moreover, resilience has been conceived as the ability of organizations to continue, overcome, or positively adjust to adverse events, disruptions, and external shocks (Zhalechian et al., 2018, Sutcliffe and Vogus 2003, Gittell et al. 2006, Powley 2009).
In this study, resilience denotes the power of organizations or factories to adapt their manufacturing strategies to a competitive strategy which can result in competitive advantage and efficient performance. This is crucial because acquiring resilience must be a strategic action aimed at decreasing the susceptibility triggered by changes in the competitive environment (Sheffi and Rice 2005). Some researchers in the manufacturing field have suggested that manufacturing strategy can have a substantial effect on the firm’s power to obtain competitive benefits and better operation (Ahmad and Schroeder 2003). Moreover, a few researchers have provided comparative analyses of how the manufacturing strategy of a firm affects its competitive strategy and its overall operation. Large companies and organizations are able to build resilience capabilities when they have business models that conform to the needs of the competitive environment (Gittell et al. 2006). Thus, one way of responding effectively to different emerging crises for businesses is to adjust their operational strategy with their competitive strategy. Economic recessions have posed serious challenges for many companies, including pharmaceutical factories, and have forced them to cultivate resilience. At times of economic crisis, companies face major threats to their financial performance and, ultimately, their survival. Statistics also propose that companies’ internal problems have had ripple effects on their operation during the recent economic crisis.
In recent years, many researchers have focused on the concept and application of RE in different industries. For example, Zhang and Lin (2010) offered five principles to design systems of resilience by a particular focus on resilience in other concepts such as reliability, safety, and dependability. Wang et al. (2010) considered resilience in a company's ISs to maximize information recovery. They used customer relationship management (CRM) and supply chain management (SCM) as a service system with two levels (surface and infrastructure) in a company of ISs. Park et al. (2009) examined the effects of organizational resilience on system and information quality. They also explored whether the system can reduce the risk and increase the quality of information and organizational resilience. It was concluded that organizational resilience is positively influenced by system quality but not through information quality. Azadeh et al. (2017) developed an intelligent algorithm based on artificial neural networks, fuzzy data envelopment analysis (DEA), and statistical methods in order to conduct a performance assessment of resilience engineering and lean production principles in a pipe manufacturing plant. Their study showed that the performance of the manufacturer was undesirable in terms of “fault tolerant” and “pull system” factors. Babajani et al. (2019) evaluated the performance of a sand mine in Iran using resilience engineering. For this purpose, they used a multivariate algorithm based on fuzzy DEA. Haghighi and Torabi (2018) proposed a mixed sustainability-resilience framework for assessing hospital information systems. To this end, they employed a multivariate algorithm consisting of DEA, best worst method, statistical methods, and SWOT matrix.
On the other hand, there are other factors that can affect the performance of the organization in the future even more than do resilience factors. These are human factors (ergonomics) which have a strong relationship with resilience engineering. Researchers have a long tradition of focusing on micro-ergonomic factors (A. Joy Rivera-Rodriguez et al., 2013). In the late 20th century, researchers turned to organizational or macro-ergonomic factors such as work-related stress, culture, job design, and teamwork (Karsh, 2006). Although it is generally accepted that a 10-25% improvement might happen for the organizations by employing micro-ergonomic techniques, more recent studies confirm
271
that a 60-90% growth is the outcome of correctly applying macro-ergonomic concepts (Hendrick, 1991).
Macro-ergonomics deals with issues such as how to organize the design of the working system on the basis of technical aspects. It also aims at creating a comprehensive and unified work system that culminates in enhancing and promoting different dimensions of a workplace (Hendrick 2001, 2005). The interrelationship between organizational performance and macro-ergonomics has attracted the attention of several researchers. For example, Acosta and Karen Lange Morales (2008) employed macro-ergonomic concepts to present a macro-ergonomic framework for distribution centers of a food company. Their work helped optimize the company’s processes and ensure that knowledge transfer takes place within the company. Ben-Tzion Karsh and Roger Brown (2010) investigated ergonomics in healthcare and focused on patient safety. They specified two different levels: ‘ergonomic’ and ‘organizational hierarchy’. It was found that different micro-ergonomic/macro-ergonomic factors and organizational hierarchy levels influence patients’ safety. The authors also discussed the impact of these levels on the theories, measurements, analyses, and interventions introduced in the context of patient safety research. Azadeh et al. (2016) used DEA and proposed an integrated approach for analyzing the impact of macro-ergonomic factors in the healthcare supply chain. They concluded that the most influential macro-ergonomic factor on healthcare supply chain is teamwork. Addressing the application of macro-ergonomic methods in human resources processes based on the ISO 12207 standard, Franco et al. (2019) came up with an intelligent approach which utilizes machine learning.
The current study proposes an integrated framework which evaluates and analyzes the impact of resilience engineering factors and macro-ergonomic factors by means of DEA and statistical methods. To the best of our knowledge, this is the first study to undertake a comprehensive performance assessment of a pharmaceutical manufacturing plant from the perspective of resilience engineering and macro-ergonomics.
The remainder of the paper is structured as follows. Section 2 presents the methodology. Section 3 provides the results and discusses the obtained results. Finally, section 4 is dedicated to the concluding remarks and suggests directions for future research.
2-Methodology
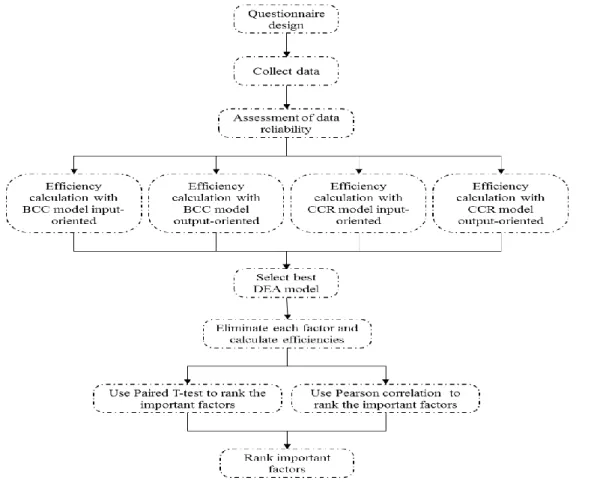
The framework of the paper is shown in Figure 1. As can be seen, a standard questionnaire was first designed to collect the data; then, the validity of gathered data was established through Cronbach's alpha. In the next step, different models of DEA were deployed to measure the efficiency of the Decision-Making Units (DMUs) and the best model was determined. Next, data related to each factor of the questionnaire was extracted and the efficiency of the DMUs was calculated again using the best DEA model. Finally, the most important factors were identified using paired t-test and Pearson correlation.
2-1-Data Envelopment Analysis
MCDM methods are widely utilized in several contexts such as safety (e.g., see Azadeh et al., 2016, Babajani et al., 2019), healthcare systems (e.g., see Hamid et al., 2018a, Hamid et al., 2018b, Yazdanparast et al., 2018, Hamid et al., 2019), manufacturing area (e.g., see Habibifar et al., 2019), and scheduling (e.g., see Jamili et al., 2018), product selection (e.g., see Bastan; et al., 2019) . Data envelopment analysis (DEA) is one of the best methods for multi attribute decision making. This method is a nonparametric tool in operation studies and economics which attempts to make an estimation of production frontiers. It is generally used to experimentally calculate the productive efficiency of DMUs. Even though DEA is deeply tied to production theory in economics, it can also be employed for benchmarking in operations management, in which some measuring tools are chosen for benchmarking the performance of manufacturing and service operations. In benchmarking, efficient DMUs, as specified via DEA, might not always obtain a so-called “production frontier” but yield a “best-practice frontier” (Cook, Tone and Zhu, 2014). Sherman and Zhu (2012) have regarded DEA as "balanced benchmarking." One of the advantages of non-parametric approaches is that they do not involve taking a precise functional form for the frontier; nevertheless, they do not reveal a general relationship (equation) that might associate outputs and inputs.
272
On the other hand, there are also parametric methods for estimating production frontiers (Aigner et al. 1997). Such methods necessitate that the shape of the frontier be conjectured in advance through determining an exact function that could relate an output to an input. It is also possible to integrate the relative benefits of each of these approaches (Tofallis, 2001), such that the frontier units could be first detected through DEA and then matched to a smooth surface. This enables estimating of a best-practice relationship between several outputs and inputs.
Using linear programming, DEA is a non-parametric method for evaluating relative efficiencies of DMUs with common inputs and outputs. It was first developed for ranking and analyzing DMUs such as industries, universities, schools, hospitals, cities, facility layouts, banks, etc. Azadeh and Ebrahimipour (2002), Azadeh and Ebrahimipour (2004), Azadeh and Jalal (2001) and Zhu (1998). DEA models can be input- or output-oriented and be specified as constant returns to scale (CRS) or variable returns to scale (VRS) (Azadeh et al., 2012).
2-1-1-Basic models of DEA
DEAs have two basic models: CCR and BCC. The BCC model considers VRS and involves a condition of convexity. The original fractional CCR model evaluates the relative efficiencies of n DMUs (j = 1,. . ., n) while each DMU includes m inputs and s outputs denoted by 𝑥1𝑗, 𝑥2𝑗,. . .,
𝑥𝑚𝑗and 𝑦1𝑗, 𝑦2𝑗,. . ., 𝑦𝑠𝑗, respectively (Charnes et al., 1978). In this model, the efficiencies of n
DMUs are evaluated by maximizing outputs while inputs are constant. Since the linear CCR programming model allocates the common index of one to all efficient DMUs in the data set, it does not rank efficient units. Therefore, this model was later modified by Andersen and Petersen (1993) for DEA-based ranking purposes. In Anderson – Peterson (A.P) model, the score associated with the efficient units can be larger than one, thus enabling the ranking of both efficient and inefficient units. This model also considers VRS. The efficient units of this study are ranked through models (1) and (2), which are input-oriented and output-oriented, respectively.
273
2-2-Questionnaire design and data collection
According to the RE framework and macro-ergonomic factors, a structured questionnaire was initially developed for the personnel of the case study (Hale et al., 2006; Huber et al., 2009; Azadeh et al., 2014b; Hendrick and Kleiner, 2002). It consisted of six RE components and three macro-ergonomic components. The RE factors were top-level commitment, reporting culture, learning culture, awareness, preparedness, and flexibility. The macro-ergonomic factors included complexity, formalization, and centralization. Additionally, three questions were allocated for the economic factor, all of which were related to paying employee salaries. RE and macro-ergonomics factors were the input variables and the economic factor was considered the output variable. The answer to each question ranged from 1 to 10, with 1 indicating “strongly disagree” and 10 representing “strongly agree”. The questionnaire was completed by 45 individuals with different positions in the company under consideration. The questions asked are as follows.
Fig 2. The scale of the questionnaire
1. R1: Top-level commitment (e.g. The staff are confident that the management can provide good leadership if the organization is struck by a crisis)
2. R2: Reporting culture (e.g. Do you feel comfortable reporting issues/problems to your boss?) 3. R3: Learning culture (e.g. We learn lessons from past projects and make sure those lessons are
carried through to future projects.)
4. R4: Awareness (e.g. Do you think you know what is going on now in this company?)
5. R5: Preparedness (e.g. Do you think your company can solve the economic problems that may occur in the future?)
6. R6: Flexibility (e.g. At the time of sanction or recession, the necessary information is available from a variety of ways and places.)
7. M1: Complexity (e.g. Are there different communication devices or channels between work elements?)
8. M2: Formalization (e.g. Is there any detailed explanation of the work process and its steps?) 9. M3: Centralization (e.g. If the system faces a problem, does your department have adequate
authority – from the boss – for decision making?). 10. E: Economic (e.g. Is your salary paid on time?)
2-3-Data summarization
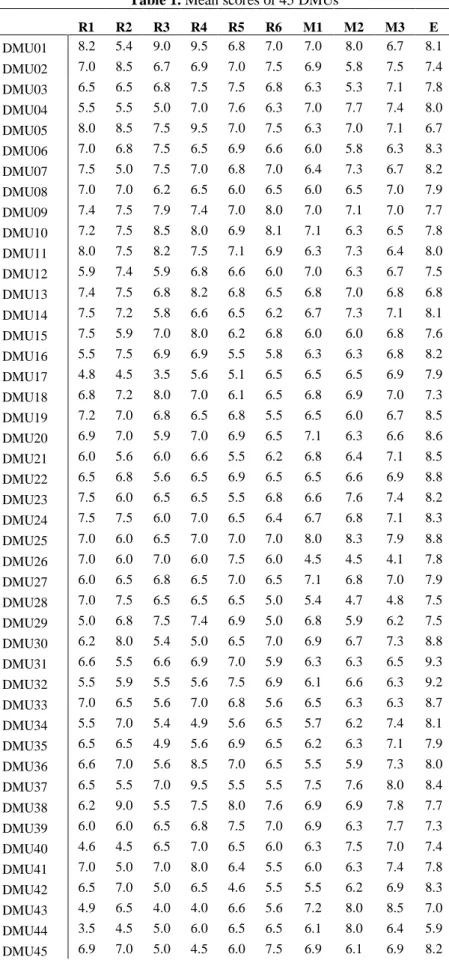
Decision-making units of the present research were composed of 45 individuals (staff, supervisor, and manager) working in the company. All questionnaires were filled in by employees of the same factory in 2017. Each person responding to at least 16 questions about the RE, macro-ergonomic, and economic factors was named a DMU. In practice, the number of DMUs should be three times as large as the total number of inputs and outputs. In this study, this assumption is satisfied. The DMUs and their related mean scores are shown in Table 1, where Ri and Mj are used to represent resilience and macro-ergonomic factors, respectively (For a discussion of these factors, see section 0). Also, E is used to denote the economic factor.
274
Table 1. Mean scores of 45 DMUs
R1 R2 R3 R4 R5 R6 M1 M2 M3 E
DMU01 8.2 5.4 9.0 9.5 6.8 7.0 7.0 8.0 6.7 8.1
DMU02 7.0 8.5 6.7 6.9 7.0 7.5 6.9 5.8 7.5 7.4
DMU03 6.5 6.5 6.8 7.5 7.5 6.8 6.3 5.3 7.1 7.8
DMU04 5.5 5.5 5.0 7.0 7.6 6.3 7.0 7.7 7.4 8.0
DMU05 8.0 8.5 7.5 9.5 7.0 7.5 6.3 7.0 7.1 6.7
DMU06 7.0 6.8 7.5 6.5 6.9 6.6 6.0 5.8 6.3 8.3
DMU07 7.5 5.0 7.5 7.0 6.8 7.0 6.4 7.3 6.7 8.2
DMU08 7.0 7.0 6.2 6.5 6.0 6.5 6.0 6.5 7.0 7.9
DMU09 7.4 7.5 7.9 7.4 7.0 8.0 7.0 7.1 7.0 7.7
DMU10 7.2 7.5 8.5 8.0 6.9 8.1 7.1 6.3 6.5 7.8
DMU11 8.0 7.5 8.2 7.5 7.1 6.9 6.3 7.3 6.4 8.0
DMU12 5.9 7.4 5.9 6.8 6.6 6.0 7.0 6.3 6.7 7.5
DMU13 7.4 7.5 6.8 8.2 6.8 6.5 6.8 7.0 6.8 6.8
DMU14 7.5 7.2 5.8 6.6 6.5 6.2 6.7 7.3 7.1 8.1
DMU15 7.5 5.9 7.0 8.0 6.2 6.8 6.0 6.0 6.8 7.6
DMU16 5.5 7.5 6.9 6.9 5.5 5.8 6.3 6.3 6.8 8.2
DMU17 4.8 4.5 3.5 5.6 5.1 6.5 6.5 6.5 6.9 7.9
DMU18 6.8 7.2 8.0 7.0 6.1 6.5 6.8 6.9 7.0 7.3
DMU19 7.2 7.0 6.8 6.5 6.8 5.5 6.5 6.0 6.7 8.5
DMU20 6.9 7.0 5.9 7.0 6.9 6.5 7.1 6.3 6.6 8.6
DMU21 6.0 5.6 6.0 6.6 5.5 6.2 6.8 6.4 7.1 8.5
DMU22 6.5 6.8 5.6 6.5 6.9 6.5 6.5 6.6 6.9 8.8
DMU23 7.5 6.0 6.5 6.5 5.5 6.8 6.6 7.6 7.4 8.2
DMU24 7.5 7.5 6.0 7.0 6.5 6.4 6.7 6.8 7.1 8.3
DMU25 7.0 6.0 6.5 7.0 7.0 7.0 8.0 8.3 7.9 8.8
DMU26 7.0 6.0 7.0 6.0 7.5 6.0 4.5 4.5 4.1 7.8
DMU27 6.0 6.5 6.8 6.5 7.0 6.5 7.1 6.8 7.0 7.9
DMU28 7.0 7.5 6.5 6.5 6.5 5.0 5.4 4.7 4.8 7.5
DMU29 5.0 6.8 7.5 7.4 6.9 5.0 6.8 5.9 6.2 7.5
DMU30 6.2 8.0 5.4 5.0 6.5 7.0 6.9 6.7 7.3 8.8
DMU31 6.6 5.5 6.6 6.9 7.0 5.9 6.3 6.3 6.5 9.3
DMU32 5.5 5.9 5.5 5.6 7.5 6.9 6.1 6.6 6.3 9.2
DMU33 7.0 6.5 5.6 7.0 6.8 5.6 6.5 6.3 6.3 8.7
DMU34 5.5 7.0 5.4 4.9 5.6 6.5 5.7 6.2 7.4 8.1
DMU35 6.5 6.5 4.9 5.6 6.9 6.5 6.2 6.3 7.1 7.9
DMU36 6.6 7.0 5.6 8.5 7.0 6.5 5.5 5.9 7.3 8.0
DMU37 6.5 5.5 7.0 9.5 5.5 5.5 7.5 7.6 8.0 8.4
DMU38 6.2 9.0 5.5 7.5 8.0 7.6 6.9 6.9 7.8 7.7
DMU39 6.0 6.0 6.5 6.8 7.5 7.0 6.9 6.3 7.7 7.3
DMU40 4.6 4.5 6.5 7.0 6.5 6.0 6.3 7.5 7.0 7.4
DMU41 7.0 5.0 7.0 8.0 6.4 5.5 6.0 6.3 7.4 7.8
DMU42 6.5 7.0 5.0 6.5 4.6 5.5 5.5 6.2 6.9 8.3
DMU43 4.9 6.5 4.0 4.0 6.6 5.6 7.2 8.0 8.5 7.0
DMU44 3.5 4.5 5.0 6.0 6.5 6.5 6.1 8.0 6.4 5.9
DMU45 6.9 7.0 5.0 4.5 6.0 7.5 6.9 6.1 6.9 8.2
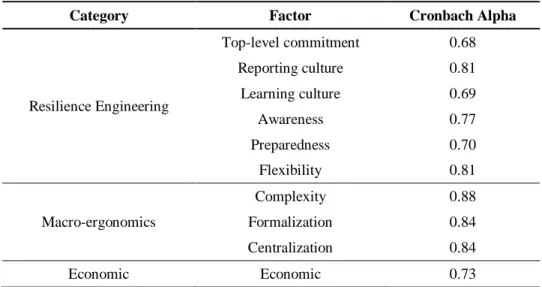
To assess the reliability of the collected data, Cronbach’s alpha of all factors was calculated and the results are given in Table 2.
275
Table 2. Cronbach alpha coefficients of the study factors
3-Results and discussion
This study utilizes DEA to obtain DMUs’ efficiencies in the company in order to identify those resilience and macro-ergonomic factors which exert the highest impact on the economic factor. The selection of input-output variables plays a key role in DEA (Azadeh et al., 2009). Since an increase in inputs/outputs does not result in a proportional change in outputs/inputs, a model should be considered which allows for VRS such as the full ranking BCC model (Anderson-Peterson model). To this end, after the input-oriented (output-oriented) DEA model with a VRS frontier type was chosen, the DEA model was solved using all of the mentioned inputs and outputs. Then, in each step, one of the macro-ergonomic and RE factors was deleted from the model inputs in order to determine new efficiency scores and evaluate the effect of each factor on the performance of the system. In other words, the impact of each input/output variable was assessed separately with respect to resulting changes in system efficiency.
3-1- DEA results
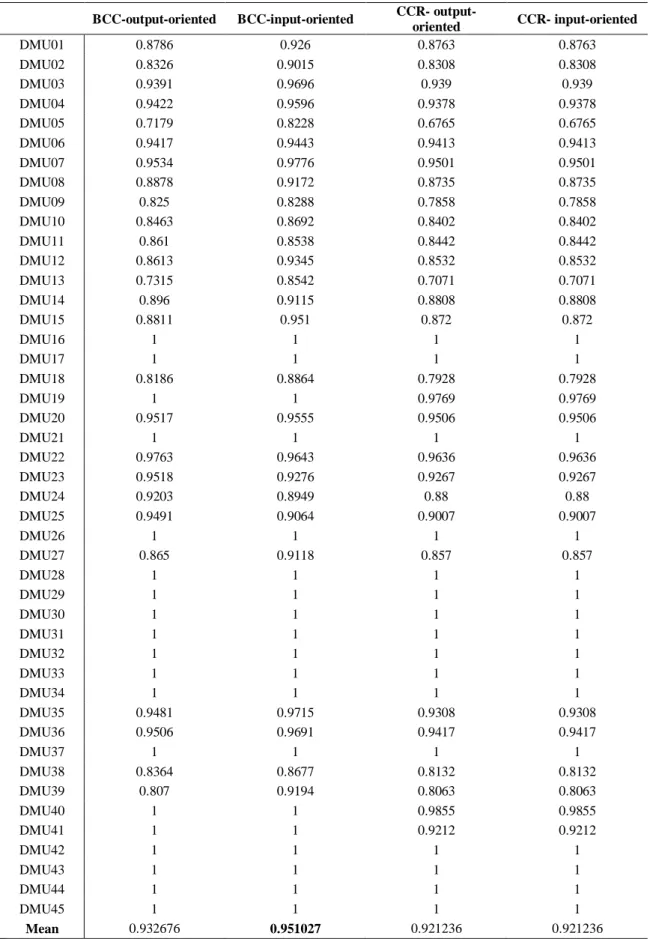
DEA was run in MATLAB for all data with different models. Specifically, DEA was performed in four modes: BCC model input-oriented, BCC model output-oriented, CCR model input-oriented, and CCR model output-oriented. Different methods can be used to determine the best DEA model. For example, we can easily calculate the sum of all units' efficiency and choose the model with the highest score as the best model. We can also add some noise to some of the input data values of the DEA models and run the DEA models with this new data. Finally, by comparing the new results with the previous results, the model with the highest noise resistance is selected as the best model. To select the best DEA model, the second method was used and BCC model input-oriented was identified and chosen for the next calculation. The results of the four executed models are shown in Table 3.
Category Factor Cronbach Alpha
Resilience Engineering
Top-level commitment 0.68
Reporting culture 0.81
Learning culture 0.69
Awareness 0.77
Preparedness 0.70
Flexibility 0.81
Macro-ergonomics
Complexity 0.88
Formalization 0.84
Centralization 0.84
276
Table 3. Results of DEA models
BCC-output-oriented BCC-input-oriented CCR-
output-oriented CCR- input-oriented
DMU01 0.8786 0.926 0.8763 0.8763
DMU02 0.8326 0.9015 0.8308 0.8308
DMU03 0.9391 0.9696 0.939 0.939
DMU04 0.9422 0.9596 0.9378 0.9378
DMU05 0.7179 0.8228 0.6765 0.6765
DMU06 0.9417 0.9443 0.9413 0.9413
DMU07 0.9534 0.9776 0.9501 0.9501
DMU08 0.8878 0.9172 0.8735 0.8735
DMU09 0.825 0.8288 0.7858 0.7858
DMU10 0.8463 0.8692 0.8402 0.8402
DMU11 0.861 0.8538 0.8442 0.8442
DMU12 0.8613 0.9345 0.8532 0.8532
DMU13 0.7315 0.8542 0.7071 0.7071
DMU14 0.896 0.9115 0.8808 0.8808
DMU15 0.8811 0.951 0.872 0.872
DMU16 1 1 1 1
DMU17 1 1 1 1
DMU18 0.8186 0.8864 0.7928 0.7928
DMU19 1 1 0.9769 0.9769
DMU20 0.9517 0.9555 0.9506 0.9506
DMU21 1 1 1 1
DMU22 0.9763 0.9643 0.9636 0.9636
DMU23 0.9518 0.9276 0.9267 0.9267
DMU24 0.9203 0.8949 0.88 0.88
DMU25 0.9491 0.9064 0.9007 0.9007
DMU26 1 1 1 1
DMU27 0.865 0.9118 0.857 0.857
DMU28 1 1 1 1
DMU29 1 1 1 1
DMU30 1 1 1 1
DMU31 1 1 1 1
DMU32 1 1 1 1
DMU33 1 1 1 1
DMU34 1 1 1 1
DMU35 0.9481 0.9715 0.9308 0.9308
DMU36 0.9506 0.9691 0.9417 0.9417
DMU37 1 1 1 1
DMU38 0.8364 0.8677 0.8132 0.8132
DMU39 0.807 0.9194 0.8063 0.8063
DMU40 1 1 0.9855 0.9855
DMU41 1 1 0.9212 0.9212
DMU42 1 1 1 1
DMU43 1 1 1 1
DMU44 1 1 1 1
DMU45 1 1 1 1
277
3-2-Sensitivity analysis
To identify the factor(s) with substantial effects (good or bad) on the efficiency of each person, efficiency score was first assessed with all factors; then, one factor would be eliminated and efficiency score was calculated once more without this factor for all individuals. Pearson correlation test and paired-t-test were employed to determine the effect of every single factor.
3-2-1-Correlation test
To find relevant correlations between all factor data, the parametric Pearson test was performed in MINITAB. As expected, the results demonstrated a high correlation (Table 4). The results indicated that while all factors are important, the most consequential ones are reporting culture, flexibility, and formalization, in order of significance.
Table 4. Pearson correlation test
Eliminated Factor R1 R2 R3 R4 R5 R6 M1 M2 M3
Pearson correlation 0.975 0.931 0.993 0.991 0.986 0.970 0.999 0.951 0.995
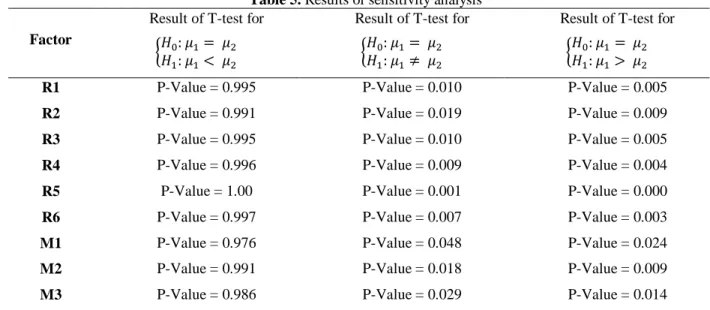
3-2-2-Paired-t-test
As the main part of sensitivity analysis, paired-t-test was deployed to specify the impact (good or bad) of every single factor. The results are shown in Table 5, where 𝜇1 signifies efficiencies with all
factors and 𝜇2 stands for efficiencies without one factor (eliminated factor).
As observed in Table 5, all factors have positive effects on the efficiency of individuals. In general, it can be stated that M1 factor (Complexity) has a lower effect rather than do other factors.
Table 5. Results of sensitivity analysis
Factor
Result of T-test for {𝐻𝐻0: 𝜇1= 𝜇2
1: 𝜇1< 𝜇2
Result of T-test for {𝐻𝐻0: 𝜇1= 𝜇2
1: 𝜇1≠ 𝜇2
Result of T-test for {𝐻𝐻0: 𝜇1= 𝜇2
1: 𝜇1> 𝜇2
R1 P-Value = 0.995 P-Value = 0.010 P-Value = 0.005
R2 P-Value = 0.991 P-Value = 0.019 P-Value = 0.009
R3 P-Value = 0.995 P-Value = 0.010 P-Value = 0.005
R4 P-Value = 0.996 P-Value = 0.009 P-Value = 0.004
R5 P-Value = 1.00 P-Value = 0.001 P-Value = 0.000
R6 P-Value = 0.997 P-Value = 0.007 P-Value = 0.003
M1 P-Value = 0.976 P-Value = 0.048 P-Value = 0.024
M2 P-Value = 0.991 P-Value = 0.018 P-Value = 0.009
M3 P-Value = 0.986 P-Value = 0.029 P-Value = 0.014
4-Conclusion
Evaluating macro-ergonomic and resilience factors in industrial units can help managers devise better policies for the future of their organization, especially when this assessment is undertaken according to economic factors. In the present study, this was achieved by considering six major factors associated with resilience and three macro-ergonomic factors. Resilience factors included top-level commitment, reporting culture, learning culture, awareness, preparedness, and flexibility. Macro-ergonomic factors, on the other hand, were complexity, formalization, and centralization. Relevant data were collected through a questionnaire distributed among 45 employees with different positions working in a pharmaceutical company. DEA was performed in MATLAB to calculate the efficiency of DMUs. To select the best DEA model, the program was run four times with different
278
modes and the input-oriented BCC model was chosen on account of its robustness to noise. Afterwards, the next calculation was undertaken using this optimal model. To assess the effect of each single factor, the factors were eliminated one by one from the data and efficiency was calculated in the absence of the removed factor. Eventually, paired-t-test and Pearson correlation test were used, and their results displayed the importance of all factors considered. However, according to Pearson correlation test, the most important factors (in order of significance) turned out to be reporting culture, flexibility, and formalization.
References
Acosta, Gabriel García, & Morales, Karen Lange. (2008). Macroergonomic study of food sector company distribution centres. Applied ergonomics, 39(4), 439-449.
Acquaah, Moses, Amoako-Gyampah, Kwasi, & Jayaram, Jayanth. (2011). Resilience in family and nonfamily firms: an examination of the relationships between manufacturing strategy, competitive strategy and firm performance. International journal of production research, 49(18), 5527-5544. Ahmad, Sohel, & Schroeder, Roger G. (2003). The impact of human resource management practices on operational performance: recognizing country and industry differences. Journal of operations Management, 21(1), 19-43.
Aigner, Dennis, Lovell, CA Knox, & Schmidt, Peter. (1977). Formulation and estimation of stochastic frontier production function models. Journal of Econometrics, 6(1), 21-37.
Andersen, Per, & Petersen, Niels Christian. (1993). A procedure for ranking efficient units in data envelopment analysis. Management science, 39(10), 1261-1264.
Azadeh, A, & Ebrahimipour, V. (2004). An integrated approach for assessment and ranking of manufacturing systems based on machine performance. International Journal of Industrial Engineering: Theory, Applications and Practice, 11(4), 349-363.
Azadeh, A, Ghaderi, SF, & Omrani, H. (2009). A deterministic approach for performance assessment and optimization of power distribution units in Iran. Energy Policy, 37(1), 274-280.
Azadeh, A, Salehi, V, Ashjari, B, & Saberi, M. (2014). Performance evaluation of integrated resilience engineering factors by data envelopment analysis: The case of a petrochemical plant. Process Safety and Environmental Protection, 92(3), 231-241.
Azadeh, A., Haghighi, S. M., Gaeini, Z. & Shabanpour, N. 2016. Optimization of healthcare supply chain in context of macro-ergonomics factors by a unique mathematical programming approach. Applied ergonomics, 55, 46-55.
Azadeh, A., Yazdanparast, R., Zadeh, S. A. & Zadeh, A. E. 2017. Performance optimization of integrated resilience engineering and lean production principles. Expert Systems with Applications, 84, 155-170.
Azadeh, A., Zarrin, M. & Hamid, M. 2016. A novel framework for improvement of road accidents considering decision-making styles of drivers in a large metropolitan area. Accident Analysis & Prevention, 87, 17-33.
Azadeh, Ali, Saberi, Morteza, & Jiryaei, Zahra. (2012). An intelligent decision support system for forecasting and optimization of complex personnel attributes in a large bank. Expert Systems with Applications, 39(16), 12358-12370.
279
Azadeh, MA, & Ebrahimipour, V. (2002). An integrated approach for assessment of manufacturing sectors based on machine performance: the cases of automotive and food and beverages industries. Paper presented at the Proceeding of the Second International Conference on Manufacturing on Complexity University of Cambridge, UK.
Azadeh, MA, & Jalal, S. (2001). Identifying the economic importance of industrial sectors by multivariate analysis. J. Fac. Eng. Univ. Tehran Iran 35 (3), 437–449.
Babajani, R., Abbasi, M., Taher, A. & Hamid, M. 2019. Integrated safety and economic factors in a sand mine industry: A multivariate algorithm. International Journal of Computer Applications in Technology, 60, 351-359.
Bastan;, M., Nahand, P. K., Samaneh Korlou & Hamid, M. 2019. Selection of a Biomass Product using a Hybrid Approach of BW-PROMETHEE. International Conference on Industrial Engineering and Operations Management Pilsen, Czech Republic.
Boussofiane, Aziz, Dyson, Robert G, & Thanassoulis, Emmanuel. (1991). Applied data envelopment analysis. European Journal of Operational Research, 52(1), 1-15.
Briguglio, Lino, Cordina, Gordon, Farrugia, Nadia, & Vella, Stephanie. (2009). Economic vulnerability and resilience: concepts and measurements. Oxford development studies, 37(3), 229-247. Carayon, Pascale, Hancock, Peter, Leveson, Nancy, Noy, Ian, Sznelwar, Laerte, & van Hootegem, Geert. (2015). Advancing a sociotechnical systems approach to workplace safety–developing the conceptual framework. Ergonomics, 58(4), 548-564.
Charnes, A., Cooper, W.W., Rhodes, E., 1978. Measuring the efficiency of DMUs. European Journal of Operational Research 2 (6), 429–444.
Cook, Wade D, Tone, Kaoru, & Zhu, Joe. (2014). Data envelopment analysis: Prior to choosing a model. Omega, 44, 1-4.
Dangayach, GS, & Deshmukh, SG. (2001). Practice of manufacturing strategy: evidence from select Indian automobile companies. International Journal of Production Research, 39(11), 2353-2393. Franco, E. C., Cazarez, J. A. D. & Zezzatti, C. A. O. O. 2019. Implementation of an Intelligent Model Based on Machine Learning in the Application of Macro-Ergonomic Methods in a Human Resources Process Based on ISO 12207. Advanced Macroergonomics and Sociotechnical Approaches for Optimal Organizational Performance. IGI Global.
Friedman, Lea, & Sinuany-Stern, Zilla. (1998). Combining ranking scales and selecting variables in the DEA context: The case of industrial branches. Computers & Operations Research, 25(9), 781-791.
Gittell, Jody Hoffer, Cameron, Kim, Lim, Sandy, & Rivas, Victor. (2006). Relationships, layoffs, and organizational resilience airline industry responses to September 11. The Journal of Applied Behavioral Science, 42(3), 300-329.
Habibifar, N., Hamid, M., Bastan, M. & Taher Azar, A. 2019. Performance Optimization of a Pharmaceutical Production Line by Integrated Simulation and Data Envelopment Analysis. International Journal of Simulation and Process Modelling, In press.
Haghighi, S. M. & Torabi, S. A. 2018. A novel mixed sustainability-resilience framework for evaluating hospital information systems. International journal of medical informatics, 118, 16-28.
280
Hale, A, Guldenmund, F, & Goossens, L. (2006). Auditing resilience in risk control and safety management systems. Resilience engineering: concepts and precepts. London: Ashgate, 270-295. Hamid, M., Barzinpour, F., Hamid, M. & Mirzamohammadi, S. 2018a. A multi-objective mathematical model for nurse scheduling problem with hybrid DEA and augmented ε-constraint method: a case study. Journal of Industrial and Systems Engineering, 11, 98-108.
Hamid, M., Hamid, M., Nasiri, M. M. & Ebrahimnia, M. 2018b. Improvement of operating room performance using a multi-objective mathematical model and data envelopment analysis: A case study. International Journal of Industrial Engineering & Production Research, 29, 117-132.
Hamid, M., Nasiri, M. M., Werner, F., Sheikhahmadi, F. & Zhalechian, M. 2019. Operating room scheduling by considering the decision-making styles of surgical team members: a comprehensive approach. Computers & Operations Research, 108, 166-181.
Hendrick, H. (2005). Macroergonomic Analysis of Structure (MAS). Handbook of Human Factors and Ergonomics Methods. CRC Press, Boca Raton, FL, 89.81-89.89.
Hendrick, H. (2005). Macroergonomic Analysis of Structure (MAS). Handbook of Human Factors and Ergonomics Methods. CRC Press, Boca Raton, FL, 89.81-89.89.
Hendrick, Hal W, & Kleiner, Brian. (2005). Macroergonomics: theory, methods, and applications: CRC Press.
Hendrick, Hal W. (1991). Ergonomics in organizational design and management. Ergonomics, 34(6), 743-756.
Hendrick, HW, & Kleiner, BM. (2001). Macroergonomics: An introduction to work system design (HFES issues in human factors and ergonomics book series volume 2).
Holden, Richard J, Or, Calvin KL, Alper, Samuel J, Rivera, A Joy, & Karsh, Ben-Tzion. (2008). A change management framework for macroergonomic field research. Applied ergonomics, 39(4), 459-474.
Huber, Stefanie, van Wijgerden, Ivette, de Witt, Arjan, & Dekker, Sidney WA. (2009). Learning from organizational incidents: Resilience engineering for high‐risk process environments. Process Safety Progress, 28(1), 90-95.
Jamili, A., Hamid, M., Gharoun, H. & khoshnoudi, R. Developing a Comprehensive and Multi-Objective Mathematical Model for University Course Timetabling Problem: A Real Case Study. Conference: Proceedings of the International Conference on Industrial Engineering and Operations Management,Paris, France, 2018. 2108,2119.
Karsh, Ben-Tzion, & Brown, Roger. (2010). Macroergonomics and patient safety: The impact of levels on theory, measurement, analysis and intervention in patient safety research. Applied ergonomics, 41(5), 674-681.
Karsh, Ben-Tzion, & Brown, Roger. (2010). Macroergonomics and patient safety: The impact of levels on theory, measurement, analysis and intervention in patient safety research. Applied ergonomics, 41(5), 674-681.
Khanna, Tarun, & Palepu, Krishna G. (2006). Emerging giants: Building world-class compaines in developing countries. Harvard business review, 84(10).
281
Park, I., Sharman, R., Rao, H. R. & Upadhyaya, S. On the Two Factors Affecting Information Systems Success in the Extreme Event Context. Workshop on E-Business, 2009. Springer, 181-185. Powley, Edward H. (2009). Reclaiming resilience and safety: Resilience activation in the critical period of crisis. Human Relations, 62(9), 1289-1326.
Rivera-Rodriguez, A Joy, McGuire, Kerry, Carayon, Pascale, Kleiner, Brian, Wears, Robert, Robertson, Michelle, Waterson, Patrick. (2013). Multi-Level Ergonomics Determining How To Bound Your System. Paper presented at the Proceedings of the Human Factors and Ergonomics Society Annual Meeting.
Rivera-Rodriguez, A Joy, McGuire, Kerry, Carayon, Pascale, Kleiner, Brian, Wears, Robert, Robertson, Michelle, . . . Waterson, Patrick. (2013). Multi-Level Ergonomics Determining How To Bound Your System. Paper presented at the Proceedings of the Human Factors and Ergonomics Society Annual Meeting.
Rose, Adam. (2004). Defining and measuring economic resilience to disasters. Disaster Prevention and Management: An International Journal, 13(4), 307-314.
Sheffi, Yossi, & Rice Jr, James B. (2005). A supply Chain View of the resilient Entreprise. MIT Sloan management review, 47(1).
Sherman, H David, & Zhu, Joe. (2012). Analyzing performance in service organizations. Image. Sutcliffe, Kathleen M, & Vogus, Timothy J. (2003). Organizing for resilience. Positive organizational scholarship: Foundations of a new discipline, 94, 110.
Tofallis, Chris. (2001). Combining two approaches to efficiency assessment. Journal of the Operational Research Society, 1225-1231.
Wang, J., Gao, F. & Ip, W. 2010. Measurement of resilience and its application to enterprise information systems. Enterprise Information Systems, 4, 215-223.
Yazdanparast, R., Hamid, M., Azadeh, M. A. & Keramati, A. 2018. An Intelligent Algorithm for Optimization of Resource Allocation Problem by Considering Human Error in an Emergency Department. Journal of Industrial and Systems Engineering, 11, 0-0.
Zhalechian, M., Torabi, S. A. & Mohammadi, M. 2018. Hub-and-spoke network design under operational and disruption risks. Transportation Research Part E: Logistics and Transportation Review, 109, 20-43.
Zhang, W.-J. & Lin, Y. 2010. On the principle of design of resilient systems–application to enterprise information systems. Enterprise Information Systems, 4, 99-110.
Zhu, Joe. (1998). Data envelopment analysis vs. principal component analysis: An illustrative study of economic performance of Chinese cities. European Journal of Operational Research, 111(1), 50-61.
282
Appendix 1. Questions of the questionnaire
Resilience engineering questions
Management commitment Do managers find themselves committed to solving problems
when economic crises occur?
Reporting culture Are you easily reporting your financial problems to senior
managers?
Learning Does your organization learn from past recessions and economic
crises and use them to deal with the coming economic crises?
Awareness Do you have a good understanding of your organization's
relationships with other organizations?
Preparedness Do you think your organization is capable of solving the
economic problems that may occur in the future?
Flexibility
In times of boycott or recession, is the organization capable of accessing essential information and resources in a variety of ways and places?
Macro-ergonomics questions
Complexity
Are there different communication tools and channels between the components of the organization?
Is there integration between the channels and the tools in the previous question?
Formalization
Is there a complete and detailed explanation of the work process and its steps?
Are employees required to fully respect the business processes of the preceding question and are subject to abuse?
Centralization
Are there real and virtual partitions between employees, supervisors, and managers?
If the system crashes, is your department given enough authority to make a decision?
How much do you need your department manager's approval for your work and do you need senior management's approval for your department?
Economic questions
Is your annual salary commensurate with what you do?
Are there appropriate benefits and facilities for company employees? Are staff salaries and benefits paid on time?