Investigating Feedbacks between Sediment Dynamics and
Oyster Growth Using an Idealized Differential Equation Model
Rachel M. Housego
University of North Carolina at Chapel Hill
Institute of Marine Science and Curriculum for the Environment and Ecology
Abstract:
Sedimentation has been identified as an important factor that can limit oyster reef restoration success. Previous field studies have demonstrated that high relief reefs are more productive and resilient to disturbance than low relief reefs, in part because increasing the reef height can reduce sedimentation and enhance oyster growth. In this study we investigated the relationship between initial reef height and reef survival using a simple model. The model, based on Jordan-Cooley et al. (2011), contains three coupled differential equations that describe
changes in oyster volume, sediment volume, and shell volume per unit area of reef with time. In our study, the terms for oyster growth, sediment deposition, and erosion were modified from the Jordan-Cooley model to better represent these processes. A sensitivity analysis was then
performed to investigate the ways in which parameters such as flow speed, sediment grain size, and ambient food concentration affect model results. Our results suggest that the shape of the sediment concentration profile in the water column relative to the initial reef height is important for determining whether a reef will survive. Parameters that describe oyster growth will control the productivity of the reef and the final reef height, if the reef does survive. Therefore, our study creates a tool that can be used to predict the relative success of restored oyster reefs under
different environmental conditions and the impact of different physical parameters on reef restoration success.
1. Introduction:
Oysters are ecosystem engineers that provide important contributions to the biological, physical, and chemical processes in the estuarine environment. Oyster reefs contribute to the productivity of the estuarine system because the hard biogenic substrate oysters provide is an important habitat for numerous species of fish and invertebrates (Breitberg, 1999). Furthermore, oysters also help maintain water quality by filtering nutrients, phytoplankton, and sediment from the water column (Kellogg et al., 2013). Field studies in a North Carolina tidal creek estuary demonstrated that oysters reduced levels of chlorophyll-a by 10-25% and decreased levels of fecal coliforms by up to 45% (Cressman et al., 2003). Additionally, the presence of oyster reefs attenuates waves, minimizing erosion and preserving adjacent wetland environments (Meyer et al., 2008). Overall, the health and productivity of the estuarine environment is improved with the presence of the oysters.
loading of anthropogenic pollutants (Grabowski et al., 2007). This oyster population loss has contributed to the decline of ecosystem health in these systems. In the Chesapeake Bay, degradation of water quality has been demonstrated to be both a cause and effect of oyster population decline. Oysters in the Chesapeake were estimated to filter the volume of the entire water body in 3.3 days in the later 1800s. This process improved the water quality by removing nutrients and suspended sediment (Newell, 1988). At current oyster population levels, it would take 325 days for the oysters to filter the entire volume of the Chesapeake, and overall ecosystem health has simultaneously declined in the region. Consequently, over the past several decades scientists and local managers have pushed for oyster reef restoration to recover ecosystem services. Despite the broad scale of the restoration efforts, sanctuary reef construction has failed to yield consistent positive results (Powers et al., 2009). Failures in reef restoration efforts can be attributed to smothering by sediment, hypoxia/anoxia, poor larval recruitment, and disease (Powers et al. 2009).
While reef restoration has been largely unsuccessful, a few restoration efforts have achieved good results. A restoration effort in the Great Wicomico River in Virginia conducted by) created the largest metapopulation of oysters restored in any nation worldwide (Schulte et al., 2009). Both low reliefs and high relief reefs were constructed during the restoration effort. The high relief reefs were vastly more successful than the low relief reefs, containing a fivefold higher oyster density after three years. The high relief reef was also more resilient to disturbance and experienced less sedimentation than the low relief systems. This trend strongly suggests the presence of alternative stable states influenced by sediment dynamics that affect the outcome of reef restoration efforts (Shulte et al., 2009).
Jordan-Cooley et al. (2011) hypothesized that the interaction between sedimentation and reef height is one mechanism driving alternative stable states on oyster reefs (2011) based on the high rates of sedimentation reported to negatively affect oyster growth (King et al., 2010). Additionally, the oysters must expend energy to filter the sediment from the water column which increases the rates of disease and mortality on the reef (Barillé et al., 1997). When a high
concentration of sediment occurs, the gills of the oysters become clogged and the oysters suffocate and die (Adams et al, 1995). Consequently, high rates of sedimentation negatively impact the success of restored reefs (Powers et al., 2009).
Interactions between reef height and sedimentation are hypothesized to result in
alternative stable states, because suspended sediment tends to be concentrated lower in the water column (van Rijn, 1984). As a result, increasing the relief of the reef enables some of the oysters to escape smothering from sediment, because less deposition is occurring higher in the water column (Schulte et al., 2009). Additionally, as the oysters become covered by sediment, fewer oysters are filtering the water column, leading to an increased concentration of sediment above the reef. The higher sediment concentration increases the rate of sedimentation on the reef. This positive feedback mechanism is hypothesized to inhibit the reef from recovering once the live oyster population is diminished due to sediment accretion (Jordan-Cooley et al., 2011).
the Jordan-Cooley model to include more accurate representations of physical processes in order to make the model more reflective of the natural environment. To understand how each
modification affected the model output, changes in the model behavior were recorded. After each modification the revised term was compared to the Jordan-Cooley model to assess how their theoretical model related to our process based approach. Once the model was revised, a sensitivity analysis was performed to identify how specific physical parameters, such as shear stress and settling velocity, affect oyster reef success and to gauge the relative importance of the physical processes affecting oyster reef development. Consequently, our model represents a tool that may be used to predict the relative success of restored reefs in different physical
environments.
2. Model Development
2.1 Introduction to the Jordan-Cooley Model
The starting point for this project was a model created by Jordan-Cooley et al. (2011). The Jordan-Cooley model calculates changes in the volumes of live oyster (O), shell (B), and sediment (S) with respect to time (t) as the oyster reef develops, using three coupled differential equations (Eqs. 1-3).
Mortality Growth Shell Mortality Degradation Deposition Erosion
( )(1
/ )
( )
(1
( ))
( )
(1
( ))
FO Cg
dO
rOf d
O k
f d O
f d O
dt
dB
f d O
f d O
B
dt
dS
S Cge
dt
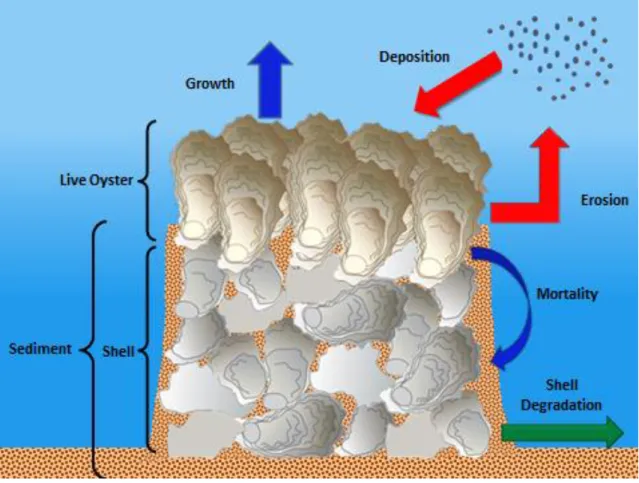
Oyster volume increases logistically due to growth and decreases due to mortality from predation, disease and smothering by sediment. As the oysters die they are converted to shell, increasing the shell volume. Shell volume decreases as the shell degrades due to weathering. Change in sediment volume is controlled by deposition and erosion. All volumes are represented as volume (m3) per m2 of seafloor so that volume can be easily converted to height. Because the change in oyster volume is governed by the rate of oysters being smothered by sediment and the rate of sediment, deposition onto the reef is determined by the height of the oyster layer, this system of equations simulates the interactions between oyster survivorship and sediment dynamics (Fig. 1).
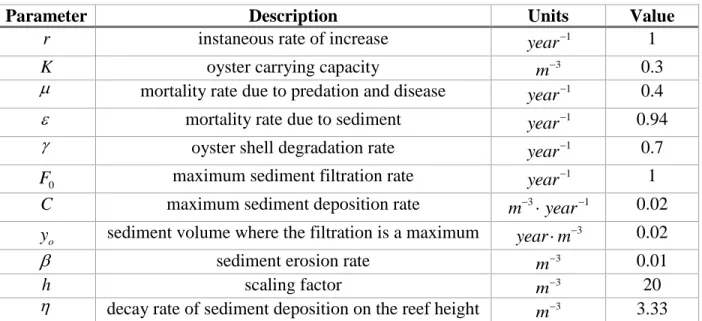
In the Jordan-Cooley model oyster growth is modeled as a logistic growth model based on an instantaneous growth rate (r) and a carrying capacity (k). Oyster mortality is composed of two terms, natural mortality such as predation and disease (µ) and an elevated mortality that occurs when oysters are smothered by sediment (ԑ). Shell degradation is modeled as a constant
(1)
(2)
based on the pH of the surrounding environment (γ). In the sedimentation term erosion is
modeled as a loss of a constant proportion of the sediment on the reef (β). Deposition is modeled as an exponential decay function based on a maximum deposition rate (C) and a filtration rate (F). Model parameters are summarized in Table 1.
In the model g represents a modification to sediment deposition that exponentially reduces the amount of sediment deposited as the reef height increases. The decay rate constant (η) is determined from the suspended sediment concentration profile in the water column (Eq. 4):
(O B)
g
e
The function f(d) represents the volume of oysters that are not smothered by sediment (Eq. 5). In the Jordan-Cooley model, f(d) is set up as function that assumes that O/ 2 oysters must be covered by sediment before their performance is affected, or that half of an individual oyster must be covered by sediment to be negatively impacted (Eq. 6).
1 ( ) 1 / 2 hd f d e
d O B S
Because individual oysters grow at a range of elevations relative to the reef top on real reefs, for our model f(d) is set up as a scaling factor representing the fraction of oysters above the sediment layer. The scaling factor is introduced when the height of the sediment layer is between the top of the shell layer and the top of the oyster layer because the oyster layer is partially covered by sediment (Eq. 7).
( ) O B S
f d
O
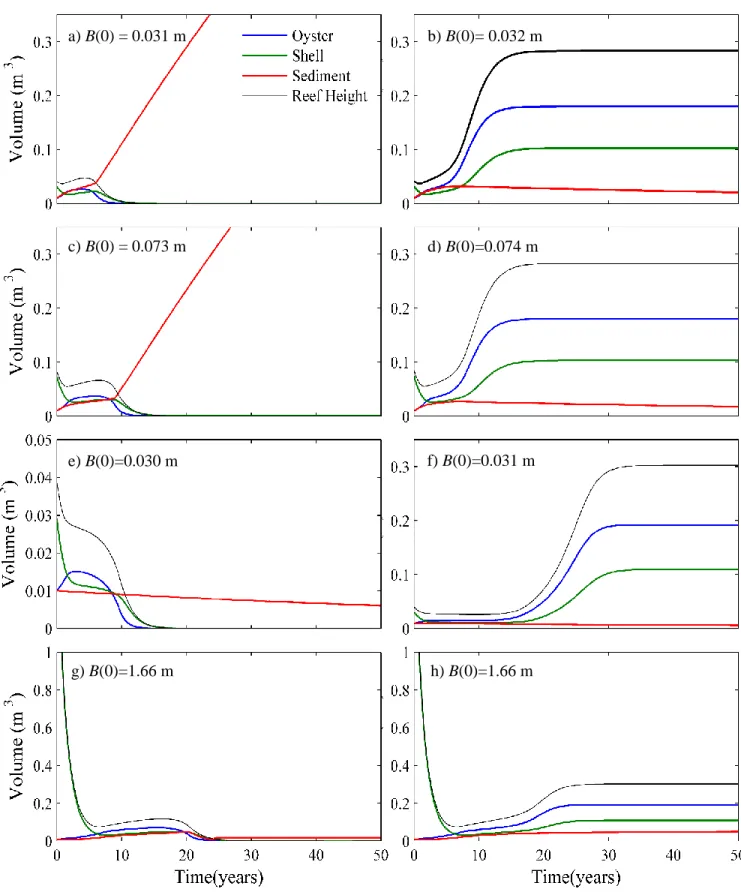
For all model runs conducted during this study, the initial conditions were O(0) =.01 m3, S(0) = .01 m3, and B(0) was varied to determine the bifurcation point. Therefore, the bifurcation point is expressed in terms of shell volume B(0), and represents the minimum initial height the reef would need to survive. As a result of the different f(d) terms, our initial model deviates slightly from the Jordan-Cooley model. The bifurcation point occurs when B(0) is between 0.11 m3and 0.12 m3 for the Jordan-Cooley model. For our implementation of the model the same stability shift is seen when B(0) is between .031 m3 and .032 m3 (Fig. 2a,b).
2.2 Correction for Volume Fraction
In the Jordan-Cooley model oyster, shell, and sediment volumes per unit plan area were directly equated to layer height. Physically this model representation is not realistic, because the presence of shell elevates the position of the sediment on the reef since the sediment can only occupy space not already taken up by shell (Fig. 3). Therefore, the Jordan-Cooley model is incorrectly calculating the position of the sediment within the reef. To account for the presence of shell, a volume fraction term was introduced into the model. The volume fraction was assumed to be constant across the entire reef. Dividing each volume (O, B, S) by its respective volume fraction (γO, γB, γS) yields the height of each layer (hO, hB, hS) (Eqs. 8-10). Since the fraction of oysters above the sediment is dependent upon the position of sediment within the reef, the scaling factor (f) was recalculated using the new layer heights (Eq. 11).
(4)
(5)
(6)
O B s S O B O B O h B h S hIf hB<hS <hO +hB:
( ) O B S
O
h h h
f d
h
When a 3:2 ratio of oyster volume to sediment volume, and shell volume to sediment volume were used in the model, introducing the volume fraction term moved the bifurcation point from B(0) =.032 m3 to B(0) =.074 m3 (Fig. 2c,d). The bifurcation point increased because
the same volume of sediment now reaches higher on the reef than estimated by the Jordan-Cooley model. Therefore, the reef must have a higher initial height for reef growth to outpace sediment accumulation. This 3:2 ratio of oyster and shell to sediment was used for all subsequent model runs.
2.3 Modification of the Growth Term
In Jordan-Cooley (2011), the term for oyster growth assumed logistic growth with a carrying capacity of 0.3 m3 of oysters/m2 of reef. Once the oyster volume reached the carrying capacity the growth rate became zero. The slope of the growth term is determined by a constant representing the instantaneous rate of increase. To understand whether a logistic growth model accurately simulates oyster growth, our revised model utilized a process-based approach. The revised growth rate represented biological and physical processes occurring on oyster reefs and incorporates filtration rate, assimilation, respiration, average oyster biomass, ambient food concentration, total particulate content, and oyster densities as parameters affecting oyster growth (Fig. 4). The parameters in the revised growth term are summarized in Table 2. The revised growth rate is based predominantly on a time-dependent energy-flow model created by Powell et al. (1992) that predicts changes in oyster size frequency distribution as a function of net production. The governing equation (Eq. 12) in the Powell et al. model is:
NP A R
Net production (NP) represents the increase in oyster biomass from both somatic tissue (tissue forming the body of the organism) and reproductive tissue (gametes) (Eq. 12). Net production is determined from the oyster’s energy budget and is expressed as the difference between the rate of energy uptake from food by the oyster (assimilation, A) and the rate that energy is being consumed by the oyster (respiration, R). Therefore, in the revised model the system is assumed to be self-seeding because the growth is intended to describe both adult growth and juvenile recruitment, but does not distinguish among those explicitly.
Assimilation is a function of filtration rate (FR), ambient food concentration (C), and a density dependent reduction in food availability (fr) (Eq. 13).
(8)
(9)
(10)
(11)
0.75 (1 ) AFR C fr
The filtration rate controls how quickly food particles are taken up by the oyster. Filtration rate (FR) is a function of oyster biomass (W) and water temperature (T) (Eq. 14).
0.317 0.669 0.95
10 log 3.38 10 1 0.01 2.95 0.0418 Ψ W T
FR
An oyster with a larger biomass has the capacity to filter larger volumes of water and therefore has a higher filtration rate. At lower water temperatures the metabolic processes of the oyster slow down and depress the filtration rate. The filtration rate is also reduced at high temperatures because the oyster becomes stressed. At high particulate concentrations (ψ), a reduction in filtration rate also occurs due to overloading of the digestive system. On the reef the amount of energy available for uptake by the oysters is dictated by the ambient food
concentration. Multiplying the filtration rate by the ambient food concentration yields a rate of food uptake for an individual oyster. The assimilation efficiency for oysters is considered to be 75% of the food energy, which means that 75% of the energy from the ingested food is used for growth (Powell et al., 1992).
Food availability is also limited by the oyster density due to increased competition for resources. The function fr is a fractional reduction in food availability based on oyster density (Eq. 15). 1 1 .001 rd k fr k e
The function fr was selected so that food availability was not affected at low oyster densities. The constant k sets the maximum % reduction, and the constant r determines the oyster density above which food availability is reduced and how quickly the function reaches the maximum % reduction as oyster density increases further. One assumption of the revised growth term is that the average filtration rate and ambient food concentration remain constant over time. Since these terms are constant, the shape of the growth curve is most strongly governed by the fractional reduction in food availability function (Fig. 5).
In the Powell et al. model, respiration was expressed in units of µL of oxygen consumed per hour per gram of oyster biomass. Partial pressure of oxygen varies as a function of water depth so their equation could not be easily adapted for this model. Respiration represents the rate of energy consumption of the oyster. We assumed that, for a live oyster, rate of energy
consumption cannot exceed the rate of energy uptake (assimilation). Under this assumption, net production is zero when the growth rate is minimized. Our respiration equation was determined by solving for an equation that satisfied this condition (Eq. 17).
(1
)
R
A
k
The plot of the change in net production of an individual oyster with increasing total oyster volume has a shape that is the inverse of the f function, because as the percent reduction in food availability increases the net productivity of an individual oyster decreases (Fig. 5). This inverse relationship demonstrates the dominance of the f function in determining the shape of the growth curve.
(15) (13)
The equations in the Powell et al. model were all represented in terms of oyster biomass. For the model presented here the oyster biomass had to be converted into oyster volume. By converting volume to length to length and then from length to volume. The conversions from biomass to length and from length to volume were done using equations determined by fitting a curve to experimental data. Once all the appropriate unit conversions were complete the r constant in the revised growth rate was adjusted so that the maximum of the growth rate curve matched the maximum of the original growth rate. Jordan-Cooley et al. (2011) derived the constants for their logistic growth model from field studies, and as a result, their growth model operates on a scale that is reflective of the natural environment. Consequently, any subsequent changes to the bifurcation point can be attributed to the differences between the shapes of the two curves and will highlight the differences between logistic and process-based growth terms.
Comparing the two growth curves, the logistic model from Jordan-Cooley et al. exhibits behavior that is similar to the revised process-based model (Fig. 6). The increasing portion of each curve behaves identically. Once the carrying capacity is reached an immediate cessation of oyster growth occurs in the Jordan-Cooley model, while in the revised model suggests a more gradual recession of growth. Changing the form of the growth rate term moved the bifurcation point from B(0) =.074 m3 to B(0) = .031 m3 (Fig. 2e,f). The lower initial shell volume now required for the reef to survive probably occurs because the growth rate is higher in the revised model when the oyster volume exceeds the carrying capacity.
2.4 Modification of the Sediment Deposition and Erosion Terms
The net rate of sediment accumulation is equal to the rate of sediment deposition minus the rate of sediment erosion. In the Jordan-Cooley sedimentation equation (Eq. 3), the first term represents erosion and the second term represents deposition. The rate of sediment erosion is proportional to the volume of sediment on the reef. Deposition was modeled by Jordan-Cooley as a reduction to the maximum possible deposition rate based on reef height. At the sea floor the deposition rate is at a maximum and decreases exponentially as reef height increases. The Jordan-Cooley model also incorporates a deposition reduction based on filtration because
filtration removes sediment from the water column that would otherwise have been deposited on the reef.
Sedimentation is a physical process that depends on factors such as shear stress, settling velocity, and the sediment concentration profile in the water column. Additionally, the relative size of deposition and erosion depends on the position of sediment within the reef. In the revised model, deposition and erosion were modified to better represent the physical processes at work.
For the erosion term (E), we use the expression (Nielsen, 1992) (Eq. 16) 0.1 3 1.5 2 0.0003 s w w
c s w
c w
g d
E g d
Where w s w w g d
c 0.05
The magnitude of the erosion term is governed by the net difference between stabilizing and destabilizing forces acting on the sediment. Gravity, g, stabilizes the sediment on the reef. Sediment resuspension occurs when enough shear stress is acting on the sediment grain to overwhelm this gravitational force (Fig. 7). The magnitude of shear stress needed for erosion to occur is dependent on the diameter and the density of the sediment grain, because more force will be needed to resuspend larger, denser sediment particles. Erosion begins when the Shields parameter, θ, exceeds the critical Shields parameter, θc, the first value where there is enough shear stress for sediment resuspension. When the shear stress is less than the critical shear stress, no erosion will occur. It is assumed that the reef is in an environment with a steady current and the average water velocity does not vary over time. Grain size is assumed to be constant across the reef and it is also assumed that the average grain size does not change over time.
The magnitude of shear stress decays within the reef because the reef structure shelters the sediment from the erosive force of the water by exterting a drag force on the water that reduces current below the top of the reef. Whitman and Reidenbach (2012) measured currents and turbulence above and between vertically oriented oysters on a reef using acoustic Doppler velocimeters. We modeled our shear stress curve on their results which showed an exponential decay of shear stress within the reef structure. Consequently, the closer the sediment layer is to the surface of the reef the more erosion it experiences. A study conducted by Ghisalberti et al. (2004) examining the effect of aquatic macrophytes on flow yielded a similar near bed shear stress profile within a model sea grass canopy. In our model when the top of the sediment is below the top of the reef, shear stress is modeled as an exponential decay with increasing distance below the reef top (Fig. 7). The shear stress profile within the reef is determined by a constant m, representing the decay rate of shear stress within the reef. This parameter was set to 0.4 cm to be consistent with the results of the Whitman and Reidenbach (2012) study. When the sediment is above the reef, the shear stress does not experience the same sheltering effect and the shear stress was therefore set to a constant value. Consequently, different equations were used for shear stress when the sediment height was less than the height of the reef (Eq. 18) and when the sediment height was greater than the height of the reef (Eq. 19). Utilizing these two different equations our shear stress profile has a similar shape and behavior to the shear stress profiles determined by the field studies (Fig. 7).
When the sediment height is beneath the top of the reef the shear stress is given by:
( )
2 *
o B s
h h h m
u
e
When the sediment height is above the reef, shear stress is calculated
2 *
u
*
0.05
u
u
(18)
(19)
(20)
The value of u* is typically between 5% and 20% of the current velocity, u, near the top of the bottom boundary layer, depending on the roughness of the bottom. Whitman and
Reidenbach (2012) observed 𝑢∗ = 0.01 ∙ 𝑢 at the top of the oyster reef in their study. Comparing
the erosion profiles for the Jordan-Cooley and revised models it is evident that the magnitude of the erosion term is now more strongly governed by the position of sediment within the reef (Fig. 8). In the revised model no erosion takes place until the sediment is within several millimeters of the top of the reef at which point it increases exponentially, simulating the sheltering effect of the reef structure. Once the sediment is above the top of the reef, the magnitude of the erosion term decreases linearly as the height of the sediment level increases. The revised erosion term also operates on a much higher order of magnitude than the original erosion term.
Similarly to the erosion term, the deposition term in the Jordan-Cooley model was not based on physical parameters. The deposition model in the Jordan-Cooley model was set up as a function of the maximum sediment deposition rate and the maximum filtration rate using a decay of deposition that is dependent on reef height (Eq. 3).
Our revised model was set up to make the deposition simulation more process based. The rate of deposition was calculated from the sediment concentration just above the reef (c) and the settling velocity (Ws)
s D c W
The settling velocity determines how quickly an individual sediment grain will settle on the reef. The magnitude of the settling velocity is determined by the net difference between the downward gravitational force which is determined by the gravitational acceleration (g), the sediment density (ρs), and the sediment diameter(d) and the upward buoyancy force which is determined by the density(ρw ) and viscosity(υ) of the water (Eq. 23). Larger, denser sediment grains settle have a faster settling velocity because the downward gravitational force is larger relative to the viscous drag force resisting motion (Fig. 7).
2 18 s w s w g d
W
For our model we assumed that the combination of vertical mixing and sediment settling resulted in a Rouse sediment concentration profile. The Rouse concentration profile represents an exponential decrease in sediment concentration with increasing height above bottom, meaning that the sediment concentration is higher at the bottom of the water column. Sediment
concentrations are typically higher near the bed because sediment grains are constantly sinking; meanwhile, turbulence created by the frictional interactions between the current and seafloor mix sediment vertically resulting in an upward diffusive flux.. The net balance between settling sediment, resuspension, and diffusion of sediment by benthic turbulence results in an exponential sediment concentration profile (Fig. 7). The position of the sediment concentration profile in the water column determines how much sediment will be deposited on the reef at each height in the water column. * 0.4 ( ) s W u O B a O B
h h h a
c c
h h h a
The two primary factors controlling the sediment concentration profile are grain size and water velocity (Eq. 24, Fig. 9). In the revised deposition model, the reduction to deposition as a result of oyster filtration was omitted because sediment taken up by oysters is largely deposited as pseudofeces and feces. Because the sediment particle diameter is assumed to be constant, the settling velocity is a constant. Consequently, the magnitude of sediment deposition is governed mostly by the location of the top of the reef within the Rouse concentration profile.
The shapes of the deposition profiles in the Jordan-Cooley and revised models are similar (Fig. 10), because both models were designed using the same principle of an exponential
reduction to sediment deposition with increasing reef height. However, making the model more process based made deposition operate at a much higher order of magnitude than in the Jordan-Cooley model. Additionally, the revised model enables the model results to be connected back to physical parameters.
Adjusting the sedimentation rate moved the bifurcation point from B(0) =.031 m3 to B(0) = 1.67 m3 (Fig. 2g,h). This shift in the bifurcation point is likely because sediment deposition is now occurring at a much more rapid rate and the oyster beds must start higher above the surrounding sediment for growth to outpace sediment accumulation. Additionally, in our revised model, erosion does not remove sediment from the reef until the sediment is near the reef surface, while erosion was a constant process in the Jordan-Cooley model, even if the sediment layer was well beneath the top of the reef. This difference in the treatment of erosion in the two models represents a fundamental change to a more realistic erosion rate.
3. Equation Properties and Numerical Solution Methods
After each phase of the model revision, the model solution was computed using three different numerical methods, ode45, ode23s, and Runge-Kutta (1000 steps) for initial values on either side of the bifurcation point to capture both stable states. The model outputs from the three methods were compared to determine how the equation properties and the accuracy of the
numerical solution were affected by each revision. Results showed that the ode45 and ode23s solvers produced similar results for every stage of the model revision. When the reef survived the Runge-Kutta solution was consistent with the other two methods, however if the reef died the Runge-Kutta solution was not in agreement with the other two numerical methods. While both ode45 and ode23s generated smooth solution curves, the Runge-Kutta output showed rapid variation in the solution. This increased variability of the slope demonstrates that the model has become a stiff system of differential equations with the introduction of the revised sedimentation term.
The increased stiffness of the revised model can be attributed to the interaction between the deposition and erosion terms. All of solutions were consistent for the revised model from zero to twenty years. For earlier time values, the sediment is below the top of the reef for our initial conditions. Because the reef acts as a buffer preventing erosion the rate of sediment accumulations is controlled primarily by the deposition term. However, as time progresses and sediment accumulates, the erosion term is introduced as sediment approaches the top of the reef. At this point the slope of the sedimentation term is determined by the interaction of both
deposition and erosion terms and the relative strength of each process varies based on the
position of the sediment within the reef, resulting in a more rapid change in slope. The point where the inconsistency between numerical methods begins (t= 25 years) corresponds to the point where the erosion term is introduced. Prior to this point erosion was zero because the sediment was far below the surface of the reef and there was not sufficient shear stress to cause erosion. Consequently, the revised model is likely has increased stiffness when the deposition and erosion terms are interacting than when only one of these two terms is governing the change in sediment volume. The increased stiffness likely occurs because the erosion (E) and deposition (D) terms are much larger in magnitude than the net difference between the two terms (dS/dt). This characteristic is inherent to sediment dynamics and is one of the reasons that sediment dynamics are so difficult to accurately model. Consequently, based on this analysis a stiff equations solver ode23s was used to perform the revised model runs. While ode23s has a lower order of accuracy than ode45, it also improves model runtime and eliminates unwanted solution behavior. Additionally, the increased uncertainty of ode23s is much smaller than the uncertainty associated with the model parameters.
4. Sensitivity Analysis
After the revised model was developed, a sensitivity analysis was performed to evaluate the model’s responses to different parameters. Parameters in the growth, erosion, and deposition terms were tested to identify how the output changed in response to variations in each equation of the model. Parameters were varied one at a time while all others remained constant to bifurcation point and the stable state reef height as outputs. Each parameter was tested across a range so 8-15 points were distributed roughly evenly on either side of the bifurcation point.
3.1 Sensitivity of Bifurcation Point to Model Parameters
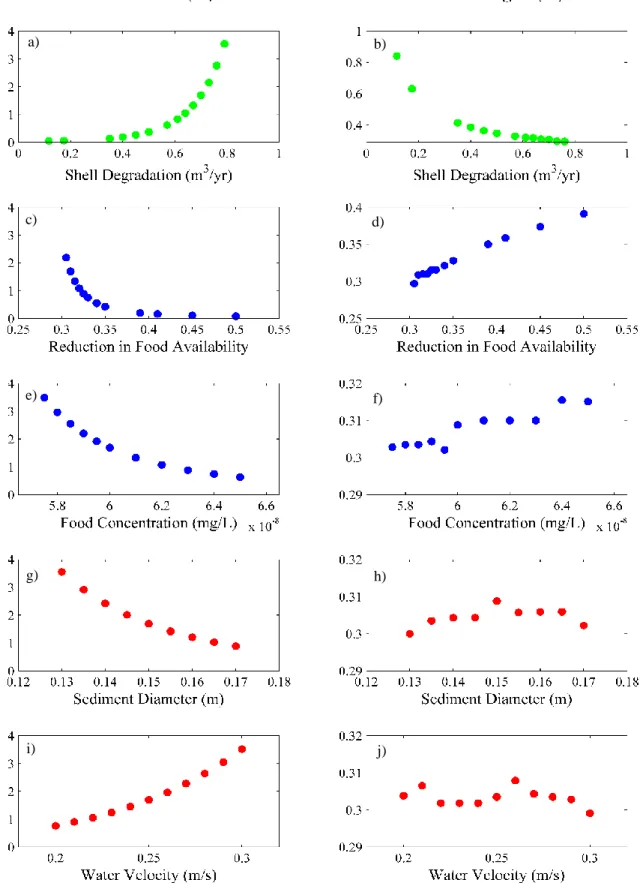
The birfurcation point is the minimum initial shell layer height required for the reef to survive under the initial conditions of the environment (e.g. oyster growth rate, sediment availability). The sensitivity of the birfucation point was tested against a number of model attributes. Shell degradation rate was varied over a range from 0.12 to 0.83 m3/yr, and rapid
increases in bifurcation point occurred when the shell degradation rate was increased (Fig. 13a), More shell is required for the oysters to maintain a position above the sediment layer when the shell is lost more quickly. Therefore, shell degradation most strongly affected reef survivorship when the initial ratio of shell:live oyster is used and when the initial shell volume is large.
The bifurcation point decreases exponentially with ambient food concentration (Fig. 13c) because when the ambient food concentration is higher more energy is available for growth. Ambient food concentration likely has such a strong impact on the bifurcation point across such a small range of values because in the growth equation assimilation increases linearly with ambient food concentration (Eq. 13).
The roughly linear decrease in bifurcation point with increasing grain size (Fig. 13g) demonstrates that the Rouse profile is more dominant than the settling velocity in controlling the amount of deposition that is occurring on the reef. Settling velocity increases with grain size (Eq. 22) .If settling velocity was the dominant process controlling the amount of deposition on the reef the bifurcation point would have increased with grain size because deposition would be occurring more rapidly. However, with a larger grain size the sediment becomes more
concentrated at the bottom of the water column in the Rouse profile and less deposition occurs higher on the reef. This means the reef will now be able to survive at a lower initial height.
The approximately linear increase in bifurcation point with water velocity (Fig. 13i) shows once again that the Rouse profile is a dominant process affecting sedimentation on the reef. With increased current velocity the rate of sediment erosion would increase. If this were the dominant mechanism affecting reef survival, the bifurcation point would decrease with increasing velocity due to the lower level of sediment in the reef. However because the velocity of water also alters the sediment profile, with higher velocities shifting more sediment higher in the water column, deposition increased with increasing velocity for the range of values tested.
3.2 Sensitivity of Maximum Reef Height to Model Parameters
The reef height analyzed in this section was the stable state reef height at the first B(0) value where the reef survived. Reef height decreases when the rate of shell degradation increases because a greater volume of shell is removed from the system under these conditions (Fig. 13b). Increases in both the ambient food concentration and the k value increase the growth rate of the oyster (Fig. 13d,f). As the growth rate increases the volume of the oyster layer increases
elevating the height of the reef.
No apparent correlation was observed between reef height and sediment grain size (Fig. 13h,j). This lack of relationship is found because the sedimentation term does not directly influence the height of the reef. Smothering oysters due to sedimentation only converts the live oyster to shell mass. It is the degradation of the shell that decreases reef height. Sediment smothering prevents the oysters from continuing to increase the reef height, but it does not directly influence the reef height. Therefore, the revised model shows that the parameters controlling sedimentation are important for reef survivorship, while parameters affecting oyster growth determine the reef productivity.
5. Discussion:
Many of the bifurcation points recorded during the sensitivity analysis were within the 0.25 to 0.42 m range that was found to be successful during one of the most effective field restoration projects to date conducted by Schulte et al. (2011). The Jordan-Cooley model had a bifurcation point of only 3 cm. As seen in both the Lenihan and Peterson (1998) and Schulte et al. (2011) studies, oyster reefs with higher vertical relief are more successful. Therefore, the revised model is operating on a more realistic scale than the Jordan-Cooley model because the sedimentation equation is now based on environmental parameters and is now operating on a more appropriate scale.
ambient food concentration was varied across a range of only 1 ∙ 10-8 g/mL, the bifurcation point
increased from 0.62 m to 3.45 m (Fig. 13e). This results suggest that the revised model is too sensitive to the ambient food concentration because such a small increase would not be expected to have such a profound impact on reef success. As a result, the variation in the bifurcation point predicted by the model for environments with different ambient food concentrations probably overestimates the influence of ambient food concentration on reef success. Alternative functions for the density dependent fractional reduction in food availability (fr) could be used to assess whether this is a universal trend or an artifact of the equation we chose to use. Understanding unrealistic components of the model prevents management decisions from being made based on unrealistic model results.
The sensitivity analysis also allowed us to gauge how physical processes impact reef restoration success. Shell degradation was varied over a range from 0.12 to 0.83 m3/yr. Rapid increases in bifurcation point occurred when the shell degradation rate was increased because more shell is required for the oysters to maintain a position above the sediment layer when the shell is lost more quickly (Fig. 13b). This trend suggests that reefs are not successful in
environments where shell degradation is high and could present a problem for future oyster populations if ocean acidification reaches into estuaries. Because the slope of the curve is much smaller for lower rates of shell degradation the model output is much more sensitive to changes in shell degradation rates by > 0.6 m3/yr. Shell degradation rates can vary between 0.365 and 0.73 m3/yr when the pH of the water is between 7.2 and 8 with faster degradation rates occurring at lower pHs (Waldbusser et al., 2011). This suggests that restoration efforts will be more
successful in environments with a pH of > 7.5 (Waldbusser et al., 2011). However, it is
important to note that for our model runs we started out with extremely low live oyster volumes and shell degradation might not impact reef survivorship as strongly on a reef with a higher initial oyster and sediment volume.
The bifurcation point decreases exponentially with ambient food concentration (Fig.13f). Consequently, restored reefs are likely to be more successful in areas where there is greater food availability. However, as described above this model likely overestimates the effect of ambient food concentration on oyster reef success. Decreasing the fractional reduction in food availability decreased the bifurcation point because the oysters have more food available for growth. It is evident that the k value has the strongest influence on the success of the reef when initialized at a value greater than about 0.35 (Fig. 13c) and suggests that if the growth term is initialized with a k value smaller than this threshold, density dependent reduction in food availability will not
availability could not be located. As a result, the constants r and k were initialized so that the magnitude of the growth rate term matched the Jordan-Cooley paper without any physical justification. Future work should seek to incorporate physical parameters such as water velocity, food concentration, and reef geometry into this term.
The decrease in bifurcation point with increasing grain size suggests that restored reefs might be more successful in environments with a larger grain size (Fig. 13). The range of
parameters needs to be expanded to determine if the trend is consistent for all sediment diameters because it is possible that settling velocity becomes more dominant with larger grain sizes. A linear increase in bifurcation point is seen when the velocity is increased (Fig. 13). Based on this trend restored reefs would be more successful in environments where the water velocity is slow. A sensitivity analysis needs to be run testing lower values for velocity because the values tested during this analysis are approximately the highest values that would be seen in the natural system. Slower velocities would result in the sediment becoming concentrated in the lower portion of the water column, so the oysters can escape smothering more easily (Eq. 24). Additionally, because both of the parameters from the sedimentation term, water velocity and sediment diameter, varied linearly with bifurcation point the output of the model is dependent on the initial values of the sedimentation parameters across a much broader range of values than the parameters in the oyster and shell volume terms. Therefore, when assessing environments for reef restoration the factors controlling sedimentation should always be taken into consideration.
Analyses looking at the sensitivity of the final reef height to different model parameter values illustrated that only the parameters in the shell and live oyster terms affected the stable state height of the reef. This analysis means that the sedimentation term has no direct effect on the productivity of the reef because minimizing sedimentation only serves to inhibit mortality not promote growth (Eqs. 1, 3).Consequently, in order to maximize the final height of the reef, parameters controlling the volumes of shell and live oyster need to be considered more heavily than sedimentation terms during restoration efforts. Optimizing conditions for oyster growth would maximize reef productivity while optimizing the parameters in the shell degradation term would help keep the oysters elevated above the sediment layer to prevent smothering. Even so, it is crucial to consider the parameters affecting sedimentation because introducing the
sedimentation term created the largest change in bifurcation point seen in the model revision. Therefore, factors controlling sedimentation should be carefully assessed during restoration projects because the rate of sedimentation can control whether or not the reef survives in a particular environment.
In its present form the model is only operating in one-dimension. Future work should c introduce a horizontal component to the model to be more representative of the physics. The physical environment varies based on reef height, reef roughness, local currents, and the position on the reef where measurements are made. The presence of oysters alters the flow regime. At the crest of the reef current speed is high and deposition is low, while oyster recruitment is highest at the front base of the reef (Lenihan, 1999). Incorporating this horizontal variability would also enable an optimal reef area to be identified for restoration projects and provide a more complete image of the success of the reef as a whole.
reef restoration success and makes the model a more effective management tool. The sensitivity analysis has shown that reef success is highly variable within reasonable ranges of parameters controlling growth, change in shell volume and sediment deposition, thereby emphasizing the importance of assessing physical conditions for reef restoration projects. Improvements can always be made to models to improve their representation of the environment. Nonetheless, this revised model based on Jordan-Cooley et al. (2011) is a powerful tool for identifying the relative success of restored reefs under different environmental conditions.
6. Figures:
Figure 2: Evolution of oyster, shell and sediment volumes after each model revision. Left panel shows cases where the reef survives the right panel shows cases where the reef dies. Row 1: Original Model, Row 2: After Volume Fraction correction, Row 3: After modifying growth term, Row 4: After changing the sediment deposition and erosion terms. B(0) represents the initial reef height used for each run.
a) B(0) = 0.031 m b) B(0)= 0.032 m
c) B(0) = 0.073 m d) B(0)=0.074 m
e) B(0)=0.030 m f) B(0)=0.031 m
Figure 3: Image showing the effect of the presence of shell on sediment height. Volume of sediment is the same in both cores
Figure 5: Left panel shows how the fractional food availability changes in response to oyster volume. The maximum fractional reduction in food availability is determined by k. The right panel shows how the growth rate of a single oyster changes as oyster volume increases and the shape of the profile is the inverse of fractional reduction in food availability.
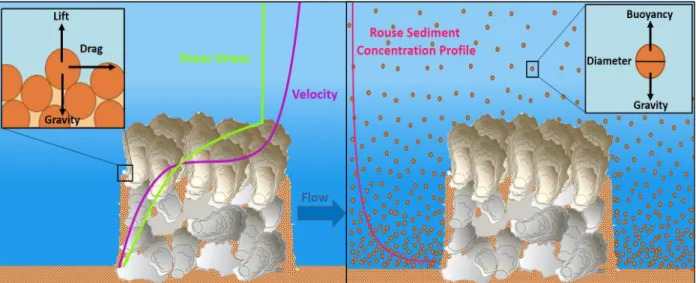
Figure 7: Schematic diagrams of the processes included in the revised sedimentation term. The left panel shows the shear stress and velocity profiles that were used in the erosion term of the revised model and the force balance on the sediment grain that determines whether there is sufficient shear stress for erosion. The right panel shows the Rouse sediment concentration profile that was implemented in the deposition term of the revised model and the force balance on the sediment grain that controls the settling velocity.
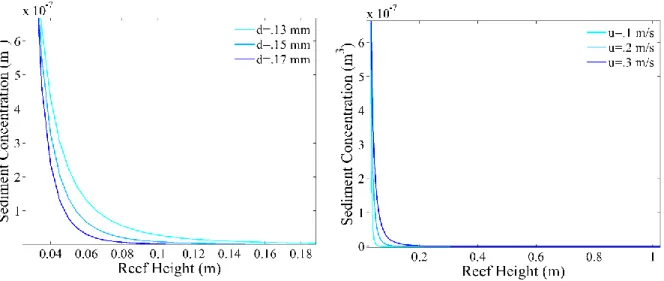
Figure 9: Rouse profile used in the revised deposition model. The sediment concentration is highest at the bottom and decreases moving up in the water column. The left panel illustrates how varying the sediment grain size alters the shape of the Rouse concentration profile, at higher grain sizes the profile is concentrated at the bottom of the water column. The right panel shows how current velocity influences the profile, at higher velocities the sediment concentration is distributed into higher portions of the water column.
Figure 13:Sensitivity analysis results for each model parameter. Graphs are color coded based on the equation the parameter came from. Green: Shell Blue:Live Oyster Red:Sediment. The left panel shows the bifurcation point and the right panel shows the steady state reef height. Lower bifurcation points represent better environments for reef restoration and higher reefs are more productive.
i) j)
a) b)
c) d)
e) f)
g) h)
7: Tables
Table 1: Parameters in the Jordan Cooley (2011) model.
Parameter Description Units Value
r instaneous rate of increase 1
year 1
K oyster carrying capacity 3
m 0.3
mortality rate due to predation and disease 1
year 0.4
mortality rate due to sediment 1
year 0.94
oyster shell degradation rate 1
year 0.7
0
F maximum sediment filtration rate 1
year 1
C maximum sediment deposition rate 3 1
m year 0.02
o
y sediment volume where the filtration is a maximum 3
year m 0.02
sediment erosion rate 3
m 0.01
h scaling factor 3
m 20
decay rate of sediment deposition on the reef height 3
m 3.33
Table 2: Parameters in the Revised Model
Variable Description Units Value
NP Net Production
min
mL individual
N/A
FR Filtration Rate
min
mL individual
N/A
W Average oyster biomass g 0.31
C Ambient food concentration g mL 8
6 10
T Temperature °C 30
Total particulate content g L 0.03
d Oyster density
2 filtered L
hr m N/A
A Assimilation g
hr ind N/A
R Respiration g
hr ind N/A fr Modification to food availability based on oyster
density N/A N/A
r Constant based on flow rate N/A 0.007
W Oyster biomass g
ψ Total particulate content mg/L
D Deposition
3 2
m deposited
m reef year N/A
E Erosion
3 2
m deposited
m reef year N/A
c Volume concentration of sediment at bed 3
m N/A
S
W Settling velocity m s N/A
s
Density of sediment kg m/ 3 2650
w
Density of water kg m/ 3 1000
Viscosity 2
/
m s 6
1 10
g Acceleration due to gravity 2
/
m s 9.8
Shear stress at the bed 2
/
N m N/A a
c Reference concentration at height a above the bed 3
m 1 10 7
h Depth from reef base to the water surface m 5
u Water velocity m s/ 0.25
*
u Frictional velocity (0.05u ) m s/ 0.0125
d Sediment particle diameter m 3
1.5 10
Shields parameter N/A N/A
c
Critical shields parameter N/A 0.05
References
Adams, M. P., Walker, R. L., & Heffernan, P. B. (1995). The effects of stocking density, bag mesh size, and bottom sediment on the growth and survival of the eastern oyster, with emphasis on controlling spat fouling. Journal of Applied Aquaculture, 4(4), 25–44.
Barillé, L., Prou, J., Héral, M., & Razet, D. (1997) Effects of high natural seston concentrations on the feeding, selection, and absorption of the oyster Crassostrea gigas. Journal of
Experimental Marine Biology and Ecology. 212(2), 149-172.
Brietburg, D. 1999. Are three-dimensional structure and healthy oyster populations the keys to an ecologically interesting and important fish community? In M.W. Luckenbach, R. Mann, and J. Wesson (eds), pp. 239-250. 1999. Oyster reef habitat restoration: a synopsis and synthesis of approaches.Proceedings from the symposium. Virginia Institute of Marine Science, College of William and Mary. VIMS Press
Cressman, K.A., Posey, M.H., Mallin, M.A., Leonard, L.A., &Alphin, T.D. (2003). Effects of oyster reefs on water quality in a tidal creek estuary. Journal of Shellfish Research 22:753-762
Ghisalberti, M. & Nepf, H.M (2004). The limited growth of vegetated shear layers. Water
Resources Research 40, W07502, doi:10.1029/2003WR002776.
Gonda-King, L. M., Keppel, A. G., Kuscner, M. A., & Rodkey, C. N. (2010). The relation of sedimentation to growth rate in the eastern oyster. St.Mary’s College of Maryland Department of
Biology.
Grabowski, J.H. & Peterson, C.H. (2007). Restoring oyster reefs to recover ecosystem services.
Ecosystem Engineers-Plants to Protists, 4,281-289.
Jordan-Cooley, W. C., Lipcius, R. N., Shaw, L. B., Shen, J., & Shi, J. (2011). Bistability in a differential equation model of oyster reef height and sediment accumulation. Journal of Theoretical Biology, 289, 1–11.
Kellogg, M.L., Cornwell, J.C., Owens, M.S.,& Paytner, K.T. (2013). Denitrification and nutrient assimilation on a restored reef. Marine Ecology Progress Series. 480, 1-19.
Meyer, D.L., Townsend, E.C., & Thayer, G.W. (2008). Stablization and Erosion Control Value of Oyster Cultch for Intertidal Marsh. Restoration Ecology. 5(1), 93-99.
Newell, R.l.E. (1988). Ecological changes in Chesapeake Bay: Are they the result of overharvesting the American oyster, Crassostrea virginica. Understanding the
Nielsen, P. (1992). Coastal Bottom Boundary Layers and Sediment Transport. World Scientific.
Powell, E. N., Klinck, J. M., Hoffman, E. E., & Ray, S. M. (1992). Modeling oyster populations IV; rates of mortality, population crashes, and management. Texas A&M University
Powers, S. P., Peterson, C. H., Grabowski, J. H., & Lenihan, H. S. (2009). Success of constructed oyster reefs in no harvest sanctuaries: implications for restoration. Marine Ecology, 389, 159– 170
Schulte, D. M., Burke, R. P., & Lipcius, R. N. (2009.). Unprecedented restoration of a native metapopulation. Science, 325, 1124–1128.
van Rijn, L. C. (1986). Sediment transport by currents and waves. Delft Hydraulics Report H461.
Waldbusser, G. G., & Steenson, R. A. (2011). Oyster shell dissolution in estuarine waters : effects of pH and salinity. Journal of Shellfish Research, 30(3), 659–669.