ABSTRACT
It appears that many problems associated with the key
water system management tasks in the small communities of
Honduras could be solved if water were treated as a
marketable good. This would involve the use of meters along
with a pricing system that in principle should set the price
equal to the marginal cost.
This paper first discusses the theoretical aspects of
using meters along with a marginal cost pricing scheme and
how this could help to solve the system management problems
in Honduras. Then, an examination is made of the practical
aspects involved in running a metering system as it is done
by a well organized utility in the United States. Finally, an
assessment is made of implementing metering systems in the
small communities of Honduras in light of the practical
considerations. In general, the problems involved in such
implementation would appear to make it impracticable, at
least for the vast majority of systems. Honduras needs to
stregthen its institutions before it can turn to widespread
TABLE OF CONTENTS
Page
LIST OF FIGURES... v
LIST OF TABLES... -... vi
ACKNOWLEDGEMENTS... vii
I. INTRODUCTION... 1
Water System Management in Honduras... 2
Problems with Water System Management in Honduras ... 5
Objectives of This Report... 10
II. THEORETICAL CASE FOR METERING... 12
Metering... 1^
Metering and the Distribution of Water... 1^
Management of Water Losses ... 15
Marginal Cost Pricing... 17
Obtain Revenue for Operation and Maintenance ... 18
When To Expand... 25
Payment for Expansions ... 27
Conclusion. ... ... 28
III. PRACTICAL REALITIES: A CASE STUDY... 30
OWASA System... 31
Meter ing... 33
Purchase of Meters... 33
Testing of Meters... 37
Maintenance of Meters... <^2
Reading, Billing and Collecting Revenue ... , . ^3
Reading of Meters... ^^
Billing and Collection of Revenue... 45
Setting Prices... '^
ͣ
7
Water Charges and Fees... 47
Water Rates Determination... 53
OWASA's Pricing Practices ... 59
Practical Considerations of Marginal Cost Pricing . . . (bO
Financial and Price Stability of the Authority . . 61
Marginal Cost and The Poor... 61
Capital Indivisibility ... 6H IV. APPLICATION OF METERING TO HONDURAS ... 68
Metering... 68
Purchase of Meters... 68
Testing of Meters... 71
Maintenance of Meters... 73
Reading, Billing and Collecting Revenue ... 75
Reading... 77
Billing... 77
Collection of Revenue... 81
Setting Price Levels... 81
Average Cost Pricing... 81
Average Incremental Cost ... 83
Conclusions... 84
V. RECOMMENDATIONS... 85
Identification of Communities ... 85
Communities with Metering... . 87
Communities without metering... 88
LIST OF FIGURES
Figure Page
II-l Total Cost Curve... 19
II-S Average and Marginal Cost Curves... 21
I 1-3 Profit and Losses... 23
11-^ Short and Long Run Marginal Cost Curves... 26
III-l The Billing Process... i^h
III-2 Lifeline Rate... 63LIST OF TABLES
Table Page
II-l Meters installed in the past five years... 35
II-2 Accuracy limits for new meters specified by
OWASA... 39
I 1-3 Frequency of Testing meters used by OWASA. ... A-1 11-^ OWASA water charges... 49 II-5 Categories used in the total revenue estimation
for the three—year period... 55
I 1-6 Meter equivalents used in the OWASA rate study . 58
IV-1 Number of bills processed biweekly and the
ACKNOWLEDGEMENTS
First, I would like to thank Dr. Donald Lauria, my
advisor, for his patience, thoughtfulness, and especially his
personal interest in making this work a valuable learning
experience for me.I am grateful to the personnel at OUIASA, especially
Pat Davis, Linda Vaughn, John Greene, Bill Cole and Eric
Roberson, for their time and patience in answering my
questions, and most important, their sincere interest in
helping me to understand so many things in such a short
period.
I would like to thank Dr. John Briscoe and Dr. Daniel
A. Okun for their guidance in the beginning of my project.
Thanks also go to Dr. Dale Whittington and Dr. Daniel A. Okun
for being on my committee.
Finally, I would like to thank all the professors at
the university who gave me the education I was looking for,
and that now I will be able to use in benefit of the people
of my home country, Honduras.
CHAPTER I
INTRODUCTION
This thesis is concerned with piped water supply
systems in small communities in Honduras. The population of
these communities ranges from 10,000 to 50,000 inhabitants.
The water supply source in these towns is usually a spring, a
river, or a well. In the majority of systems, the water is
transported from the source to the town by gravity. In some
cases, however, water needs to be pumped because it comes
from a well (groundwater) or because the source is at a lower
elevation than the community. Pipe networks are used to
distribute the water to the community, and the final delivery
is made though the use of house connections or public taps.
The majority of these water supply systems are not metered,
although a few of them have meters on house connections and
large water users such as industries and commercial busi¬
nesses.
In the small towns of Honduras, community groups, town
governments, or the national water supply authority, SANAA (a
quasi-governmental agency of the government) are responsible
for management of the water supply systems. Basically,
management involves five major tasks: a) to distribute water
sufficient quantity to meet user needs* b) to obtain revenue for operation and maintenance, c> to maintain the system, e)
to decide when and how large to make capacity expansions, and
d) to pay for the capacity expansions of the system. Clearly,
there are additional management tasks, but these are the ones
of primary concern in this report.
1.1 Ulater System Management in Honduras
In Honduras, distribution of water is accomplished
either by public taps, by house connections and vending.
Public taps generally consist of one or several standpipes,
usually equipped with a main cutoff valve that sometimes can
be locked. Public taps are sometimes protected with a wooden
structure like a small house. To haul water from the public
tap, people use plastic or metal buckets. To get water from
the tap, people usually have to form a queue and wait their
turn to fill their bucket. The other method of distributing
water is through the use of house connections which may or
may not be metered; in some instances, the connection is only
a yard tap. House connections and public taps are not
mutually exclusive; it is not uncommon to find communities
with part of the population served through house connections
To obtain revenue for operation and maintenance (the second major management task cited above)» water authorities in Honduras use both flat rates and commodity charges. A flat rate is a fixed charge that the user pays periodically (usually every month)* regardless of the amount of water consumed. Flat rates are the most common charges in Honduras* primarily because of their simplicity. Generally, the local water authority has a list of all customers* and every month they send someone to collect and record the payments from those on the list. The other type of charge is a commodity charge in which the customer pays in proportion to the quantity of water consumed. Since commodity charges are proportional to consumption* they require the use of a water meter 1_/. When a commodity charge is used* the meters a.re read periodically* the information is sent to the central
office in Tegucigalpa 2/, bills are prepared, and they are
distributed to the customers who must pay in the local office
of the water authority. Both commodity charges and flat rates in Honduras are usually set low to make them affordable to the poor.
W In Honduras* water systems that have meters are managed by SANAA, the national water supply authority. Systems without meters are managed by the municipalities themselves or other community groups. 2/ The billing and customer accounts are centralized in
Maintenance of water supply systems (the third
management task), is woefully lacking in the small communi¬ ties of Honduras. Usually, it is only large visible leaks that are fixed; seldom is there any leakage control program in these towns. No routine maintenance is performed, primar¬
ily due to lack of funds and technical expertise. Communities
rely on the national government to help them solve their
larger maintenance problems. Generally, communities perform
maintenance only when problems becomes apparent or there is a breakdown in the system. If a community does not have the expertise, equipment or material or if it cannot afford maintenance, then it requests assistance from the national government.
In the small towns of Honduras, it is uncommon to plan ahead for capacity expansions of the water systems, which is
the fourth major management task. Generally, there is little
information on which to base decisions on when and how large
to make capacity expansions. Consequently, the current demand
and its growth a.re not considered at all; it is only when
demands have exceeded system capacity that expansions are considered.
With respect to obtaining funds in Honduras to expand
the capacity of water systems, most communities do not have
required to expand the capacity of a system? communities rely
on assistance from the national government or any of the
international private voluntary organizations such as CARE.
The government does not have many resources to make available
for water supply in communities. Consequently? only a small
number of towns receive help each year. On the other hand,
private voluntary organizations help rural communities to
build their own water systems, but very few resources are
allocated for capacity expansions. Rather, most investment is
for new construction.
1 .2 Problems with Ulater System Management in Honduras
The methods used for handling the major water system
management tasks in Honduras are generally deficient and
result in problems. This section presents some of the most
common difficulties associated with these management tasks.
In the distribution of water, there are problems with
both hiouse connections and public taps. With respect to taps,
they are inconvenient and require excessive time in carrying
water from tap to the home. Only a reduced quantity of water
can be consumed each day due to the difficulty of hauling it.
This limits the use of water to the most essential purposes,
making it impossible to obtain full hygienic benefits.
water to be stored in the home? usually under insanitary
conditions subject to various sources of pollution, with
resulting risks to health.
There are also problems with the distribution of water
through house connections. Even where meters are used, there
is frequent underregistration, illegal connections, and
meters that do not work.Underregistration is a common phenomenon with meters
that have been in use for some time. When a meter is new, it
usually has a high degree of accuracy, but in time, the meter
loses its accuracy, sometimes due to wear, or to the quality
of the water, or to accidental or intentional damage. The
result is that most meters register less than the actual
volume of water passing through them.
Illegal connections represent a serious problem when
water is distributed through house connections. Illegal
connections are not registered by the water authority and
consequently do not have meters. An illegal connection is
usually made by tapping the main and using a connecting pipe
or hose that runs to the house or by by-passing the water
meter with a small pipeline. Illegal connections, like
underregistration, result in real losses of revenue for the
usually poorly made, they are a source of substantial
leakage.
Another problem with water distribution in Honduras
results from meters that do not work, sometimes because the
water in the distribution system is hard or contains solids
that deposit in the meter. Another cause for the breakdown of
meters is their poor quality, often due to inferior materials
or workmanship that were ignored in the interest of low cost.
When water is distributed using house connections but
without metering, there are often problems of water wastage
and financial inequity. Because the people do not pay for
each unit of water, they often leave the water running after
they have finished using it. Inequity, on the other hand,
results because all the customers in the community pay the
same flat rate, with large users paying the same as small
ones.
Another area where there are serious problems in
Honduras is in connection with revenues for operation and
maintenance. With a flat rate system, the revenue is more or
less fixed, but the operation costs are not; great variations
in costs can exist, resulting in a revenue shortfall. Another
•
that thsy are free to use as much water as they want. Acommon problem is that the revenue is insufficient to cover
costs because the flat rate is set too low. In addition, with
flat rates many people do not want to pay their water bills.
There are many reasons for this such as, they simply expect others to pay the costs, or because they are not satisfied
with the service, or because they feel they deserve free
water.
Even with meters and a commodity charge, there are
still many problems in Honduras. The most widespread and
serious problem is the difficulty in covering operation and
maintenance costs because the price of water (or the water
rate schedule) is usually set too low, resulting in insuffi¬
cient revenue to cover costs.
In the area of system maintenance, there are three
problems of particular concern in Honduras. One is the almost
complete absence of preventive maintenance. Commonly, systems
are not maintained and repairs are not made until problems
become apparent or there is a breakdown. Consequently, it is
common to have sudden interruptions in service. The second
problem is that there is usually no systematic leakage
control; consequently, water losses tend to grow with time.
The third problem is that it takes a long time to make major
repairs. When a major problem develops, it may take months to
fix it because of the lack of tools, equipment, material or
skilled personnel. This frequently results in lengthy service
interruptions and/or water rationing for long periods.
Planning for capacity expansions is also a serious
problem in the small communities of Honduras. Since planning for capacity expansions is seldom done in advance, communi¬
ties commonly face water shortages because demands have
exceeded current capacity. This creates discontent among
water users and leads to other problems such as difficulty in
collecting revenue. In systems with meters, water rationing
and/or intermittent operation brings air into the pipes
causing erroneous registration or, more importantly, negative
pressures in networks that cause infiltration of polluted
groundwater, resulting in contamination of the drinking
supply.
Small communities have difficulties getting funds to
expand the capacity of their systems. When excess capacity of
a system is exhausted, the community usually looks for
assistance from the government. But, because in government
budgets only a small amount is allocated to assist small
communities, it usually takes a long time before help
arrives. The only alternative that the community has then is
to curtail demand, which is a difficult task, especially in
the end, water authorities usually turn to rationing by given
service only certain hours of the day with the consequent
negative pressures and the risk of pollution.
1 -3 Ob.iectives of This Report
In order to solve the problems associated with the
kinds of water system mismanagement described above for
Honduras, water metering in combination with an appropriate
water pricing policy has proven in many countries to be
effective. The basic notion is to treat water as a marketable
commodity in which the purchaser pays for each unit. With
metering and a proper pricing policy, enough revenue might be
generated to cover not only the costs of operation and
maintenance but also the cost of expanding system capacity.
With a price system, it is theoretically possible to ration
the water and use it more efficiently. Additionally, it
should be possible to generate information for making better
decisions in operation and maintenance. Finally, with
metering and a price system, it should be possible to obtain
proper signals for capacity expansion. The hypothesis herein
is that water metering with proper pricing might be an
improved method for handling the basic water management tasks
that confront the small communities of Honduras.
The goal of this report, then, is to examine the
applicability of metering along with a water pricing system
in small communities in Honduras. Three objectives have been
set in order to reach this goal: a) present the theoretical
case for using meters and appropriate prices, b) present the
practical realities for implementing a metering and price
system, c) assess the practicability of using meters in the
CHAPTER II
THEORETICAL CASE FDR METERING
The water distributed to consumers in a community is a good that from the economic point of view can be treated as a commodity. In order to do thisj the water must have the characteristics of a private marketable good. This type of good has two fundamental characteristics: a) it can be consumed by only one user; this characteristic is called
"rivalry". An example is gasoline which, if bought by one consumer to be used in a motor, cannot be used in another,
and b) it is possible to exclude certain users from consump¬ tion of the good; this characteristic is called "exclusion". An example is where payment must be made before consumption; people who do not pay can be deprived from consumption. Private marketable goods can be produced and sold through markets and they can be consumed only by those who pay the
market price. Water, therefore, can be treated as a market¬
able good if it conforms to the two characteristics described
above. (Note that the water of a river or lake that is used
by persons for bathing who have free access is not a private
marketable good).
In Honduras, water is not always treated as a private
marketable good. In cases where there are public taps, the
property of exclusion is often absent. With public taps* it
is difficult to separate the people who pay for t^^e water from those who do not; besides* in many instances water is available free of charge at public taps. In cases where house
connections without meters are used and a flat rate is
charged, the property of exclusion is again lacking. Water users in this situation actually pay a flat rate for the right to be connected to the system, but the water consumed
is basically free of charge.
There are cases in Honduras where water is treated as
a private marketable good. In communities with house connec¬
tions and meters, some type of commodity charge is applied,
making water a private marketable good. However, in most cases, the price of the water is usually set low in order to
make it affordable to the poor. Despite marketing, therefore,
serious problems usually result, as described in the previous
chapter. Hence, marketing alone is not necessarily a solution
to the water management problems of Honduras.
Treating water as a private marketable good in
principle would seem to resolve the problems related to the major tasks of water system management. But to do so requires the installation of meters, additionally, the economists
recommend the use of economic principles, namely marginal
marginal cost pricing can help resolve the problems that
exist in water system management* it is useful to consider
metering on one hand, and marginal cost pricing on the other.
2. 1 Meter inq
The use of water meters in a community in principle has two major effects: a) the water can be distributed more
and fairly* and b) water losses can be more easily managed.
The first is a distribution effect, and the second is an
effect on maintenance.
S.1.1 Metering and the Distribution of Water
Metering makes it possible to distribute water more
fairly. Uithout metering, water charges and water consumption
are not necessarily related. This means that even though some
users consume more water than others, all of them can end up
paying the same water bill (with a flat rate system). This
means that large users pay less per unit volume of water than small users. When metering is introduced in conjunction with commodity charges, the water becomes a private marketable good that is sold at a single price per unit volume (or
single rate schedule) applicable to all users in the same class. Metering, therefore, serves as the basis for
buting water fairly among water consumers in a community because every consumer pays in proportion to consumption. The
more that is consumed, the more that must be paid. An alternative to a flat rate system is to charge by the number
of faucets or sinks in a house, but even here distribution is
not entirely equitable since to have more taps does not necessarily result in higher usage.
2.1.S Management of Water Losses
The second effect of metering is in connection with maintenance. A metering system can provide the information necessary for managing water losses. Water losses can be considered from the point of view of either the customer or the water utility. From the viewpoint of the customer, if the
house plumbing is leaking* the water loss is going to
represent an increment in the monthly bill. This will create
an incentive for the householder to fix the plumbing. One way
of detecting household water losses consists in closing all
faucets in the house, then taking an initial reading on the meter, leaving the faucets closed for some hours, and finally
taking a new reading pf the meter. If there is significant
leakage in the house, it is going to be reflected as a
From the point of view of the water utility* water
losses consist of the total unaccounted-for water in the
system. Unaccounted-for water can be defined as the differ¬
ence between the total water put into the system (usually
measured at the water treatment plant) and the total amount
of water used by the consumers (usually estimated as the
total amount of water billed)» during the same period of
time. Unaccounted-for water comprises all the water lost by
leakage in the distribution system, the non-metered water
supply, the illegal use of water, fire fighting,
underregis-tration of meters, and accounting errors. The unaccounted-for
water represents a real loss of revenue for the water
utility, and for this reason should be kept as low as
possible.
Universal metering can help to reduce leakage in the
distribution network and reduce illegal use of water.
Metering provides the information on consumption of water by
users of the system and allows the utility to make water
balances in the network, i.e. to estimate differences between
the amount of water put into the system and the amount taken
out for consumption. Consequently, metering makes it possible
to determine the areas in the network with high water losses.
Subsequent field work can more precisely detect leakage in
pipes or illegal connections in the areas with large losses.
'»;;ssK'^'^sp^
S. E r^arqinal Cost Pricing
With marginal cost pricing, the intention is to set
the price of water equal to the economic cost (real cost of
resources) incurred in the production of the last unit. Theoretically, in this pricing system, water users ^re informed of the cost of resources used in the production of
each unit of water and the consumers a.rB left to decide how
much they want to purchase based on the value they have placed to the next unit of consumption. If the consumers are
willing to pay the marginal cost, it means that they place a
value on the consumption of an additional unit at least as
great as the cost of producing it, thereby sending a signal
that it is worthwhile to produce the additional unit. On the
contrary, if consumers show their unwillingness to pay a
price equal to the marginal cost of production, it means that
they place a value on the consumption of an additional unit
lower than the cost of producing it. This implies that there
is oversupply and that the additional unit should not be
produced•
Marginal cost pricing is the theoretically optimal way
to handle water system management tasks. It can, at least in
theory, produce enough revenue for operation and maintenance
and even to pay for capacity expansions. Marginal cost
justifi-cation for capacity expansions. The theoretical role for
marginal cost pricing in water system operation is described
in the remainder of this section.
S.E.I Obtain Enough Revenue for Operation and Maintenance
To better understand how marginal cost pricing can
generate enough revenue for operation and maintenance, the
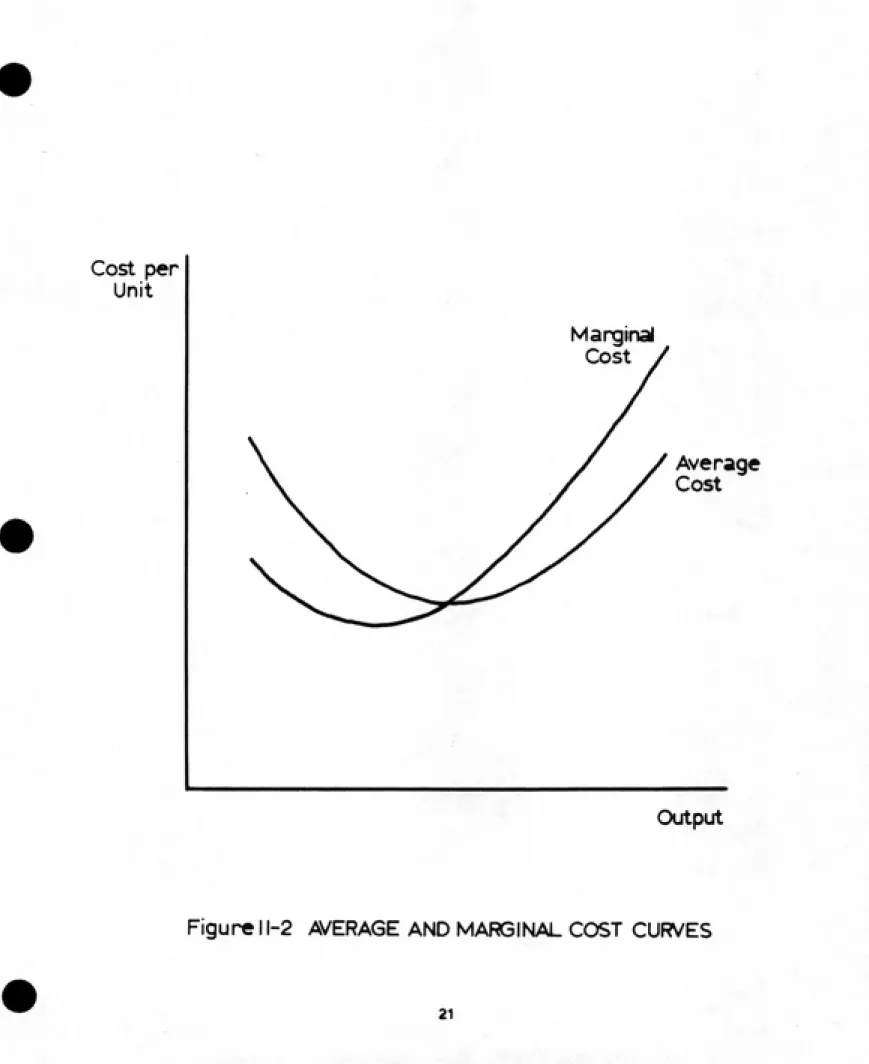
first step is to analyze marginal and average cost functions
to see how they behave. The average cost at a certain level
of output is calculated by dividing the total cost by its
corresponding output. Marginal cost is defined as the cost
incurred in producing the last unit of output. Marginal and
average costs are derived from the total cost function and
they vary with the level of output.
For any given total cost function, it is possible to
plot the average and marginal cost curves. Figure II-l
presents a typical total cost function from which the average
and marginal cost curves are derived (curves are shown in
Figure II-S). Note that the marginal cost at any level of
output is the slope of the total cost curve, and the average
cost is the slope of the line segment joining the origin and
the total cost curve. From the figure we can see two impor¬
tant relations of these cost functions: a) in the decreasing
portion of the average cost curve, the values of marginal
Total
Cost
Output
.'..^-.^ -^T: "15S?EP^
cost are lower than their corresponding average cost values.
When the average cost decreases? the rate of change of t,he cost function (the value of the marginal cost) has to be less than the average cost to let the next average cost value to be less than the previous one; b) in the increasing portion of the average cost function, the marginal cost value is
grater than the corresponding average cost value. In the
increasing portion of the average cost curve the rate of
change with respect to the output of the total cost function
has to be greater than the average cost to let the next
average cost value to be greater than the previous one.
The fact that the marginal cost can be grater or lower
than the average cost has great importance in marginal cost
pricing. It is possible to have excess revenue (profit) or a deficit revenue (loss) depending upon the portion of the average cost curve in which the utility is operating. If the utility is operating in the increasing portion (which is
thought to be the most common case), it is going to have profit. This is shown in Figure II-3(a). At level of output
q, the utility is going to receive revenue equal to the
marginal cost (under a policy of marginal cost pricing) times
the output q, and it is going to have cost equal to the
average cost times the output (q). Since the marginal cost is
greater than the average cost, the utility is going to make
profit, which is shown in Figure II-3(a) as the shaded area.
Cost per
Unit
Marginal
Cost
Average
Cost
Output
On the other hand, if the utility is operating in the decreasing portion of the average cost curve (which is the case when there a.re economies of scale), the marginal cost
(i.e. the price) is less than the average cost and the
utility will to have a loss. Figure II-3<b) presents the case of operation in the decreasing portion of the average cost curve, and the shaded area represents the loss for the
utility.
Regardless of wether the system operates in the increasing or decreasing portion of the average cost curve, with marginal cost pricing it is possible to obtain enough revenue to cover operation and maintenance costs. If the price is equal or greater than the average cost, total costs, including operation and maintenance, are covered and in fact, the utility would most likely make a profit by following a marginal cost pricing policy. In the case where the utility is operating in the decreasing portion of the average cost curve, the price charged would be less than the average cost
and therefore the revenue would not cover the total cost. The
recommended solution to this problem is to divide the tariff into two components, one of them being a commodity charge
with price equal to marginal cost, and the other being a fixed charge (independent of consumption) that would cover
the losses that the utility would otherwise incur. In this
Cost per
Unit
price= MC
Marginal
Cost Curve
Average
Cost Curve
Output
Figure I l-3(a)
Co^t per
Unit
AC
price: MC
Average
Cost Curve
Marginal
Cost Curve
q Output
way, the utility would cover the total cost including
operation and maintenance.
Marginal cost has two characteristics, one applicable to the short run and the other to the long run. The short run
is the period of time when the capacity of the water system
is fixed. Therefore, marginal cost in the short run refers to
the cost of producing an additional unit of water without
changing system capacity. Marginal cost in the short run
basically reflects the operation and maintenance costs of
producing an additional unit of output. On the other hand,
the long run is a period of time long enough to allow the
scale of the production plant to be changed. Marginal cost in
the long to refers to the cost of producing an additional
unit of output by expanding the capacity of the system. The
long run marginal cost reflects, therefore, the operation and
maintenance costs, plus the capital cost incurred in the
production of the additional unit of output.
Earlier it was suggested that utility operation is
normally thought to be at output levels where average costs
are increasing. It is well known, however, that there a.re
economies of scale in both construction and operation, which
suggest falling average costs, resulting in a shortfall in
revenue. It is important to note, however, that while average
costs in the short run may be falling, in the long run they
are usually risings in part because of higher cost for
additional water of good quality. In practice (if not in
theory) prices need to be based on long run marginal costs>
which accounts for the expectation that utilities would make
a profit if they rigorously used marginal cost pricing.
2.2.E When To Expand
Short and long run marginal costs are key elements in
the decision on when to expand system capacity. According to
marginal cost pricing theory* when there is excess capacity
in the system, the price should be set equal to short run marginal cost. In Figure II-4 a representation of a short run
marginal cost curve is shown. The price charged is determined
at the intersection between the short run marginal cost
(SRMC) and the demand curve (point A in Figure 11-^). Over
time) demand normally continues to grow even though the
capacity of the system is utilized. This is shown by the
shifting D-curves. At the point of full capacity utilization,
the marginal cost curve becomes very steep or even vertical
because the cost of producing an extra unit of output when
there is no more excess capacity is very high. From the point
of full utilization of installed capacity, the price under a
policy of marginal cost pricing would have to be raised to
PRICE
SRMC
Po-
P«-P1^
^0
J
LRMC
OUTPUT
Figure 11-4
the price would equal the long run marginal cost (LRMC) (point B in Figure 11-^). At this point because the consumers
are paying a price equal to the long run marginal cost, they
a.r6 demonstrating their willingness to pay the cost of
producing an additional unit of output plus the marginal capital cost that the production of this unit represents. An
expansion of system capacity is then justified (i.e. at the time when demand has shifted to D in Figure 11-^).
Marginal cost pricing, therefore, provide a criterion upon which to base the decision when to expand system capacity. This criterion consists of letting the system become fully utilized and expanding it when consumers show their willingness to pay a price equal to the long run marginal cost (i.e. when the value consumers place on the
consumption of an additional unit of output is at least equal
to the cost of operation and maintenance plus the capital cost incurred in the production of that additional unit).
2.H.3 Payment for Expansions
If a water utility is operating in the increasing portion of the average cost curve, it is going to make profit. In principle, this profit could be invested in a
sinking funk to pay for capital projects; in other words, the
case where the utility operates in the decreasing portion of
the average cost curve, a two-part tariff would be necessary to avoid losses. In this situation, expansions of the system
would have to be done through borrowing. The point is that at
least in theory, a policy of marginal cost pricing makes it possible for the local community to pay for capacity expan¬ sions .
E.3 Conelusion
If water is treated as a commodity and if the utility meters every water user and follows a policy of marginal cost
pricing, then in theory: (a) water is going to be distributed
fairly, (b) it is going to be possible to manage water
losses, (c) enough revenue will be generated for operation
and maintenance, (d) a criterion will be available to tell
when to expand system capacity, and finally (e) sufficient revenues should be available to pay for expansions to the system. In theory, therefore, the introduction of universal metering along with marginal cost pricing should result in efficient water system management.
Marginal cost pricing and metering, in theory, can
help to resolve the problems that exist in Honduras with the
tasks of water system management. However, it is necessary to
examine the practical requirements of implementing marginal
cost pricing and metering to determine the applicability of these principles for Honduras. This is the task of the next
ͣ
^VyiSr" ?-*^
CHAPTER III
PRACTICAL REALITIES: A CASE STUDY
In the previous chapter, it was shown that when water is treated as a commodity and marginal cost pricing is used, it could theoretically result in efficient water system management. However, it is necessary to consider the practi¬ cal aspects involved in the implementation of a metering system and marginal cost pricing. The objective of this
chapter, therefore, is to present the practical realities for using meters and applying the principles of marginal cost
pr ic ing.
When a metering system is used in a community, it is
necessary to periodically make purchases to replace ones that are broken and/or to buy additional meters for new customers.
It is also necessary to maintain the meters, to read them, to
process the bills, and to collect the revenue. These tasks
constitute the practical aspects of metering.
To determine the practical realities of implementing a metering system for the purpose of this report, a study was
made of a U.S. water authority with respect to such tasks as
purchasing, maintenance, reading, billing, and collection of revenue. The approach here was to study the Orange Water and
Sewer Authority (OWASA) which is responsible for providing water and sewerage services to the Towns of Chapel Hill and Carrboro and the sorrounding area* North Carolina.
This chapter is divided into the following six
sections: a) description of the OWASA system, b) metering by
OWASA, c) billing and collecting revenue, d) setting prices, e) discussion of OWASA water rates. The study of OWASA covered the basic aspects of metering, but it could not cover all the practical considerations regarding marginal cost pricing. Consequently, a separate section is included which presents such practical considerations based on practices of The World Bank with respect to marginal cost pricing.
3.1 OWASA System
area; to carry out short and long term planning and finan¬ cing; and to set water rates and collect revenues.
The organization of OWASA consists of several hierar¬ chical levels. A Board of Directors is the top level of
decision. This board consist of nine membersj five appointed
by the Town of Chapel Hill> two by the Town of Carrboro, and two by the Orange County Board of Commissioners. The Author¬
ity has an Executive Director who is at the second level of
decision; he has responsibility for the administration and technical direction of the Authority.The rest of the organi¬ zation is divided into five divisions including Personnels Fiscal Affairs, Customer Relations, Plants, and Engineering. OWASA has over ninety employees working in these divisions. The OWASA service area includes Chapel Hill and Carrboro in Orange County, the University of North Carolina, and part of
Chatham and Durham counties. OWASA has 10,600 customers and
serves a population of approximately 52,000 inhabitants. The population in the area has increased nearly 30*/. from 1970 to 1980 (about 2.5*/. per year), and is still growing due to new developments in the Research Triangle area. All customers in
the service area are metered.
3.2 Meterinq
The Orange Water and Sewer Authority uses meters of
different size from 5/8 to 8 inches. The major tasks for OWASA in connection with metering include purchasing meters, spare parts, and accessories; testing the accuracy of meters; and maintaining the larger meters that have been in the field for some time and are not working properly.
3.E.1 Purchase of Meters
OWASA purchases all the meters that are installed in the water distribution system, rather than leaving such purchase to developers, residential customers, commercial
businesses or the university. This policy has been adopted by
OWASA in order to ensure that meter specifications are met
and to prevent the use of meters from too many different
manufacturers. Another reason is to control the stock of
meters all the time so as to satisfy both ordinary and
extraordinary demands. Finally, by purchasing directly, OWASA
establishes a direct communication with the manufacturer.
Since OWASA buys all the meters, purchases have to be
planned in advance. This is done by the Engineering Division
and consists basically in answering two questions: a) how
The quantity of meters to be bought depends on the number of new houses and the replacement of old meters. OWASA keeps records of the number and type of meters installed for new customers every year; hence, it is fairly easy to make estimates of the demand for meters in the coming year. Table
III-l shows the trend of 5/8" meters installed in the past
five years. There are also records on the number of new meters that are installed annually to replace old meters. Currently, OWASA is purchasing about 1,000 meters a year of
which approximately sixty percent are to replace old meters
and forty percent for new customers.
The purchase of meters depends on the following conditions: 1) when the estimated future demand for meters E"
or smaller would considerably reduce the stock in the warehouse, considering the time for stock replacement; E) when a large meter not in stock is going to be installed; and 3) when the stock of any particular size of meter decreases
below the minimum number that can be ordered. The information
on the current stock of meters in the warehouse is provided
through a Cardex system, which is a control of inventory
method where all the purchases and withdrawals are recorded
on smal1 cards.
Table III-l
METERS INSTALLED IN THE PAST FIVE YEARS
Year No. of meters _1_/
1981 I'^l
1988 887
1983 803
1984 338
1985 538
Source: DWASA
The purchase of meters involves several steps. The process starts in the Engineering Division where a request is made of the OWASA purchasing office. Along with the request are sent the specifications of the meters to be bought. They
usually require a one year warranty against defective
material and workmanship and twenty five years of warranty
against defects in the register box. If the purchase cost is
greater than SlOjOOO, according to the state law, it is necessary to follow a public bidding procedure. In this case, the OWASA purchase office has to prepare instructions for submitting the bids and place an advertisement in local newspapers. The instructions for submitting bids and the specifications are obtained by the bidders at the OWASA office. Public bidding requires a bid deposit of 5*/. to warrant formality of the bid. Bids are publicly opened in the place and on the date and time set in the advertisement. The
bids are studied and award is made "to the lowest responsible
bidder taking in consideration quality, performance, and time specified in the proposal". Public bidding purchases must be approved by the OWASA Board of Directors before any contract
is signed with the successful bidder. If the purchase is for
less than $10,000, the process is simpler: three quotations, written or by telephone, are sufficient.
The time required between award of the meter contract
and delivery of them is thirty to forty days. This relatively
short time is due to several factors: a) good programming of
purchases, b) good communication between the OWASA purchasing
office and the bidders, and c) short delivery time from the
manufacturer to Chapel Hill. For standardization purposes,
OWASA has decided to consider bids from only three meter
manufacturers. This allows the Authority to select well
known, well established meter companies; consequently, their
sales representatives respond promptly to purchases orders
from the Authority.
3.E.E Testing of Meters
One of the important tasks OWASA does is the testing
of meters. Periodic testing is necessary to check that meters
are registering within acceptable limits of accuracy. Through
meter testing, the Authority can determine if there is
significant under or overregistration. If meters are not
tested, inaccuracy would tend to increase over time, which
would mean a loss of revenue in the case of underregistration
and unfair charges in the case of overregistration.
testing and replacement activities of the OWASA water loss
reduction program, and c) when a customer requests the
testing of his meter.
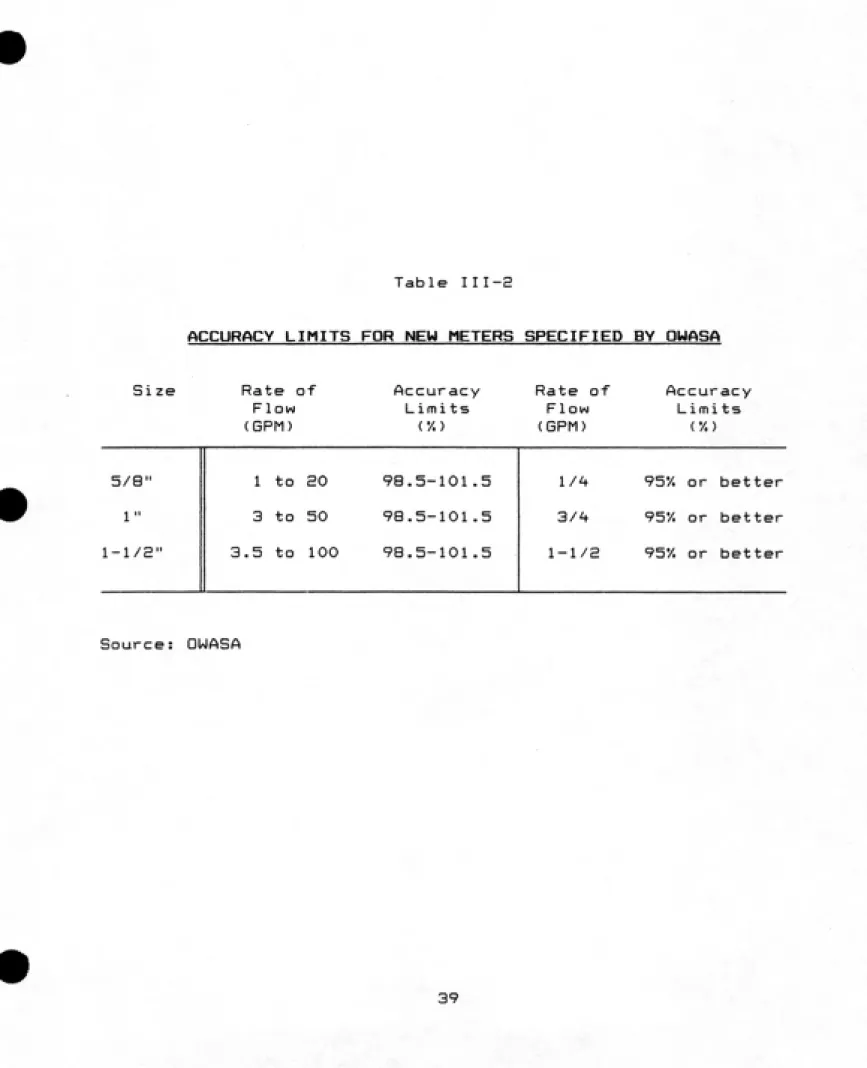
OWASA runs tests on new meters to verify that they
have the accuracy that was specified at the time of purchase.
The OWASA specification states that all meters must meet AWWA
standard C-700 for a period of one year and meet or exceed
rebuilt accuracy standards for 1^ additional years. Addition¬
ally? all new meters must test within the accuracy limits
given in Table III-2. OWASA requires that meters not meeting
the standards must be replaced by the manufacturer.
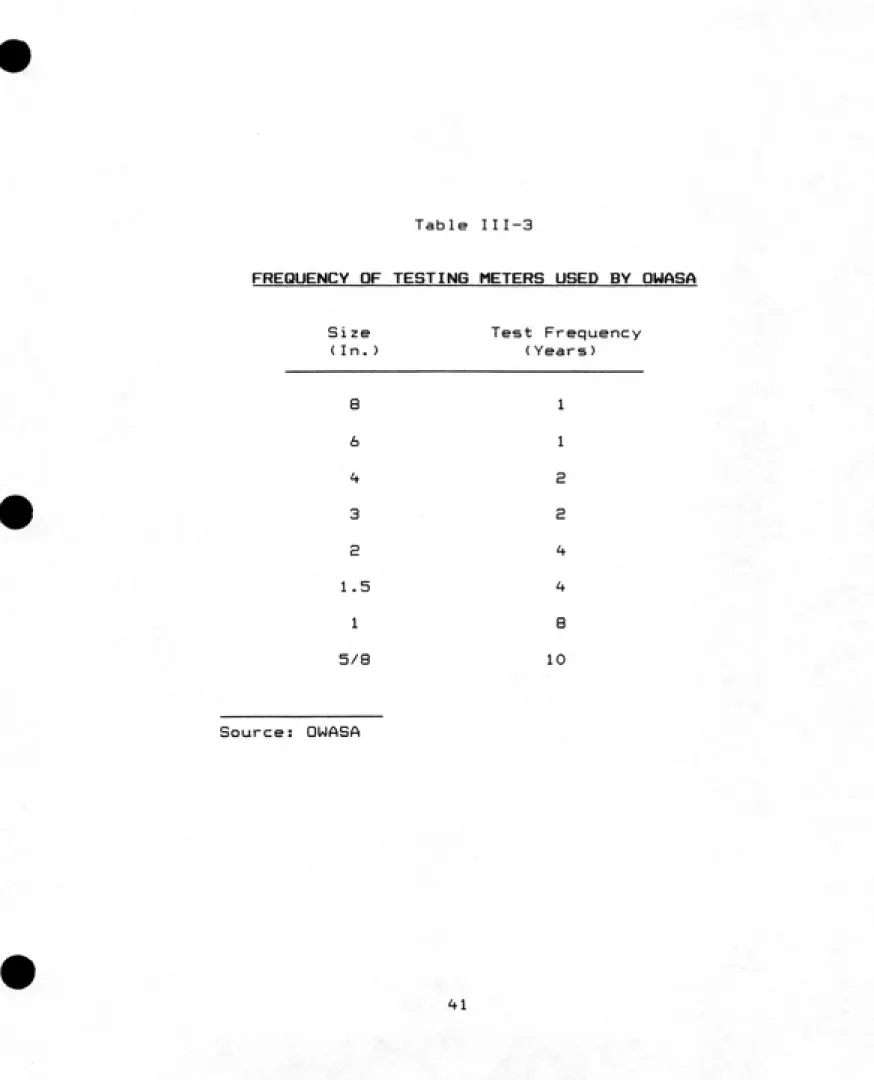
OWASA also performs routine testing and replacement
under its water loss reduction program. This program was
created after the utility realized in 19S1 that the unac¬
counted-for water had reached an average of 25*/.. A study
conducted by a private consulting firm revealed that there
were no major leaks in the distribution system. In this
program* large and small meters are tested on a frequency
basis that varies with the size of the meter, usually large
size meters are tested more frequently than smaller ones
because a small percentage of inaccuracy in large meters
represents a larger water loss. Table 11 1-3 shows the
frequency of testing for different size meters. Currently,
OWASA tests about 1,000 meters a year as part of its loss
Table III-2
ACCURACY LIMITS FOR NEW METERS SPECIFIED BY OMASA
Size Rate of
Flow (BPM)
Accuracy
Limi ts
Rate of
Flow (GPM)
Accuracy Limits
5/8"
1"
1-1/E"
1 to 20
3 to 50
3.5 to 100
98.5-101.5
98.5-101.5
98.5-101.5
l/'^ 95'/. or better 3/4 95y. or better 1-1/a 95*/. or better
reduction program. Even though testing and replacing a.re
expensive, it has proven to be cost effective in reducing
losses. In 1983, OWASA spent $155,000 in the loss reduction
program, but it reduced water losses by 10'/. which represented
a saving to the utility of $51S,000.
The water utility also tests meters when customers
request it. OWASA has the policy that if the meter has not
been tested in the past five years or if the test reveals
overregistration, then the meter is replaced at no charge to
the customer. If, on the other hand, the meter has been
tested within the past five years and is found to be regis¬
tering properly or underregistering, the customer is charged
$35 for the test if the meter is 5/8" and $50 if the meter is
larger than 5/8".
OWASA uses two procedures for testing meters. Small
meters (5/8" to 1-1/2") are tested volumetrically. In this
test, a certain volume of water is passed through the meter
at a fixed flow rate, and the water is caught in a calibrated
container; the percentage of accuracy of the meter is
calculated from the difference between the volume registered
by the container and the volume registered by the meter.
Since meters have to work at different flows, they have to
register within acceptable limits of accuracy at different
rates. Therefore, the volumetric tests are done at three
Table III-3
FREQUENCY OF TESTING METERS USED BY DWASA
Size Test Frequency (In.) (Years)
8 1 6 1 I* S 3 S 2 h
1.5 i*
1 8 5/8 10
different flow rates (minimum, intermediate and maximum),
according to AWWA standards. Large meters (S" and up) are
tested in the field with the use of calibrated meters. In
this type of test the calibrated meter is connected in series
downstream of the meter in service. A flow is passed at a
fixed rate through both meters, and the accuracy is calcu¬
lated from the difference between the volumes registered by
the service and calibrated meters. Large meters are usually
of the compound type (positive displacement and turbine) and
ars tested according to AWWA standards.
3.2.3 Maintenance of Meters
OWASA gives maintenance to a meter under the following
three conditions: 1) when a meter after testing is found not
to meet AWWA standards, 2) when a meter is not covered by
warranty from the manufacturer, and 3) when the cost of
repair, including materials and labor, does not exceed the
purchase price of a replacement meter. If the meter meets
AWWA standards, it is only cleaned and put back into opera¬
tion. If the meter does not meet standards but is under
warranty, it is sent back to the manufacturer. If the first
two conditions are met but the cost of repair is greater then
the purchase price of a new one, the meter is discarded but
the bronze part is sold as junk.
To maintain meters, OWASA has a meter workshop with
all the equipment and tools necessary for testing, disassem¬
bling, repairing, cleaning and reassembling the meters.
Additionally, the workshop has a complete stock of spare
parts for making an immediate repair of the meter. The meter
maintenance personnel in the workshop include four employees
that not only work in meter repairing but also in meter
replacing and testing. These people are highly skilled as a
result of the training courses to which OWASA has sent them.
3.3 Reading, Billing and Collecting Revenue
OWASA has established a policy of billing each
customer every month. This means that the Authority has to
read approximately 10,600 meters and to process this number
of accounts every month. To do this, OWASA has created a
system for reading, billing, and collecting the revenue. First, the Authority has divided the service area into three
zones, each of them with approximately the same number of
meters (customer accounts). Additionally, three cycles of
reading and billing has been established to be done every
month. Each cycle has a zone assigned to it. In every cycle,
the meters of the corresponding zone are read, and their
accounts are processed for billing. The time assigned to each
cycle is approximately ten days. Each activity in the process
in such a way that the bills of the first second and third
cycle (corresponding to the first, second and third zone) are
sent every tenth, twentieth, and thirtieth of every month.
3.3.1 Reading of Meters
The first step in the process of billing is the
reading of water meters. The personnel assigned to the
reading include three field workers plus a supervisor. For
every cycle, these personnel have to read 3,500 meters in
five days. This means that every reader must read on the
average 235 meters per day, or 29 meters and hour. To be able
to read all the meters in the given time, every meter reader
is equipped with a small pick-up truck and a radio communica¬
tion system for coordination of activities.
The readings of customer consumption are registered in
special books. Each book contains the information on the
meters in one of the three zones into which the city has been
divided. The information that each book has includes meter
location, serial number, customer account number, and the
previous readings taken on the meter. The record book is
returned to the Customer Services Division of OWASA by the
meter reader when he has finished taking his readings. The
information in the book is then processed for input to the
computer system.
3.3.H Billing and Collection of Revenue
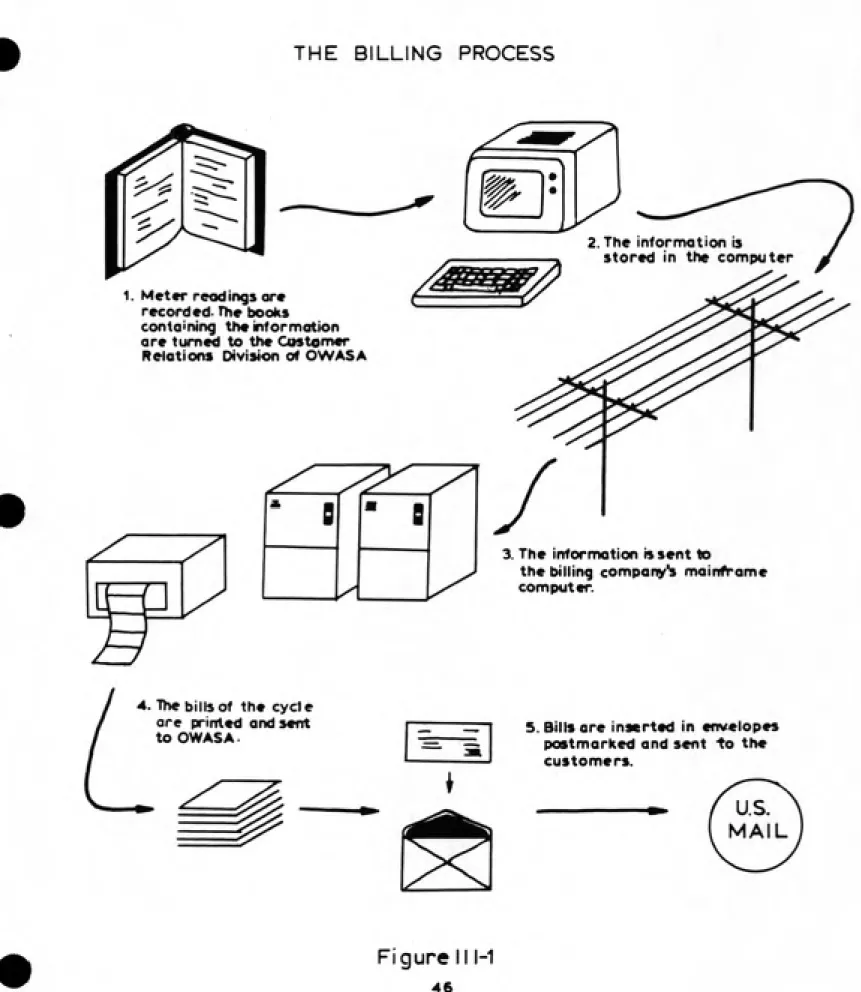
All the bills that OWASA processes every month are made through a contractors The Network Computing Corporation. Not all of the activities involved in billing, however, are carried out by this company. The OWASA billing process is carried out in three stages: 1) input of information to the computer, 2) computer bill processing, and 3) delivery to customers. Figure III-l shows a schematic of the billing process.
The first part of the billing process is carried out by OWASA and consist of receiving the record books containing
new readings of customer meters and sending this information
by telephone to the computer of the billing service company,
with the use of a computer terminal and modem.
The second stage of the billing process starts when
the Customer Relations Division of OWASA requests customer
bills from the billing company. Usually, the OWASA request is
presented forty eight hours prior to the deadline for sending
bills to the customers. Once the request is received, the
contractor processes the accounts, prints the bills, and
THE BILLING PROCESS
^
2. The information is
stored in the computer
1. Meter readings ore recorded- rhe books
containing the information
are turned to the Customer Relations Division of OWASA
3. The infornrKition is sent to
the billing company^ mainframe
computer.
4. The bills of the cycle
are printed and sent
to OWASA. 5. Bills are inserted in envelopes
postmarked and sent to the
customers.
Figure II1-1
In the last part of the process* OWASA receives the
bills from the billing company in the morning of the deadline
date, inserts the 3,500 bills in envelopes in three to four
hours with the help of an inserting machine, postmarks all
the envelopes with another machine, and finally deposit them
in the post office to be delivered to the customers by mail.
The collection of revenue is done mainly by mail.
Along with the bill that OWASA sends to customers is an
envelope with the address of OWASA printed on the front. This
envelope is given to the customer for paying his or her water
bill. The customer usually writes a check to OWASA for the
amount that appears on the bill, puts the check in the
envelope, and sends it to OWASA by mail. The payment is
usually received by OWASA no more than two days later. The
revenue collection system is very efficient and convenient
for the customer; however, if the customer wants to pay
directly in the office of OWASA, he or she can do so.
3.4 Setting Prices
3.4.1 Water Charges and Fees
OWASA has established several charges and fees to
"m^^rt^
by OWASA became effective January 1, 1986) and consists of
the following main water charges:
1. Water Service Charge
E. Water Commodity Charge
3. Water Availability Charge
4. Water Front Footage Fee
5. Water Main Taping Fee
6. Water Service and Meter Installation
7. Supplemental Fire Protection
8. Temporary Hydrant Meter
9. Miscellaneous Charges
Water Service Charge: This is a fixed monthly charge intended
to recover part of customer relations costs, meter and
lateral maintenance and 20'/. of the capital costs of those
facilities that serve the entire population (including, for
example, trunk mains but not water distribution mains). This
charge is required of all customers, and the amount varies
according to the size of the meter. Table III-^ shows the
water service charges for different meter sizes.
Water Commodity Charge; This is a charge per unit volume (per
thousand gallons), which is intended to recover most of the
operating costs and a portion of the capital costs. The
charge is a single price (*1.60 per thousand gallons),
Table III-^
OMASA WATER CHARGES Water Service Charge;
Meter Size Monthly service charge
5/8" 1" l-l/S" 2" 3" ^" 6" 8"
* ^ .30 * e 75 $ 16 .25 $ 25 .00 * 49 .00 * 76 00
$ 150.00 $ 240.00
II. Water Commodity Charge: $ 1.60/Thou5and gallons.
III. Water Availability Charge:
Meter Size Acreage Allowance Base Amount
5/8" 0.4 acres * 1,270
1" 1.0 * 3,200
l-l/E" 2.0 * 6,300
2" 3.2 $ 10,100
3" 6.4 * 20,200
4" 10.0 * 31,600
6" 20.0 * 63,200
8" 32.0 $101,000
Acreage Surcharge = $320/acre
IV. Supplemental Fire Protection;
A. Site-Specific Fire Service
Service Size Monthly Service Charge
2" 3" 4" 6" 8" * 22.00 * 44.00 * 66.00 $ 125.00 * 210.00
B. Site-Specific Water Hydrants *9.00 per hydrant
V. Water Front Footage Charge;
^'TW*--'
Minimum charge = *550.00
Table 111-''* (continuation)
OUASA WATER CHARGES
VI. Temporary Hydrant Meter Charge:
Service Charge = *75.00
Security Deposit:
Meter Size Security Deposit
1" $100.00 3" $500.00
VII. Water Service and Meter Installation;
Type of Service Charge
Complete water sevice installation, 5/8" $410.00
Complete water sevice installation, 1" $500.00
Meter Only Installation, 5/8" $ 80.00
Meter Only Installation, 1" $120.00
Meter Only Installation, 1-1/E" $255.00
Meter Only Installation, 2" $760.00
Meters larger than 3" are installed by the contractor.
VIII. Water Main Tapping Fee;
The charge will vary according the job. It is determined
based on the time and equipment used plus an allowance for
overhead, minimum charge $75.00.
Source: OWASA
applicable to all customers, independent of the quantity of
water consumed.
Water Availability Charge; This one-time charge was created
to recover part of the capital costs of providing current
capacity of the water system. The charge is levied for each
new connection to the water system. The charge varies
according to the size of the meter and the acreage of the
property. Table III-4 presents the schedule of charge for
different meter sizes and property areas. For example, a new
customer with 0.5 a.c.re lot and 5/B inch meter would have to
pay $1370 + $320(0.5-0.-^) = *130E to connect to the system.
Water Front Footage Fee; This charge is to recover the cost
of extending the distribution system into new areas. The
water front footage charge is $11.00 per front foot of the
property. The minimum charge is $550.00.
Water Main Tapping; This charge aims to recover the cost of
labor and equipment used in making a tap into the water main
plus an allowance for overhead. The charge varies according
to the size of the job but never is less than $75.00.
Water Service and Meter Installation Charge; This charge is
to recover the cost of extending service from the street main
the service connection and the customer's meter. The charge varies with the size of the meter and whether the job
includes complete service installation or just the meter.
Table III-'^ shows the charge for different type of installa¬
tions.
Supplemental Fire Protection; There are two specific charges
in this category: 1) site-specific fire service charge, and
2) water hydrant charge. Both charges a.re intended to recover
the costs of providing adequate system capacity for fire
protection. The site-specific fire service charge is applica¬
ble to all customers with private fire protection systems. The charge depends on the diameter of the service line, as
shown in Table I 11-^. The water hydrant charge is intended to
recover the marginal cost of having to use larger diameter
pipes in the network for fire protection. This charge is
$9.00 per hydrant per month, which is paid by the Towns of
Chapel Hill and Carrboro.
Temporary Hydrant Meter Charge; This charge is applied to
construction projects that take water from the distribution
system. A charge of $75 is made for having to install a
temporary meter; it has to be paid in advance by the contrac¬
tor plus a security deposit for the meter.
Miscellaneous Charues; OWASA includes in this classification
charges such as: service initiation fee, record change
charge, charge for reconnection of delinquent account,
returned check charge, security deposits, bulk water sales,
and field and shop meter tests charges (when the test is done
at customer request).
3.^.E Water Rates Determination
In setting its rates, QUIASA generally follows the
recommendations of the AWWA. The OWASA rate structure has the
basic objective of making the Authority financially
selfsuf-ficient. This means that water prices, charges, and fees are
set so that the generated revenue covers the financial costs
of providing service. The current tariff, therefore, recovers
operation, maintenance, administration and capital costs.
The current OWASA water rate schedule is the product
of a cost-of-service study conducted by a private consulting
firm, Arthur Young and Company, in 1985. The study covered
both water and wastewater charges and consisted of three
steps: 1) determination of revenue requirements, 2) determi¬
nation of specific service costs and charges, and 3) cost
In the first step, the financial costs that must be
recovered from revenue were identified as "cash needs". The
process consisted of selecting a time horizon of three years
(1986-1988) and estimating the revenue requirements that
would be needed during that period.
The financial costs that were determined for the
three-year period were: a) operation and maintenance require¬
ments, and b) capital costs and debt service. Operation and
maintenance revenue requirements were calculated by forecast¬
ing to 1988 the operation and maintenance cost based on the
1985-86 operating budget, considering a 7.5*/. inflation rate
and annual growth rates in accounts of 3.0*/. to 3.5*/.. Capital
costs were also forecasted for the three years; They included
all major and small water projects plus capital equipment
purchases. The final component forecasted was debt service.
OWASA has existing debt service related to bonds that were
issued in 1985 plus general obligation bonds from the Towns
of Chapel Hill and Carrboro that the Authority assumed in
1977; additionally, OWASA expects to issue bonds in 1987. The
total revenue requirements for the three-year period was
divided into the categories shown in Table III-5.
The second step in the rate study was the determina¬
tion of specific costs and corresponding charges that should
be included in the rate schedule. A specific charge is
Table III-5
CATEGORIES USED IN THE THE TOTAL REVENUE ESTIMATION
FOR THE THREE-YEAR PERIOD
I. OPERATION COSTS
A. Water Supply and Treatment
B. Water Distribution
C. General Administration
D. Customer Relations
E. Contingency
II. CAPITAL COSTS
A. Cash Financed Capital Project Ordenances
B. Current Year Capital Projects and Capital Equipment
C. Debt Service
1. Existing Debt Service E. Proposed Debt Service
intended to recovers the cost of providing a specific service. If a charge is not created, the cost of proving the
specific service would have to be covered from the general
revenue (Arthur Young 1985). Specific charges were establi¬ shed for the items presented at the beginning of section 3.^ (not including monthly service charges and commodity
charges).
The third stage in the water rate study involved cost
allocation and setting of rates for the monthly service charge and the commodity charge. First, the projected revenue from all the specific charges for the period 1986-1988 was subtracted from total revenue requirements, calculated in the first stage. The result was net revenue requirements for the three-year period. Then, this requirement was allocated to
the water and sewer components. This was done by selecting in
each one of the categories of the net revenue requirement shown in Table 111-5 the proportion corresponding to sewer and that to water. The net revenue requirement allocated to the water component (water net revenue requirement) was then used to calculate the service charge and the commodity
charge.
Having obtained the water net revenue requirement,
before calculating the service and commodity charges, it was
necessary to calculate the unit cost of service. First, the
water net revenue requirement was divided into five catego¬
ries: 1) customer relationsj S) meter maintenance, 3) lateral
maintenance, ^) SOVJ of water capital, and 5) commodity costs
(including about 80'/. of the capital costs). Then, an estimate was made of projected monthly customer accounts, the number
of meter equivalents in the system 3/, and the total volume of water that will be billed to the customers in the three-year period. The next step was to calculate the unit costs
for the previous five categories. The service relations costs
were divided by the projected number of accounts, the meter
maintenance, lateral maintenance, and 20*/. capital cost were
divided by the number of meter equivalents in the system, and
the commodity cost was divided by the estimated total volume
of water to be billed. Having obtained the unit cost, the
next and last step was to calculate the service and commodity
charges.
The monthly service charge was calculated for differ¬
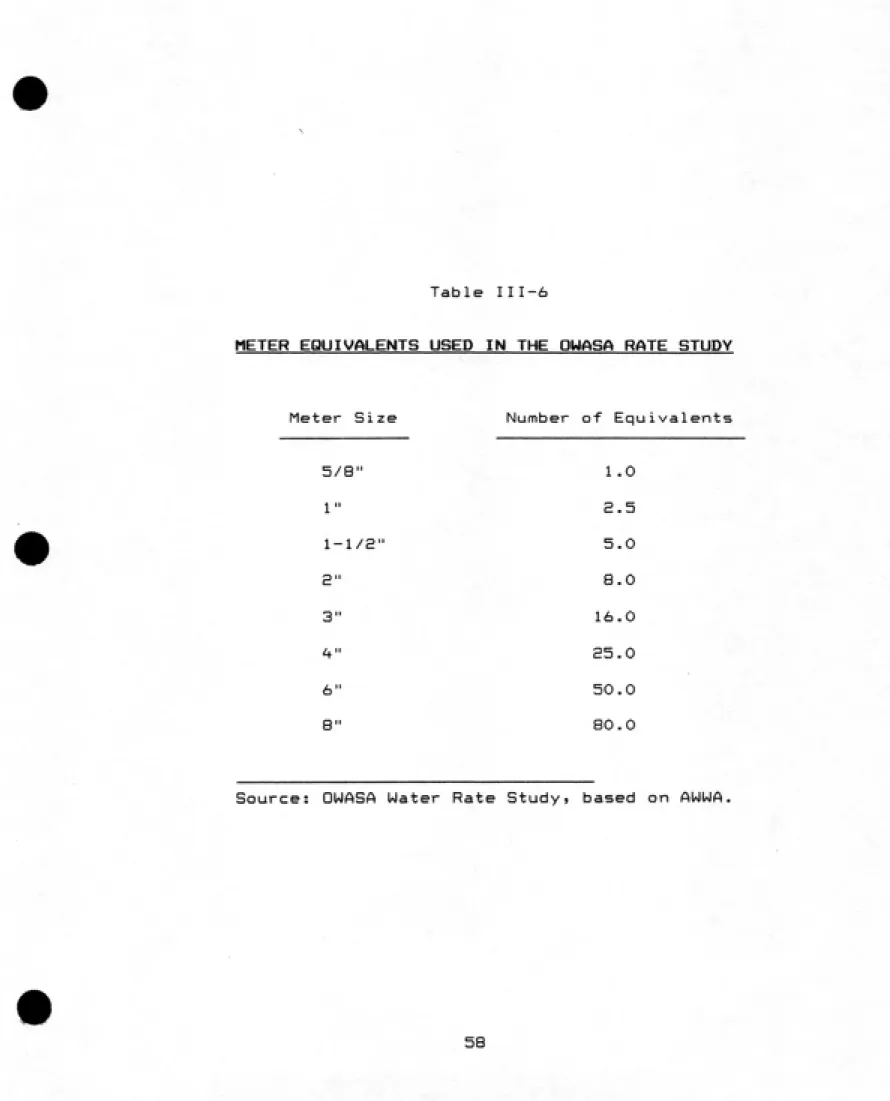
ent size meters. It was first necessary to estimate the total
number of equivalent 5/S-inch meters in the system. This was
done using the values in Table III-6, which ars from AWWA.
3/ A meter equivalent is a number that relates the rated hydraulic capacity of a given meter to the capacity of
a 5/8" nominal size meter. For more information refer
to the AWWA Manual No.5 page 90.