The Impact of Pregnancy Intention on Child Assessment Scores
By Sarah Levine
Honors Thesis Economics Department
University of North Carolina at Chapel Hill April 2013
Approved:
1 Abstract
Nearly half of all pregnancies resulting in live births in the United States are unwanted or mistimed. Understanding the long-term consequences of unintended births is key to determining the importance of allocating resources to programs that promote greater access to and knowledge about contraception. In this study, I use Seemingly Unrelated Regression systems both with and without fixed effects to evaluate whether children resulting from unintended pregnancies underperform on standardized assessments. When estimated without fixed effects, the relationship between maternal use of contraception at the time of conception, which should indicate an unintended pregnancy, and a child’s test scores appears significant and positive. However, after adding fixed effects,
2
Acknowledgements
3 I. Introduction
Of the 6.7 million pregnancies in the United States each year, roughly 49% are unintended. Furthermore, the proportion of unintended births has remained essentially stable for roughly the last two decades, putting an end to a previous trend of significant decrease (Finer and Zolna 2011). The impact of these approximately 3.2 million unintended pregnancies is traditionally assessed through the lens of public health;
however, should it also be viewed as an issue of intergenerational economic significance? The question I seek to address in this study is whether children resulting from unintended pregnancies experience poorer outcomes in their first fourteen years of life. I will gauge child outcomes by comparing children’s performances on various assessments including reading, math, vocabulary, and verbal memory, as well as rankings on scales for quality of home environment and degree of behavioral problems.
For the purpose of this study, I use a strict definition of intention. Unintended pregnancies encompass only pregnancies that were not desired at the time of conception, nor at any point thereafter. Pregnancies that were wanted at the time of conception or at some point in the future are classified as intended. Although there is a wealth of research available on the relationship between pregnancy intention and child outcomes, the results from such studies are often conflicting. For example, Crissey (2005) finds that
4
improving upon definitions of intention and by developing an improved method for controlling for potential confounders.
When paired with its Child and Young Adult supplement, the National Longitudinal Survey of Youth 1979 (NLSY79) provides a unique opportunity for exploring the potential link between a mother’s intentions for a given pregnancy and the outcomes of the child resulting from that pregnancy. Thus, I will use this dataset to empirically determine whether such a link exists.
The results of my study have significant implications. If there is in fact a link between mother’s pregnancy intention and child outcomes, then policies that promote greater access to contraception and the dissemination of information about effective contraception use can be viewed as investments in human capital formation in addition to remedies for a prominent public health concern. This issue is particularly relevant today given that the Obama administration’s birth control mandate took effect in August 2012 despite a sizeable opposition, granting millions of women free access to contraceptives and reproductive health services, all while federal funding for family planning services such as Planned Parenthood continues to be fraught with controversy. Thus, my study will add to the information available for empirically evaluating the potential economic benefits of these programs, as well as other public policy initiatives that make
contraception, family planning services, and information about reproductive health more readily available.
II. Literature Review
5
will provide a brief overview of the existing literature on the impact of pregnancy intention on child outcomes in order to elucidate how this study will build upon and borrow from previous research in the field.
One of the biggest difficulties inherent in pregnancy intention research is actually determining an accurate measure of pregnancy intention. A substantial number of
existing measures depend partially or wholly on mothers’ retrospective, or postpartum, responses about their intentions. Joyce, Kaestner, and Korenman (2000) avoid using retrospective reporting of intention by looking at a question from the National Longitudinal Survey of Youth (NLSY) that asks each female respondent how many children she expects to have; they then count any child over this number as unintended. This approach, though easy to use and interpret, seems overly simplified and likely does not distinguish between types of pregnancies entirely accurately. Still, the alternative option of using retrospective reporting is not without its own flaws. For example, Westoff and Ryder (1977) and Rosenzwieg and Wolpin (1993) call the reliability of retrospective intention reporting into question, asserting that it is subject to ex-post rationalization, meaning that mothers who did not initially intend to become pregnant will report that the pregnancy was intended after the child is born. However, in a follow-up to these ex post rationalization studies, Joyce, Kaestner, and Korenman (2002) determine that, on the whole, retrospective reporting is as accurate a measure of pregnancy intention as prospective reporting, so I will conduct my study under this assumption.
6
use a standard dichotomous classification, such as seen in Jansen and Ahlburg (2002),in which a response of “yes” to a question asking a mother if she wanted a given pregnancy classifies that pregnancy as intended, while a “no” classifies that pregnancy as
unintended. In a qualitative study, Joseph Stanford et al. (1998) interview 27 pregnant women who are seeking either prenatal care or abortion in order to critique the accuracy of this kind of dichotomous classification scheme. They find that there are at least five distinct dimensions that determine the intendedness of a pregnancy: desire prior to conception, preparation for pregnancy prior to conception, fertility behaviors and expectations, desire for pregnancy after conception, and adaptation to pregnancy after conception. They also find that women’s partners strongly influence both their
preconception and post-conception pregnancy desires, suggesting that a classification scheme such as that employed by Frenzen and Hogan (1982), which incorporates whether or not a woman’s partner wants the current pregnancy, is more appropriate than the dichotomous measure.
7
In their 1999 study, Bachrach and Newcomer challenge the idea that intended pregnancies and unintended pregnancies are distinct categories at all; rather, they assert that the intendedness of a pregnancy is a continuum consisting of at least two dimensions: intentionality prior to the pregnancy and feelings after conception. They assert that
intending a pregnancy is reflected in planning to conceive, whereas wanting a pregnancy is reflected in positive affect after conception. They also critique the common practice of categorizing any pregnancy that occurs while a woman is using a birth control method as a contraceptive failure, since this method of classification does not distinguish between failures that occur due to improper use and those that occur despite proper use.
Distinguishing between types of contraceptive failures is important because the implications of the two types are not the same. A failure despite proper use clearly indicates that a woman was doing everything within her power to prevent a pregnancy; however, a failure due to improper use indicates that a woman was either less
conscientious in her contraceptive use, less informed, or both. Therefore, the first category potentially reflects a stronger aversion to conception than does the latter.
Although Bachrach and Newcomer view the traditional dichotomous categorization of pregnancies as either strictly intended or unintended as an oversimplification of a phenomenon that is composed of theoretically distinct
8
Another barrier to the study of the long-term consequences of unintended pregnancy is the fact that historically, there has been very little data available in the United States that tracks unintended children past very early childhood. Thus, virtually every study on pregnancy intention has focused on outcomes dealing with maternal prenatal behaviors, infant health and mortality, and early childhood health and cognitive development rather than on educational attainment or labor market outcomes.
Baydar (1995) uses NLSY data from 1986 and 1988 to show that unwanted and mistimed children under the age of two receive fewer developmental resources at home than their wanted counterparts. She measures the availability of household developmental resources by creating three subscales, from the Home Observation for the Measurement of Environment, that rate the quality of opportunities for skill development, the positivity of mother-child relationships, and the level of authoritarianism of a mother’s parenting style. Baydar finds that planning status does not impact the developmental resources allotted to infants, but that unwanted and mistimed children over the age of one experience significantly fewer opportunities for skill development and have more authoritarian parents. Furthermore, unwanted children under the age of two score higher on fearfulness and lower for positive affect. By preschool, unwanted children are also more likely to have negative relationships with their mothers and to score lower on verbal development tests. However, it is unclear whether unwanted children receive fewer resources because they are unintended or rather if they are unintended because their mothers knew they did not have adequate resources to raise a child.
9
and Infant Health Survey and its 1991 Longitudinal follow-up to construct a composite measure of pregnancy intention that combines retrospective reports of both pregnancy intention and contraceptive use. She acknowledges that both measures have their own limitations and thus combines them to provide a measure of intention that incorporates both a mother’s attitude and behaviors. Crissey splits pregnancies into four
classifications: intended and not using birth control, intended and using birth control, unintended and using birth control, and unintended and not using birth control. Using logistic regression with this composite measure, Crissey finds that children from unintended pregnancies have poorer health, exhibit lower levels of activity, and score lower on developmental assessments. However, these results may not be entirely accurate since she does not adequately control for potential confounders.
10
causally attributing child outcomes to the pregnancy intention itself rather than to unobservable confounders.
When using this fixed-effect model, Joyce, Kaestner, and Korenman find that unwanted pregnancies adversely affect maternal behaviors that impact infant health, but that birth weight and cognitive development are unaffected. Furthermore, the magnitude of the estimated relationship between pregnancy intention and maternal behaviors is much smaller in [is that sufficient?] the aforementioned fixed-effect model as opposed to a model that only includes controls for observable family characteristics. While Joyce, Kaestner, and Korenman’s study is a significant improvement on existing research, it likely does not paint a complete picture of the link between pregnancy intention and child outcomes because it uses a simple dichotomous classification of pregnancy intention.
Though sibling studies adequately control for unobservable confounding variables, they potentially underestimate the consequences of pregnancy intention by ignoring the way in which an unintended pregnancy impacts intended siblings. Since the birth of an unintended child unexpectedly decreases every sibling’s share of resources without also increasing the size of the family’s resource pool, it is plausible that the consequences of an unintended pregnancy are not limited just to the child resulting from that pregnancy, but rather that every child in a family is affected by the addition of an unintended sibling. Sibling studies, however, do not capture this family-wide effect.
11
children in that family, as perceived by outsiders or the parents themselves. They believe that holding the quality of children in a given family constant, the cost of each additional child is greater the higher the constant quality. Additionally, the cost of increasing the quality of a child, holding the number of children in the family constant, increases with number of children. Thus, they conjecture that advances in birth control knowledge are crucial for increasing child quality, as this significantly reduces the number of children per family and also increases the quality of each child.
Until recently, there has not been enough information in the United States for research to be conducted on the impact of pregnancy intention on child outcomes through mid-adulthood. However, many countries in Eastern Europe and Scandinavia keep
detailed registers of all births, and thus such studies have been possible in these parts of the world. In a 1995 study, Myhrman et al. use binary regression analysis on over 10,000 births in Northern Finland to determine whether a child’s educational attainment varies by pregnancy intention. After controlling for family background, they find that
unintended males are 6.0% less likely to attend secondary school compared to their intended counterparts, and that females are 6.3% less likely. Overall 25% of unwanted males did not continue past compulsory schooling, compared to 19% of females. In the wanted subsample, 14% of males did not continue past compulsory schooling, compared to 9% of females. Thus, they find that the long-term impact of pregnancy intention differs by gender.
12
supporting the hypothesis that unwanted children have poorer outcomes in adulthood. However, Cameron and Tichenor (1976) criticize this study, highlighting the fact that the mothers denied abortions and the control-group mothers are different in major respects that went unaccounted for. For example, the control group was of higher socio-economic status than the experimental group. In addition, the mothers denied abortion more
frequently sought psychiatric assistance than the control group mothers. Thus, Cameron and Tichenor conclude that the differences in outcomes for the children in the Sweden study cannot be causally attributed to pregnancy intention with any certainty.
David, Dytrych, and Matejcek (2003) build on the Swedish denied-abortion study, conducting a similar investigation on births to women in Prague who were twice-denied abortion for the same pregnancy. They place great emphasis on pair-matching unwanted children with wanted controls1 and on conducting psychological evaluations, two features that were neglected in the Swedish version of the study. The Prague study follows 220 individuals whose mothers were twice-denied access to abortion according to the Prague Appellate Abortion Commission, the body in charge of granting abortion requests in Communist Czechoslovakia. The study includes four follow-up waves conducted at ages 9, 14-16, 21-23, 30, and 35, with the latter two waves including sibling controls to account for potential confounders that emerged as problematic in the first three waves.
The Prague study finds that the differences in psychosocial development between unwanted children and wanted controls, though present, are not dramatic. Furthermore, these differences are dynamic over time, gradually decreasing as children reach mid-adulthood. In addition, findings from the study indicate that unwanted children are not
13
more prone to negative outcomes, but rather are less prone to excellent outcomes. Compared to sibling controls, unplanned children were also more likely to report having been psychiatric patients in adulthood. However, as I previously mentioned, the use of sibling controls potentially understates the consequences of pregnancy intention. These consequences may also be understated because many Czech women who were absolutely determined not to give birth found other means to abort their pregnancies, resulting in a selection problem. In addition, the unique social circumstances that allowed for this study in Prague also likely mean that the results of this study cannot be extrapolated to other countries.
Barber, Axinn, and Thornton (1999) conduct an American denied-abortion study using data from the Intergenerational Panel Study of Mothers and Children, a
longitudinal sample started in 1961, a year in which abortion was illegal in the United States. They find that unwanted births are linked to mental health problems for the mothers and strained relationships between mothers and children. However, it does not follow the children into adulthood, and thus there are no results available on the long-term outcomes for children born to women denied abortion in the United States.
An unavoidable problem that affects nearly all of the aforementioned literature is selective pregnancy recognition, or the phenomenon in which women who are actively trying to conceive recognize their pregnancies earlier than women who do not plan to become pregnant (Joyce, Kaestner, and Korenman 2002). Thus, mothers with unintended pregnancies likely engage in more harmful prenatal maternal behaviors simply because they do not realize that they are pregnant, not because they are bitter about their
14
could be overstated, meaning that findings such as those of Bustan and Coker (1994), which suggest that the neonatal mortality rate of infants born from unintended
pregnancies is nearly twice that of those born from intended pregnancies, cannot always be taken at face value.
The most significant challenge inherent in pregnancy intention studies is that women who have unintended pregnancies most likely systematically differ from women who have intended pregnancies in ways that are not observable. Hence, it can be difficult to determine whether differences in child outcomes can be causally attributed to
pregnancy intention alone, or rather whether these differences are due to unobservable characteristics that are correlated with intention. Of the existing approaches to mitigating this issue, Joyce, Kaestner, and Korenman’s (2000) fixed-effect model appears to be the most effective.
My study will contribute to the existing literature by combining a more
comprehensive definition of pregnancy intention with a model that adequately controls for unobservable confounders. If I determine that a link does in fact exist between pregnancy intention and child outcomes, then Joyce, Kaestner, and Korenman’s (2002) finding that there is no link could be attributed to an inadequate categorization of intention. However, if I find no practically or statistically significant relationship, then their findings will be confirmed, while Crissey’s (2005) findings will be refuted.
III. Theoretical Model
15
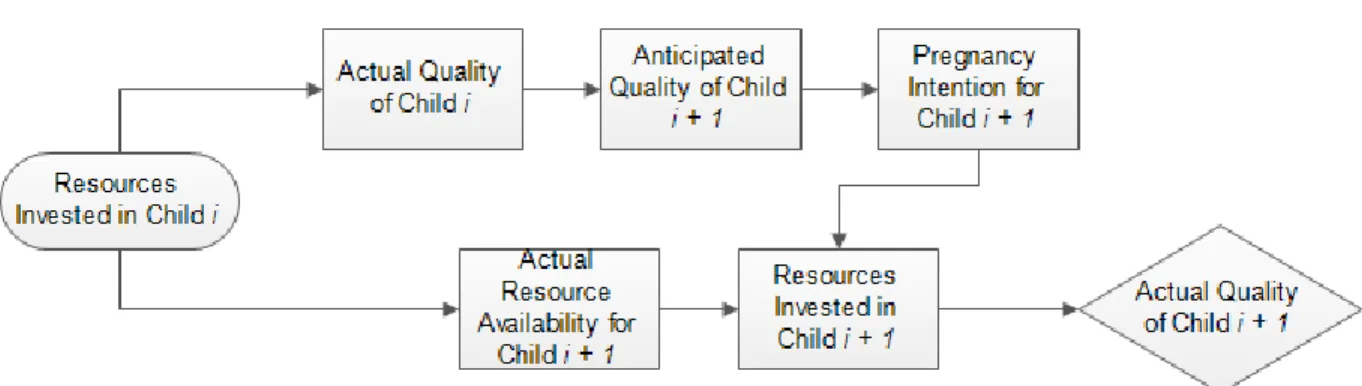
intention, there has been little exploration into the factors that initially determine a woman’s intention for a given pregnancy. Similarly, myriad studies have sought to prove that there is a link between pregnancy intention and child outcomes, yet such research contains little theoretical justification as to why such a link would exist. Thus, I will provide a theoretical model in order to offer potential answers to these questions, thereby providing a stronger grounding for the hypothesis that pregnancy intention does in fact impact child outcomes. For a visual representation of the model, see Figure 1.
Figure 1. Model of the mechanisms by which preferences and resource availability determine pregnancy intention and child quality
16
resources in the future for producing a child that either meets or exceeds her child quality threshold. An individual mother’s thresholds for both child quality and resource
availability are determined by individual childrearing preferences. Assuming all potential mothers are rational agents, a woman who predicts that her resources will be sufficient will choose to reproduce, and thus be classified as having an intended pregnancy.
Alternatively, a woman who predicts that her future resources will be insufficient will not choose to have a child, and thus any resulting pregnancy must not have been intended. A woman who does not view her circumstances to be adequate for childrearing can also choose to use contraceptives, if readily available, until she reaches her predicted resource potential threshold and thus has an intended pregnancy. The actual quality of a child is determined by the quantity and quality of resources invested in that child, which in turn is determined both by pregnancy intention and by resource availability directly.
In the context of this model, a resource is defined as any factor, tangible or otherwise, that a mother deems necessary for child-rearing. Thus, resources encompass not only basic needs such as a reliable food supply and consistent shelter, but also factors such as job security and emotional support from her partner. However, a woman’s
current, absolute resource level is not the important factor in this model; rather, it is her anticipated resource level. Specifically, the key variable is whether or not she predicts that she will have enough resources in the future to warrant having a child. A woman will only perceive her potential resource level to be adequate for childrearing when she
17
children, there does not exist a predicted child quality at which she will be willing to conceive, and consequently there does not exist a predicted resource level at which she will be willing to have a child. Thus, a woman’s pregnancy intention is jointly
determined by her access to resources combined with her personal childrearing preferences.
The quality of a child is the direct result of the quantity and quality of resources invested in rearing that child. Clearly, the amount of resources available to a mother directly impacts the amount of resources invested in a child; a mother with more resources to begin with will have more resources to invest. However, a mother’s
pregnancy intention also plays a role in determining how resources are allotted to a child both pre- and post-partum. The first mechanism by which pregnancy intention determines resource allocation is selective pregnancy recognition (Joyce, Kaestner, and Korenman 2002). Women who intend to conceive are more likely to recognize their pregnancies earlier, and thus are more likely to engage in early prenatal care and to stop harmful maternal behaviors during the early stages of pregnancy. Another avenue through which intention determines resource allocation is planning. A woman who intends to have a pregnancy has likely put more thought into how to raise her child, and thus is better equipped to allocate her available resources effectively. Lastly, a woman who did not intend to become pregnant may invest fewer resources in her child simply because she did not want the child to begin with.
18
A woman who uses contraception has much greater control over her fertility, and thus can plan her own life with significantly more certainty. For example, a woman using contraception can safely choose to invest in her own career since she knows that her investment will not be in vain due to an unexpected pregnancy that requires time off from work. Thus, not only does resource availability determine contraceptive use, but using contraception can also increase a woman’s perceived resource potential.
In theory, birth control use should be a direct reflection of pregnancy intention; a woman who wants a child will not use any form of contraception and a woman who does not want a child will use some form of contraception. However, this is not always the case. The phenomenon in which women report both using contraception and also wanting the child could potentially reflect one of the following situations: justification of the pregnancy after the fact, a partner who did not want the pregnancy, or simply dishonest reporting. The situation in which a woman reports not wanting the pregnancy and also not using contraception likely reflects either lack of easy access to or knowledge about contraception.
In my model, pregnancy intention varies between children of the same mother because of exogenous shocks to resource availability. For example, the unexpected loss of an emotionally supportive partner would likely detract from a woman’s resource level dramatically enough to prevent her from wanting an additional child at that time. Another unpredictable shock to the system is the sex of previous children; for example, if a
19
dynamic factors that can serve as mechanisms that change a mother’s perceived resource potential, and thus her pregnancy intention.
A mother’s pregnancy intention could also change due to sibling feedback, as illustrated in Figure 2. The resources invested in a given child directly impact the quality of that child, which in turn impacts the predicted quality of the next child and finally the mother’s desire to have another child. In parallel, the amount of resources invested in a given child plays a role in determining the resources that will be available for raising the next child born, which in turn impacts the quality of that next child.
Figure 2. Model of Sibling Feedback
If this theoretical model holds, I expect that unintended children will experience poorer outcomes, as measured by lower performance on various standardized
assessments, due to less effective resource investment.
IV. Empirical Approach and Data
20
available data in order to approximate these categories. In my empirical analysis, I estimate models using three different measures of intention obtained from the National Longitudinal Survey of Youth (NLSY): whether the mom wanted the pregnancy, whether the mom’s partner wanted the pregnancy, and whether either the mom or her partner was using contraception prior to the pregnancy. Although each measure has its own strengths and weaknesses, using all three provides a fairly comprehensive picture of intention, with the first two measures reflecting affect post-conception and the third measure reflecting behavior prior to conception.
The other primary challenge inherent in pregnancy intention research is dealing with unobserved heterogeneity since mothers who have unintended pregnancies likely systematically differ from mothers who have intended pregnancies in ways that are not observable. In order to control for and determine the significance of these potential unobservable confounders, I estimate models using both Ordinary Least Squares (OLS) and within-mother fixed-effects (FE). In the latter approach, I compare test scores of children from the same mother to control for all unobservable family background and maternal characteristics, thus isolating the effect of intention.
This study works with the empirical model that Joyce, Kaestner and Korenman (2000) use to estimate the impact of pregnancy intention on child development:
𝑞𝑖𝑡= 𝛼0+ ∑ 𝛽𝑗∑ 𝑋𝑖𝑗𝑡+ ∑ 𝜆𝑗∑ 𝑍𝑖𝑗𝑡+ 𝛼1𝑈𝑁𝑊𝐴𝑁𝑇 + 𝛷𝑖+ 𝜀𝑖𝑡 (1) 𝑇
𝑡−𝑘 𝐽
𝑗 𝑇
𝑡−𝑘 𝐽
𝑗 𝑞𝑖𝑡= 𝑐ℎ𝑖𝑙𝑑 𝑜𝑢𝑡𝑐𝑜𝑚𝑒𝑠 𝑘 = 𝑐ℎ𝑖𝑙𝑑′𝑠 𝑎𝑔𝑒 𝑖 = 𝑖𝑛𝑑𝑒𝑥 𝑜𝑓 𝑐ℎ𝑖𝑙𝑑𝑟𝑒𝑛 𝑡 = 𝑖𝑛𝑑𝑒𝑥 𝑜𝑓 𝑡𝑖𝑚𝑒
𝑗 = 𝑖𝑛𝑑𝑒𝑥 𝑜𝑓 𝑐ℎ𝑎𝑟𝑎𝑐𝑡𝑒𝑟𝑖𝑠𝑡𝑖𝑐𝑠
𝑋𝑖𝑗𝑡= 𝑒𝑥𝑜𝑔𝑒𝑛𝑜𝑢𝑠 𝑚𝑒𝑎𝑠𝑢𝑟𝑒𝑠 𝑜𝑓 𝑓𝑎𝑚𝑖𝑙𝑦 𝑏𝑎𝑐𝑘𝑔𝑟𝑜𝑢𝑛𝑑 𝑎𝑛𝑑 𝑝𝑎𝑟𝑒𝑛𝑡𝑎𝑙 𝑐ℎ𝑎𝑟𝑎𝑐𝑡𝑒𝑟𝑖𝑠𝑡𝑖𝑐𝑠 𝑍𝑖𝑗𝑡 = 𝑝𝑜𝑡𝑒𝑛𝑡𝑖𝑎𝑙𝑙𝑦 𝑒𝑛𝑑𝑜𝑔𝑒𝑛𝑜𝑢𝑠 𝑚𝑒𝑎𝑠𝑢𝑟𝑒𝑠 𝑜𝑓 𝑝𝑎𝑟𝑒𝑛𝑡𝑎𝑙 𝑐ℎ𝑎𝑟𝑎𝑐𝑡𝑒𝑟𝑖𝑠𝑡𝑖𝑐𝑠
𝑈𝑁𝑊𝐴𝑁𝑇 = 𝑝𝑟𝑒𝑔𝑎𝑛𝑐𝑦 𝑖𝑛𝑡𝑒𝑛𝑡𝑖𝑜𝑛
21
A given assessment score for child i at time t is the result of exogenous family background characteristics, potentially endogenous parental characteristics, pregnancy intention, and other fixed, unobservable characteristics. Summing 𝑋𝑖𝑗𝑡 and 𝑍𝑖𝑗𝑡 over time allows for the cumulative effect of factors such as income and participation in
government programs to impact child outcomes.
In the OLS regressions, I control only for observable family background and maternal characteristics, which leaves the unobserved, fixed characteristics unaddressed. In the FE regressions, I keep these controls for observable characteristics, while also controlling for any unobservable characteristics associated with a given mother. If the equations remain relatively the same when estimated using OLS and FE, then any differences in outcomes can be attributed to pregnancy intention itself. However, if adding fixed effects changes the estimated coefficients on the intention measures, differences in outcomes are more likely due to systematic differences between types of mothers.
For each of the seven assessment score outcome variables, I estimate six different equations: one equation for each of the three measures of intention using OLS and one equation for each of the three measures using FE. However, I do not estimate each of these equations independently. Rather, I use a Seemingly Unrelated Regression (SUR) system to jointly estimate the equations for all assessment scores, grouped by intention measure. The SUR approach is most often used to generate more precise estimates when there is cross-equation error correlation in a linear system. However, the primary
22
This joint test will reflect whether the results from the various equations contradict or reinforce each other. Combining SUR with OLS is straightforward, but combining it with fixed-effects requires manual demeaning of both the dependent and independent
variables. For the Stata do-file I wrote for this process, see Appendix B.
Data for this study come from the National Longitudinal Survey of Youth 1979 (NLSY79). The NLSY79 is a panel survey conducted on a cohort of men and women who were between the ages of 14 and 21 in 1979, the year of first interview, and who were between the ages of 45 and 53 at the time of their 2008 interviews. The original number of respondents in 1979 was 12,686, approximately half male and half female, and the retention rate as of 2008 is approximately 77.8%. Conducted annually until 1994 and biennially thereafter, the multi-purpose survey collects detailed information on each respondent’s labor market behaviors, education, family background, skill level, health, income, government program participation behavior, and most importantly for this study, family life (marital status, fertility, and child care).
23
Although linking NLSY mothers to their respective children is straightforward, the datasets are not structured to support easy matching of pregnancy-specific intention data to the children resulting from those pregnancies. However, after restructuring the datasets, I was able to match parental intentions to the proper observations, thus creating a workable dataset. See Appendix B for an excerpt from the Stata do-file I developed for this task.
24
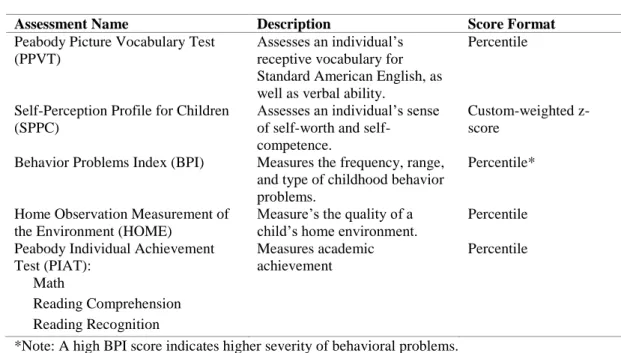
Table 1. Child Assessment Names and Descriptions2
Assessment Name Description Score Format
Peabody Picture Vocabulary Test (PPVT)
Assesses an individual’s receptive vocabulary for Standard American English, as well as verbal ability.
Percentile
Self-Perception Profile for Children (SPPC)
Assesses an individual’s sense of worth and
self-competence.
Custom-weighted z-score
Behavior Problems Index (BPI) Measures the frequency, range, and type of childhood behavior problems.
Percentile*
Home Observation Measurement of the Environment (HOME)
Measure’s the quality of a child’s home environment.
Percentile
Peabody Individual Achievement Test (PIAT):
Measures academic achievement
Percentile
Math
Reading Comprehension Reading Recognition
*Note: A high BPI score indicates higher severity of behavioral problems.
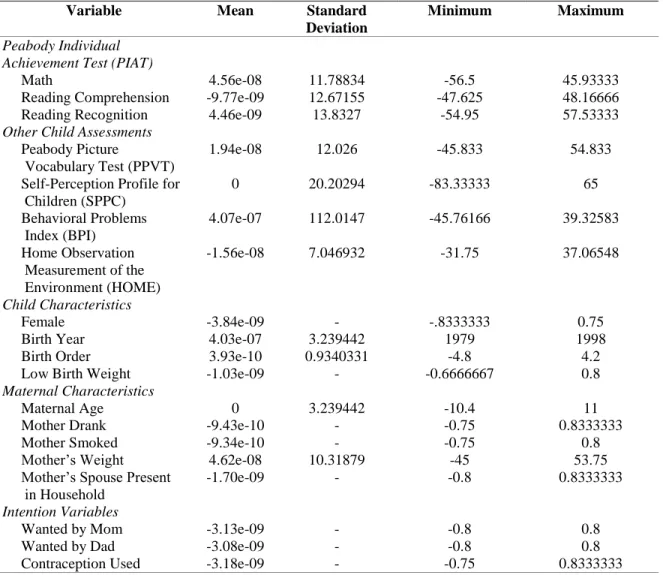
All controls relating to maternal characteristics come from the original survey, and all controls relating to child characteristics come from the child survey. However, the use of a fixed-effects model eliminates the need for an extensive set of controls relating to the mother and other family background. For a list of descriptive statistics for these controls, as well as for the outcome and intention measures, see Table 2. To view
descriptive statistics for manually-demeaned variables used in the SUR model with fixed effects, see Table 7 in Appendix A.
25 Table 2. Descriptive Statistics
V. Results and Analysis
Sample Restrictions
The sample used for analysis is restricted to those children whose mothers gave valid reports of her own intention, her partner’s intention, and her contraceptive use. In addition, each child must have completed each of the seven assessments during at least one of the survey rounds. Lastly, since I estimate models using within-mother fixed-effects, each child must have at least one sibling who meets the same requirements. The resulting sample consists of 1818 children.
Variable Mean Standard
Deviation
Minimum Maximum
Peabody Individual Achievement Test(PIAT)
Math 48.4063 22.97468 1 98.2
Reading Comprehension 47.60931 23.50139 1 97.5
Reading Recognition 54.43409 25.13245 1 99
Other Child Assessments Peabody Picture
…..Vocabulary Test (PPVT)
32.74578 26.5657 0 99
Self-Perception Profile
….for Children (SPPC)
190.433 30.19889 80 240
Behavioral Problems
…..Index (BPI)
604.2736 230.6129 5.42 99.9
Home Observation
…..Measurement of the
…..Environment (HOME)
43.1063 23.35964 0.25 95.5
Child Characteristics
Female 0.4873487 - 0 1
Birth Year 1985.541 5.231435 1979 1998
Birth Order 2.393839 1.262039 1 10
Low Birth Weight 0.0764576 - 0 1
Maternal Characteristics
Maternal Age 24.4857 5.154847 14 39
Mother Drank 0.1325633 - 0 1
Mother Smoked 0.2838284 - 0 1
Mother’s Weight 135.4197 27.80947 85 278
Mother’s Spouse Present
…..in Household
0.6386139 - 0 1
Intention Variables:
Wanted By Mom 0.5313531 - 0 1
Wanted By Dad 0.5830583 - 0 1
26
Relationships among Intention Measures
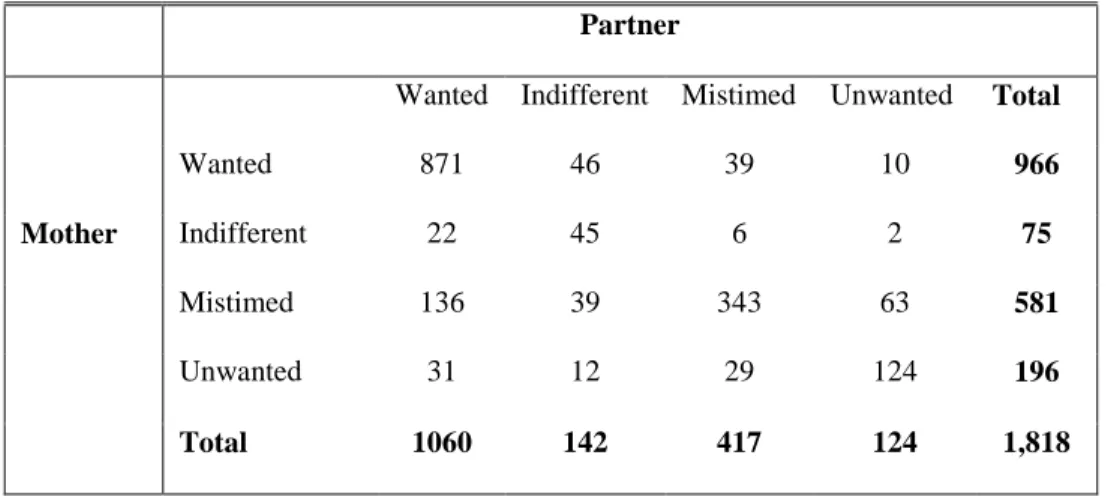
Before the main analysis, I will highlight some preliminary findings regarding the relationship between the different measures of intention. The first of these findings is that in general, a mother’s report of her own feelings towards a pregnancy matches her report of her partner’s feelings about a pregnancy. However, when the two measures do not agree, she is more likely to report that her partner felt more favorably about the pregnancy. See Table 3 below. Taken at face value, this finding seems to indicate that women and their partners have very similar fertility preferences, though men are more likely to have wanted a given child when parents disagree. However, this difference could also simply reflect women’s misperceptions of their partners’ affects post-conception.
Table 3. Cross-Tabulation of Mother Wantedness vs. Partner Wantedness
Partner
Mother
Wanted Indifferent Mistimed Unwanted Total
Wanted 871 46 39 10 966
Indifferent 22 45 6 2 75
Mistimed 136 39 343 63 581
Unwanted 31 12 29 124 196
Total 1060 142 417 124 1,818
Pearson chi2(12) = 1.7e+03 Pr = 0.000
27
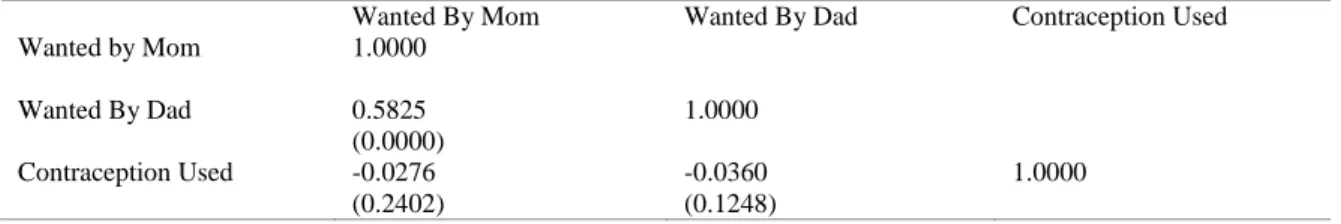
of women in the sample whose behaviors prior to conception were not consistent with their reported feelings toward their pregnancy. This unintuitive result likely reflects the fact that mistimed births are grouped with intended births during regression. Furthermore, this trend could reflect either dishonest reporting or the fact that women who did not intend to become pregnant actually feel positively about their pregnancies post-conception. Regardless of the cause of this discrepancy, this finding highlights the importance of treating wantedness and contraceptive use as two distinct and potentially only weakly related aspects of intention when interpreting the main results.
Table 4. Correlation Matrix for Intention Measures
Wanted By Mom Wanted By Dad Contraception Used
Wanted by Mom 1.0000
Wanted By Dad 0.5825
(0.0000)
1.0000
Contraception Used -0.0276 (0.2402)
-0.0360 (0.1248)
1.0000
P-values reported in parentheses
The Seemingly Unrelated Regression - OLS Model
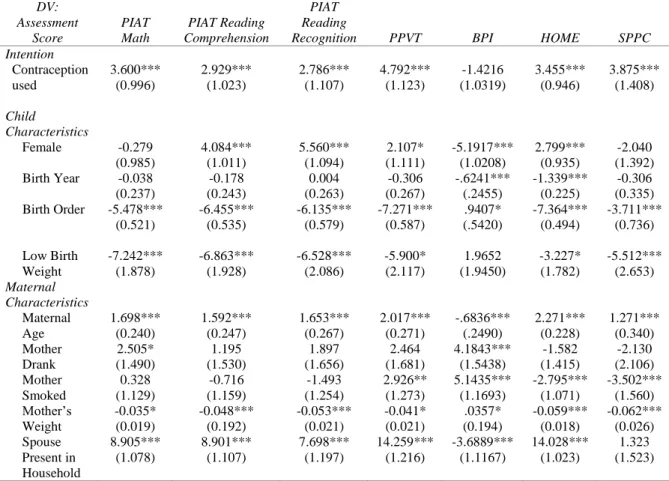
Under the SUR-OLS model, contraceptive use appears to be a statistically significant predictor of a child’s performance on six out of the seven standardized assessments. Furthermore, children whose mothers reported using some form of contraception prior to pregnancy always exhibit higher performance on standardized assessments than those whose mothers report not using any form of contraception. See Table 5 for estimated coefficients. This boost is greatest for the Peabody Picture
28
percentiles higher on the Home Observation Measurement of Environment (HOME) scale, 2.9 percentiles higher on Reading Comprehension, 2.8 percentiles higher on Reading Recognition, and 3.6 percentiles higher on Math. All of these effects are statistically significant at the 1% level. Contraceptive use also appears to decrease a child’s score on the Behavioral Problems Index (BPI) by 1.5%, though this effect is not statistically significant.
These results seem counterintuitive within the framework of the theoretical model of my study; contraceptive use should indicate an unwanted pregnancy, and therefore children whose mothers reported using contraception should score lower on standardized assessments. However, contraceptive use could also be seen as a measure of a mother’s control over her own fertility. It is possible that exercising control over one’s fertility has a positive effect on children’s performance on standardized tests later in life regardless of pregnancy intention and that this is the mechanism being reflected in the model.
Furthermore, this positive effect could be reflecting positive characteristics of the types of women who use birth control, such as higher education levels. If this is the case, then the estimated effect of birth control use should change after adding fixed effects.
29
only assessment for which maternal wantedness appears to be a statistically significant predictor of performance is the HOME. For these regression results, see Table 8 in Appendix A.
The third measure of pregnancy intention, partner wantedness, is not a statistically significant predictor of children’s performance on any of the assessments. Furthermore, the magnitude of the effect of partner wantedness is negligible for almost all of the assessments. These findings could indicate that a partner’s intention actually has very little to do with a child’s performance later in life. However, it is more likely that these results reflect inaccurate reporting of partners’ intentions and furthermore that this variable is not actually a good indicator of partner preferences. For these results, see Table 10 in Appendix A.
Regardless of the intention variable used, all three models show virtually identical significant trends in the other explanatory variables. Female children outperform their male counterparts by roughly four percentiles on reading comprehension and five percentiles on reading recognition. They also score 2.8 percentiles higher on the HOME and over five percentiles lower on the BPI, indicating lower incidence of behavioral problems. All of these effects are significant at the 1% level.
Birth order has a surprisingly large negative impact on scores for most of the assessments, indicating that eldest siblings experience the most favorable outcomes, while youngest siblings experience the least favorable outcomes. With each increase in birth order, children score five percentiles lower on the PIAT Math, roughly six
30
are significant at the 1% level. These unfavorable outcomes could reflect the fact that there are fewer free resources left with every additional child born.
Children who are born significantly underweight also appear to underperform, scoring seven percentiles lower on the math assessment, roughly six percentiles lower on the reading assessments and PPVT, and 5 points lower on the SPPC. Being born low birth weight could be an indicator of poor overall health status in early childhood, in which case it makes sense that poorer health would be reflected in poorer performance on assessments. This negative effect of low birth weight could also be capturing the negative effects of maternal habits associated with low birth weight, such as smoking during pregnancy. Mother’s weight at the time of conception is also included in the model as a proxy for her health status prior to pregnancy, and each additional pound appears to have a highly statistically significant negative effect for all assessments. However, these effects are so small that they are not particularly practically significant.
31
Table 5. Estimated Coefficients for Seemingly Unrelated Regression with OLS using “Contraception Used” as Measure of Intention
DV: Assessment Score PIAT Math PIAT Reading Comprehension PIAT Reading
Recognition PPVT BPI HOME SPPC
Intention Contraception ..used 3.600*** (0.996) 2.929*** (1.023) 2.786*** (1.107) 4.792*** (1.123) -1.4216 (1.0319) 3.455*** (0.946) 3.875*** (1.408) Child Characteristics
Female -0.279 (0.985) 4.084*** (1.011) 5.560*** (1.094) 2.107* (1.111) -5.1917*** (1.0208) 2.799*** (0.935) -2.040 (1.392) Birth Year -0.038
(0.237) -0.178 (0.243) 0.004 (0.263) -0.306 (0.267) -.6241*** (.2455) -1.339*** (0.225) -0.306 (0.335) Birth Order -5.478***
(0.521) -6.455*** (0.535) -6.135*** (0.579) -7.271*** (0.587) .9407* (.5420) -7.364*** (0.494) -3.711*** (0.736) Low Birth ….Weight -7.242*** (1.878) -6.863*** (1.928) -6.528*** (2.086) -5.900* (2.117) 1.9652 (1.9450) -3.227* (1.782) -5.512*** (2.653) Maternal Characteristics Maternal ….Age 1.698*** (0.240) 1.592*** (0.247) 1.653*** (0.267) 2.017*** (0.271) -.6836*** (.2490) 2.271*** (0.228) 1.271*** (0.340) Mother ….Drank 2.505* (1.490) 1.195 (1.530) 1.897 (1.656) 2.464 (1.681) 4.1843*** (1.5438) -1.582 (1.415) -2.130 (2.106) Mother ….Smoked 0.328 (1.129) -0.716 (1.159) -1.493 (1.254) 2.926** (1.273) 5.1435*** (1.1693) -2.795*** (1.071) -3.502*** (1.560) Mother’s ….Weight -0.035* (0.019) -0.048*** (0.192) -0.053*** (0.021) -0.041* (0.021) .0357* (0.194) -0.059*** (0.018) -0.062*** (0.026) Spouse
….Present in
….Household 8.905*** (1.078) 8.901*** (1.107) 7.698*** (1.197) 14.259*** (1.216) -3.6889*** (1.1167) 14.028*** (1.023) 1.323 (1.523)
Number of observations = 1818
Significance levels are denoted as follows: *10%, **5%, ***1% Standard errors are reported in parentheses
The Seemingly Unrelated Regression - Fixed-Effects Model
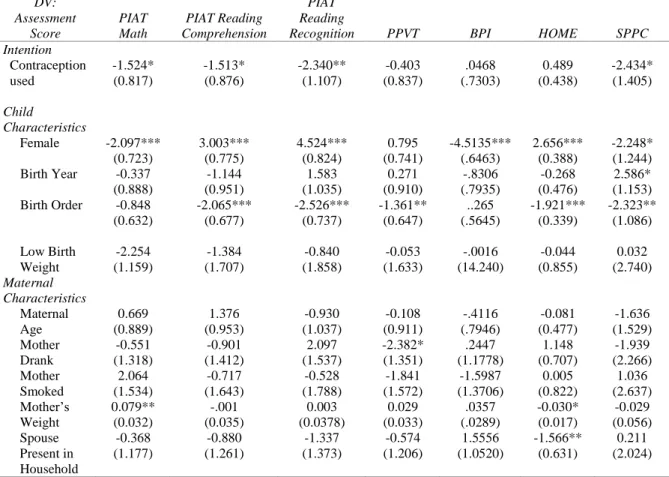
Adding fixed effects to the model creates some substantial and interesting
32
magnitudes of these effects are significantly smaller, and the effects have all switched signs. Thus, it would appear that when controlling for time-invariant confounders,
contraception use is actually detrimental to a child’s performance, although only slightly. This relationship between contraception use and child outcomes better fits my theoretical model, but the negative effect is so small that it may have little practical significance. Adding fixed effects does not add any additional support for the hypothesis that either of the wantedness measures are associated with child test scores, but these results can be found in Tables 9 and 11 in Appendix A.
The discrepancy between the OLS and FE findings highlights a potentially
interesting phenomenon. The OLS regressions indicate that birth control use is correlated with higher test scores. However, these results do not in fact reflect a causal relationship between maternal contraception use and child outcomes; rather, they capture the fact that there are substantial differences between the types of women who use birth control and the types of women who do not. Women who use contraception possess positive attributes that women who do not use contraception lack, for example being better educated and more responsible. These women then raise children who are also better educated and more responsible and therefore score higher on standardized tests.
33
The coefficients on some of the explanatory variables remain qualitatively unchanged after adding fixed effects. Females still significantly outperform their male siblings on both reading assessments, as well as on the BPI and on the HOME. In
addition, being a younger sibling is still detrimental, though the magnitude of the effect is smaller. These findings are exactly as one should expect. Only coefficients on
explanatory variables that could potentially be correlated with unobservable maternal characteristics should undergo qualitative changes after adding fixed effects. Child sex and birth order cannot be correlated with such confounders, so it makes sense that their coefficients kept the same signs and remained significant.
34
Table 6. Estimated Coefficients for Seemingly Unrelated Regression with Fixed Effects using “Contraception Used” as Measure of Intention
DV: Assessment Score PIAT Math PIAT Reading Comprehension PIAT Reading
Recognition PPVT BPI HOME SPPC
Intention Contraception ..used -1.524* (0.817) -1.513* (0.876) -2.340** (1.107) -0.403 (0.837) .0468 (.7303) 0.489 (0.438) -2.434* (1.405) Child Characteristics
Female -2.097*** (0.723) 3.003*** (0.775) 4.524*** (0.824) 0.795 (0.741) -4.5135*** (.6463) 2.656*** (0.388) -2.248* (1.244) Birth Year -0.337
(0.888) -1.144 (0.951) 1.583 (1.035) 0.271 (0.910) -.8306 (.7935) -0.268 (0.476) 2.586* (1.153) Birth Order -0.848
(0.632) -2.065*** (0.677) -2.526*** (0.737) -1.361** (0.647) ..265 (.5645) -1.921*** (0.339) -2.323** (1.086) Low Birth ….Weight -2.254 (1.159) -1.384 (1.707) -0.840 (1.858) -0.053 (1.633) -.0016 (14.240) -0.044 (0.855) 0.032 (2.740) Maternal Characteristics Maternal ….Age 0.669 (0.889) 1.376 (0.953) -0.930 (1.037) -0.108 (0.911) -.4116 (.7946) -0.081 (0.477) -1.636 (1.529) Mother ….Drank -0.551 (1.318) -0.901 (1.412) 2.097 (1.537) -2.382* (1.351) .2447 (1.1778) 1.148 (0.707) -1.939 (2.266) Mother ….Smoked 2.064 (1.534) -0.717 (1.643) -0.528 (1.788) -1.841 (1.572) -1.5987 (1.3706) 0.005 (0.822) 1.036 (2.637) Mother’s ….Weight 0.079** (0.032) -.001 (0.035) 0.003 (0.0378) 0.029 (0.033) .0357 (.0289) -0.030* (0.017) -0.029 (0.056) Spouse
….Present in
….Household -0.368 (1.177) -0.880 (1.261) -1.337 (1.373) -0.574 (1.206) 1.5556 (1.0520) -1.566** (0.631) 0.211 (2.024)
Number of observations = 1818
Significance levels are denoted as follows: *10%, **5%, ***1% Standard errors are reported in parentheses
VI. Conclusions
35
apparent relationships between intention and child test scores could actually be attributed to intention, or rather if they were just due to unobservable maternal characteristics correlated with intention. My hypothesis was that unintended children would perform more poorly on standardized assessments than their wanted counterparts.
When estimated without fixed effects, the correlation between maternal use of contraception at the time of conception and child’s test scores is significant and positive. Maternal age and the presence of a spouse in the household during pregnancy also emerge as significant positive boosts to test scores. However, after adding fixed effects, contraception use appears to actually be mildly detrimental to children’s test scores, and both maternal age and spouse presence have no significant effect. These results suggest that the effects formerly attributed to these factors are in fact due to unobservable maternal characteristics.
36 Appendix A
Table 7. Descriptive Statistics for Demeaned Variables
Variable Mean Standard
Deviation
Minimum Maximum
Peabody Individual Achievement Test (PIAT)
Math 4.56e-08 11.78834 -56.5 45.93333
Reading Comprehension -9.77e-09 12.67155 -47.625 48.16666
Reading Recognition 4.46e-09 13.8327 -54.95 57.53333
Other Child Assessments Peabody Picture
…..Vocabulary Test (PPVT)
1.94e-08 12.026 -45.833 54.833
Self-Perception Profile for
…..Children (SPPC)
0 20.20294 -83.33333 65
Behavioral Problems
…..Index (BPI)
4.07e-07 112.0147 -45.76166 39.32583
Home Observation
…..Measurement of the
…..Environment (HOME)
-1.56e-08 7.046932 -31.75 37.06548
Child Characteristics
Female -3.84e-09 - -.8333333 0.75
Birth Year 4.03e-07 3.239442 1979 1998
Birth Order 3.93e-10 0.9340331 -4.8 4.2
Low Birth Weight -1.03e-09 - -0.6666667 0.8
Maternal Characteristics
Maternal Age 0 3.239442 -10.4 11
Mother Drank -9.43e-10 - -0.75 0.8333333
Mother Smoked -9.34e-10 - -0.75 0.8
Mother’s Weight 4.62e-08 10.31879 -45 53.75
Mother’s Spouse Present
…..in Household
-1.70e-09 - -0.8 0.8333333
Intention Variables
Wanted by Mom -3.13e-09 - -0.8 0.8
Wanted by Dad -3.08e-09 - -0.8 0.8
37
Table 8. Estimated Coefficients for Seemingly Unrelated Regression with OLS using “Wanted by Mom” as Measure of Intention
DV: Assessment Score PIAT Math PIAT Reading Comprehension PIAT Reading
Recognition PPVT BPI HOME SPPC
Intention Wanted By ….Mom .809 (1.641) 2.053 (1.682) 2.738 (1.819) 3.010 (1.852) -1.20636 (16.949) 2.983* (1.556) .243 (2.316) Child Characteristics
Female -.268 (.988) 4.112*** (1.103) 5.598*** (1.095) 2.148* (1.116) -5.2081*** (1.0209) 2.839*** (.937) -2.038 (1.395) Birth Year -.103
(.237) -.230 (.243) -.0449 (.263) -.391 (.268) -.5992** (.2449) -1.399*** (.224) -.377 (.335) Birth Order -5.400***
(.522) -6.373*** (.536) -6.045*** (.579) -7.141*** (.590) .8979* (.5399) -7.259*** (.495) -3.638*** (.738) Low Birth ….Weight -7.074*** (1.884) -6.681*** (1.932) -6.328*** (2.088) -5.613*** (2.127) 1.8697 (1.9461) -2.993* (1.787) -5.351** (2.660) Maternal Characteristics Maternal ….Age 1.752*** (.240) 1.633*** (.246) 1.691*** (.267) 2.085*** (.271) -.7033*** (.2486) 2.319*** (.228) 1.331*** (.340) Mother ….Drank 2.671* (1.496) 1.377 (1.533) 2.096 (1.657) 2.751 (1.688) 4.0889*** (1.5449) -1.348 (1.418) -1.971 (2.111) Mother ….Smoked .292 (1.13) -.742 (1.161) -1.515 (1.255) 2.883** (1.278) 5.1557*** (1.1697) -2.824*** (1.074) -3.542** (1.598) Mother’s ….Weight -.031* (.0187) -.044** (.0192) -.050** (.021) -.036* (.021) .0352* (.0194) -.055*** (.018) -.0576** (.026) Spouse
….Present in
….Household 9.198*** (1.102) 8.937*** (1.129) 7.617*** (1.221) 14.368*** (1.243) -3.6755*** (1.1381) 13.988*** (1.045) 1.736 (1.555)
Number of observations = 1818
38
Table 9. Estimated Coefficients for Seemingly Unrelated Regression with Fixed Effects using “Wanted by Mom” as Measure of Intention
DV: Assessment Score PIAT Math PIAT Reading Comprehension PIAT Reading
Recognition PPVT BPI HOME SPPC
Intention Wanted By ….Mom 1.465 (1.292) 1.865 (1.384) 1.228 (1.508) 1.870 (1.323) -.4215 (11.541) -.003 (.692) 3.119 (2.221) Child Characteristics
Female -2.043*** (.723) 3.062*** (.774) 4.595*** (.844) .827 (.741) -4.5198*** (.6462) 2.645*** (.387) -2.152* (1.243) Birth Year -.301
(.888) -1.124 (.951) 1.678 (1.036) .223 (.909) -.8172 (.7934) -.296 (.476) 2.613* (1.527) Birth Order -.828
(.632) -2.035*** (.677) -2.523*** (.784) -1.316** (.648) .7158 (.5652) -1.914*** (.339) -2.271** (1.088) Low Birth ….Weight -2.262 (1.595) -1.410 (1.709) -.809 (1.86) -.118 (1.633) .0145 (1.4245) -.061 (.855) -.0147 (2.742) Maternal Characteristics Maternal ….Age .609 (.888) 1.330 (.952) -1.055 (1.037) -.077 (.910) -.4216 (.7938) -.047 (.476) -1.705 (1.528) Mother ….Drank -.531 (1.318) -.883 (1.412) 2.128 (1.539) -2.380* (1.350) .2450 (1.1777) 1.141 (.706) -1.910 (2.267) Mother ….Smoked 2.184 (1.534) -.588 (1.643) -.365 (1.791) -1.773 (1.570) -1.6113 (1.3701) -.022 (.822) 1.246 (2.638) Mother’s ….Weight .079*** (.032) .001 (.035) .002 (.038) .029 (.033) -.0318 (.0289) -.030* (.0173) -.028 (.057) Spouse
….Present in
….Household -.704 (1.172) -1.237 (1.256) -1.799 (1.508) -.747 (1.200) 1.5874 (1.1541) -1.484** (.628) -.370 (2.015)
Number of observations = 1818
39
Table 10. Estimated Coefficients for Seemingly Unrelated Regression with OLS using “Wanted by Dad” as Measure of Intention
DV: Assessment Score PIAT Math PIAT Reading Comprehension PIAT Reading
Recognition PPVT BPI HOME SPPC
Intention Wanted By ….Dad .149 (1.626) -.133 (1.667) .058 (1.803) .240 (1.836) -1.188 (1.679) 1.952 (1.542) -2.446 (2.293) Child Characteristics
Female -.279 (.988) 4.081*** (1.013) 5.559*** (1.096) 2.106* (1.116) -5.200*** (1.020) 2.812*** (.937) -2.061 (1.394) Birth Year -.103
(.237) -.231 (.243) -.047 (.262) -.393 (.267) -.596** (.244) -1.404*** (.225) -.374 (.334)
Birth Order -5.411*** (.522) -6.402*** (.535) -6.083*** (.579) -7.182*** (.590) .9088* (.539) -7.291*** (.495) -3.653*** (.737) Low Birth ….Weight -7.090*** (1.887) -6.758*** (1.934) -6.415*** (2.092) -5.697*** (2.131) 1.829 (1.948) -2.960* (1.790) -5.524** (2.662) Maternal Characteristics Maternal ….Age 1.753*** (.240) 1.637*** (.246) 1.696*** (.266) 2.091*** (.271) -.704*** (.248) 2.323*** (.228) 1.333*** (.339) Mother ….Drank 2.651* (1.496) 1.303 (1.534) 2.007 (1.659) 2.660 (1.690) 4.080*** (1.545) -1.367 (1.420) -2.079 (2.111) Mother ….Smoked .289 (1.132) -.746 (1.161) -1.522 (1.256) 2.875** (1.279) 5.163*** (1.169) -2.839*** (1.074) -3.532** (1.598) Mother’s ….Weight -.031* (.018) -.044*** (.0192) -.050*** (.020) -.035* (.021) .034* (.019) -.0548*** (.0178) -.058** (.026) Spouse
….Present in
….Household 9.295*** (1.099) 9.254*** (1.126) 8.009*** (1.218) 14.774*** (1.241) -3.687*** (1.134) 14.154*** (1.043) 2.109 (1.550)
Number of observations = 1818
40
Table 11. Estimated Coefficients for Seemingly Unrelated Regression with Fixed Effects using “Wanted by Dad” as Measure of Intention
DV: Assessment Score PIAT Math PIAT Reading Comprehension PIAT Reading
Recognition PPVT BPI HOME SPPC
Intention Wanted By ….Dad .193 (1.293) -.501 (1.384) -2.196 (1.507) .969 (1.323) .9985 (1.1539) -1.029 (.692) -1.986 (2.222) Child Characteristics
Female -2.060*** (.723) 3.036*** (.775) 4.567*** (.843) .810 (.740) -4.5089*** (.6459) 2.639*** (.387) -2.201* (1.243) Birth Year -.250
(.888) -1.040 (.951) 1.779* (1.035) .271 (.908) -.8580 (.7925) -.271 (.476) 2.781* (1.526) Birth Order -.858
(.635) -2.109*** (.680) --2.663*** (.741) -1.318** (.650) .7758 (.5671) -1.964*** (.340) -2.451** (1.092) Low Birth ….Weight -2.195 (1.595) -1.345 (1.708) -.817 (1.86) -.012 (1.632) .0239 (1.4238) -.089 (.854) .063 (2.742) Maternal Characteristics Maternal ….Age .564 (.888) 1.266 (.951) -1.114 (1.036) -.127 (.909) -.3992 (.7929) -.056 (.475) -1.822 (1.527) Mother ….Drank -.519 (1.320) -.902 (1.414) 2.025 (1.540) -2.329* (1.351) .2921 (1.1788) 1.091 (.707) -1.998 (2.270) Mother ….Smoked 2.144 (1.534) -.616 (1.644) -.326 (1.790) -1.847 (1.571) 1.6320 (1.3701) .009 (.822) 1.233 (2.638) Mother’s ….Weight .078** (.032) .0003 (.034) .001 (.037) .028 (.033) -.0314 (.0289) -.030* (.017) -.029 (.055) Spouse
….Present in
….Household -.642 (1.179) -1.074 (1.263) -1.483 (1.375) -.750 (1.207) 1.4512 (1.0528) -1.369** (.632) .030 (2.0270
Number of observations = 1818
Significance levels are denoted as follows: *10%, **5%, ***1% Standard errors are reported in parentheses
Appendix B
Manual SUR Model with Fixed Effects Stata Do-File:
sort momid
by momid: egen homeScoreBar = mean(homeScore) by momid: egen mathBar = mean(math)
by momid: egen readCompBar = mean(readComp) by momid: egen readRecBar = mean(readRec) by momid: egen SPPCBar = mean(SPPC) by momid: egen bpiBar = mean(bpi) by momid: egen ppvtBar = mean(ppvt)
by momid: egen femaleBar = mean(female)
41
by momid: egen lowBirthWeightBar = mean(lowBirthWeight) by momid: egen spouseInHHBar = mean(spouseInHH)
by momid: egen wantedByMomBar = mean(wantedByMom) by momid: egen wantedByDadBar = mean(wantedByDad) by momid: egen bcUsedBar = mean(bcUsed)
gen feHome = homeScore - homeScoreBar gen feMath = math - mathBar
gen feReadComp = readComp - readCompBar gen feReadRec = readRec - readRecBar gen feSPPC = SPPC - SPPCBar
gen feBPI = bpi - bpiBar gen fePPVT = ppvt - ppvtBar
gen feFemale = female - femaleBar
gen feBirthOrder = birthOrder - birthOrderBar gen feBirthYear = birthYearR - birthYearRBar gen feMaternalAge = maternalAge - maternalAgeBar gen feMomDrank = momDrank - momDrankBar
gen feMomSmoked = momSmoked - momSmokedBar gen feMomWeight = momWeight - momWeightBar
gen feLowBirthWeight = lowBirthWeight - lowBirthWeightBar gen feSpouseInHH = spouseInHH - spouseInHHBar
gen feWantedByMom = wantedByMom - wantedByMomBar gen feWantedByDad = wantedByDad - wantedByDadBar gen feBcUsed = bcUsed - bcUsedBar
local feControls feFemale feBirthOrder feBirthYear feMaternalAge feMomDrank feMomSmoked feMomWeight feLowBirthWeight feSpouseInHH
reg3 (feHome = `feControls' feWantedByMom)(feMath = `feControls' feWantedByMom)(feReadComp = `feControls' feWantedByMom)(feReadRec = `feControls' feWantedByMom)(feSPPC = `feControls' feWantedByMom)(feBPI = `feControls' feWantedByMom)(fePPVT = `feControls' feWantedByMom)
test feWantedByMom
reg3 (feHome = `feControls' feWantedByDad)(feMath = `feControls' feWantedByDad)(feReadComp = `feControls' feWantedByDad)(feReadRec = `feControls' feWantedByDad)(feSPPC = `feControls' feWantedByDad)(feBPI = `feControls' feWantedByDad)(fePPVT = `feControls' feWantedByDad)
test feWantedByDad
reg3 (feHome = `feControls' feBcUsed)(feMath = `feControls'
feBcUsed)(feReadComp = `feControls' feBcUsed)(feReadRec = `feControls'
feBcUsed)(feSPPC = `feControls' feBcUsed)(feBPI = `feControls' feBcUsed)(fePPVT = `feControls' feBcUsed)
test feBcUsed
Excerpt from Data Restructuring/Matching Stata Do-File:
gen totKids = 0 gen relKids = 0 gen pregNum = 0
42
gen noBcWantPreg3_85 = . gen stopBcPreg7_2002 = . gen stopBcPreg9_2002 = . gen stopBcPreg5_2004 = . gen stopBcPreg6_2004 = . gen stopBcPreg10_2004 = . gen stopBcPreg1_2006 = . gen stopBcPreg4_2006 = . gen stopBcPreg5_2006 = . gen stopBcPreg4_2008 = . gen stopBcPreg5_2008 = . gen stopBcPreg6_2008 = . gen noBcWantPreg9_2008 = . gen stopBcPreg5_2010 = .
forvalues i = 1/12 {
gen useBC`i' = . gen want`i' = . gen ptnrWant`i' = . gen stopBCBefore`i' = . gen noBCWant`i' = .
local i = `i' + 1 }
***REPEAT FOR EACH SURVEY YEAR***
foreach year of numlist 82 { //for each year
replace relKids = 0 local N = _N
forvalues pregnancy = 1/7 {
replace relKids = relKids + 1 if useBcPreg`pregnancy'_`year' >= 0 | wantPreg`pregnancy'_`year' >= 0 | ptnrWantPreg`pregnancy'_`year' >= 0
replace pregNum = totKids + relKids if useBcPreg`pregnancy'_`year' >= 0 | wantPreg`pregnancy'_`year' >= 0 | ptnrWantPreg`pregnancy'_`year' >= 0
forvalues i = 1/`N' { //loop through individual observations local preg = pregNum[`i']
if `preg' > 0 {
replace useBC`preg' = useBcPreg`pregnancy'_`year' in `i' if useBcPreg`pregnancy'_`year' >= 0
replace want`preg' = wantPreg`pregnancy'_`year' in `i' if wantPreg`pregnancy'_`year' >= 0
replace ptnrWant`preg' = ptnrWantPreg`pregnancy'_`year' in `i' if ptnrWantPreg`pregnancy'_`year' >= 0
replace stopBCBefore`preg' = stopBcPreg`pregnancy'_`year' in `i' if stopBcPreg`pregnancy'_`year' >= 0
replace noBCWant`preg' = noBcWantPreg`pregnancy'_`year' in `i' if noBcWantPreg`pregnancy'_`year' >= 0
} }
43
replace totKids = pregNum }
******
sort momid
drop _merge
merge momid using "C:\Users\skl407\Dropbox\ECON 692H\kidData\finalKidData.dta"
drop if _merge == 1 sort momid rid
gen wantedByMom = . gen wantedByDad = . gen bcUsed = . gen wantedNoBc = . gen wantedStoppedBc = .
forvalues preg = 1/12 {
replace wantedByMom = want`preg' if rid == momid*100 + `preg' replace wantedByDad = ptnrWant`preg' if rid == momid*100 + `preg' replace bcUsed = useBC`preg' if rid == momid*100 + `preg'
replace wantedNoBc = noBCWant`preg' if rid == momid*100 + `preg'
replace wantedStoppedBc = stopBCBefore`preg' if rid == momid*100 + `preg'
}
44
Bibliography
Bachrach, C., & Newcomer, S. (1999). Intended pregnancies and unintended pregnancies: Distinct categories or opposite ends of a continuum? Family Planning Perspectives, 31, 251-252.
Barber, J.S., Axinn, W.G., & Thornton, A. (1999). Unwanted childbearing, health, and
.mother-child relationships. Journal of Health and Social Behaviors, 40, 231-257.
Baydar, N. (1995). Consequences for Children of their Birth Planning Status. Family Planning Perspectives, 27, 225 and 228-234.
Becker, G.S. and Lewis, H.G. (1973). On the Interaction Between the Quantity and Quality of Children. Journal of Political Economy, 81, S279-89.
Bustan, M.N. and Coker, A.L. (1994). Maternal Attitude Toward Pregnancy and the Risk of Neonatal Death. American Journal of Public Health, 84, 411-14.
Cameron, P., and Titchenor, J.C. (1976). The Swedish Children Born to Women Denied
……….Abortion Study: A Radical Criticism. Psychological Reports, 39, 391-94.
Crissey, S. R. (2005). Effect of Pregnancy Intention on Child Well-Being and
Development: Combining Retrospective Reports of Attitude and Contraceptive use. Population Research and Policy Review, 24(6), 593–615.
David, H.P., Dythrych, Z., & Matejcek, Z. (2003). Born unwanted: Observations from the Prague Study. American Psychologist, 58(3), 224-229.
Finer, L.B., & Zolna, M.R.. (2011). Unintended pregnancy in the United States: incidence and disparities, 2006. Contraception, 84(5), 478-485.
Fischer, R.C., Stanford, J.B., Jameson, P., Dewitt, M.J. Exploring the concepts of intended, planned, and wanted pregnancy. J Fam Pract 1999, 48:117-22.
Forssman, H., and Thuwe, I. (1998) The Goteberg Chort, 1939-77. Pp. 37-45 in Born Unwanted: Developmental Effects of Denied Abortion, edited by H.P. David, Z. Dytrich, Z. Matejcek, and V. Schuller. New York: Springer.
Frenzen, P. D., & Hogan, D. P. (1982). The impact of class, education, and health care on infant mortality in a developing society: The case of rural
Thailand. Demography, 19(3), 391–408.
45
Joyce, T., Kaestner, R., & Korenman, S. (2002). On the validity of retrospective assessments of pregnancy intention. Demography,39(1), 199-213.
Laukaran, V.H. & van den Berg, B.J. (1980). The relationship of maternal attitude to pregnancy outcomes and obsetretic complications. A cohort study of unwanted pregnancy. American Journal of Obstetrics and Gynecology. 136(3), 373-379.
Mosher, W.D., Jones, J., Abma, J.C. (2012). Intended and Unintended Births in the United States: 1982-2010. National Health Statistics Reports. 55.
Najman, J.M., Morrison, J., Williams, G., Anderson, M, & Keeping, J.D. (1991). The mental health of women 6 months after they give birth to an unwanted baby: a longitudinal study. Social Science & Medicine. 32(3), 241-247.
Rosenzweig, M.R., and Wolpin, K.I. (1993). Maternal Expectations and Ex Post Rationalizations: The Usefuleness of Survey Information on the Wantedness of Chidren. The Journal of Human Resources, 26(2), 205-229.
Stanford, J and Dewitt, J, Defining the dimensions of pregnancy intendedness, paper presented at the Research Conference on the 1995 national Survey of Family Growth, Hyattsville, MD, Oct. 13-14,1998.