!"
Study Contributors: Maria Petzel RD, Sarah Lowe, Matthew Katz MD, Jason Fleming MD, Justin Folloder PA-C, Carol Clegg RN, NP-C, Vanessa Martinez, Xuemei Wang MS, Hsiang-Chun Chen PhD.
Clinical Advisor: Maria Petzel, RD
Paper Advisor: Dr. Liza Makowski, Ph.D.
Abstract:
Importance: Nutrition status and quality of life (QOL) have been previously correlated in patients with various types of cancers, yet the relationship in pre-treatment pancreatic and periampullary cancer patients remains unknown.
Objectives: To determine whether there is an association between pre-treatment nutrition status and QOL, and if either variable is correlated with disease stage.
Design, Setting, and Participants: This cross-sectional observational analysis included 110 treatment-naïve patients who presented to The University of Texas MD Anderson Cancer Center (MDACC) for initial surgical evaluation and/or treatment for localized pancreatic cancer or periampullary neoplasm between September 2009 and March 2013. These subjects were part of a larger longitudinal study (“Correlative Study of Nutrition and Quality of Life in Patients with Pancreatic Cancer”), and were selected based on disease staging availability and diagnosis of adenocarcinoma or neuroendocrine tumor of the pancreas or periampullary region.
Main Outcome Measures: Nutrition status was measured using the Patient-Generated
Subjective Global Assessment (PG-SGA) questionnaire. QOL was assessed using the Functional Assessment of Cancer Therapy-Hepatobiliary (FACT-Hep) questionnaire. Disease stage was quantified using the American Joint Commission on Cancer (AJCC) and International Union for Cancer Control (IUCC) “TNM” staging guidelines.
Results: PG-SGA scores were significantly negatively associated with total FACT-Hep score (P< 0.001), Physical Well-being (PWB) subscore (P< 0.001), Functional Well-being (FWB) subscore (P< 0.001), and Hepatobiliary (Hep) subscore (P< 0.001). AJCC disease stage was significantly positively associated with PG-SGA score (P=0.004) and significantly negatively associated with total FACT-Hep score (P=0.05), PWB subscore (P=0.02), and Hep subscore (P=0.02). Thus, those subjects with more advanced disease stage tended to have a poorer nutrition status and poorer QOL. Hyperlipidemia/hypercholesterolemia (OR=14.67, P= 0.001), histologic diagnosis (neuroendocrine tumor vs. adenocarcinoma) (OR= 0.19, P= 0.02), and PG-SGA score (OR= 1.13, P= 0.004) were found to be significant predictors of AJCC disease stage.
Conclusion and Relevance: Pre-treatment nutrition status is significantly correlated with QOL, and both nutrition status and QOL are significantly associated with AJCC disease stage in patients with pancreatic or periampullary cancer. These factors should be taken into
#" Introduction
Pancreatic cancer is one of the most lethal solid tumors, with a documented five-year survival rate of 6.7%1. This low survival rate can partially be attributed to a lack of effective screening tools; patients are only diagnosed once symptomatic, which often corresponds to advanced pancreatic cancer disease stage2. This holds true for patients with cancer of proximal organs as well; 80% of patients with hepatobiliary cancer (cancers with a primary site of the pancreas, liver, bile duct, and gallbladder) are not candidates for surgical resection3, which contributes to
their poor overall prognosis2. Hepatobiliary cancer patients have also been shown to have an exceptionally high symptom burden2,4 and high risk for malnutrition5. Malnutrition is a relevant consideration because it has been shown to increase risk of infection, treatment toxicity and healthcare costs, and decrease treatment response, quality of life (QOL) and life expectancy among cancer patients6.
It is widely accepted that quality of survival is as important as length of survival7; therefore for
patients who are ineligible for surgical resection, consideration of remaining treatment options including chemotherapy, radiation, and chemoradiation are increasingly informed by patient QOL. It has previously been shown in cancer patients that QOL is influenced by both nutrition status and disease stage8. A meta-analysis demonstrated a positive correlation between better nutrition status and higher QOL scores in patients with gastrointestinal (GI) cancers9. However, there are no published studies that focus specifically on the relationship between nutrition status and QOL in pancreatic or periampullary cancer patients.
There are multiple screening tools available to measure QOL and nutrition status; two screening tools were selected for this study based on their previous validation in oncology-specific
populations. The Functional Assessment of Cancer Therapy-Hepatobiliary questionnaire (FACT-Hep), is a self-administered assessment tool that is specific to hepatobiliary cancer. The first portion, the Functional Assessment of Cancer Therapy-General (FACT-G), consists of 27
questions that address generic oncology QOL parameters such as physical, emotional, social, and functional well-being. The second portion, the Hepatobiliary Cancer (Hep) Subscale, contains 18 questions that probe additional concerns specific to the disease location, including jaundice, self-reported weight changes, and GI symptoms, among others. The FACT-Hep has been proven to be a valid, reliable, and specific tool to evaluate QOL in patients with hepatobiliary cancers, including pancreatic cancer3,7,10,11. The second screening tool selected for this study, the Patient-Generated Subjective Global Assessment (PG-SGA), is a validated oncology-specific, self-administered nutrition assessment tool that has a high specificity and sensitivity to quantify nutrition status in cancer populations6,12.
$"
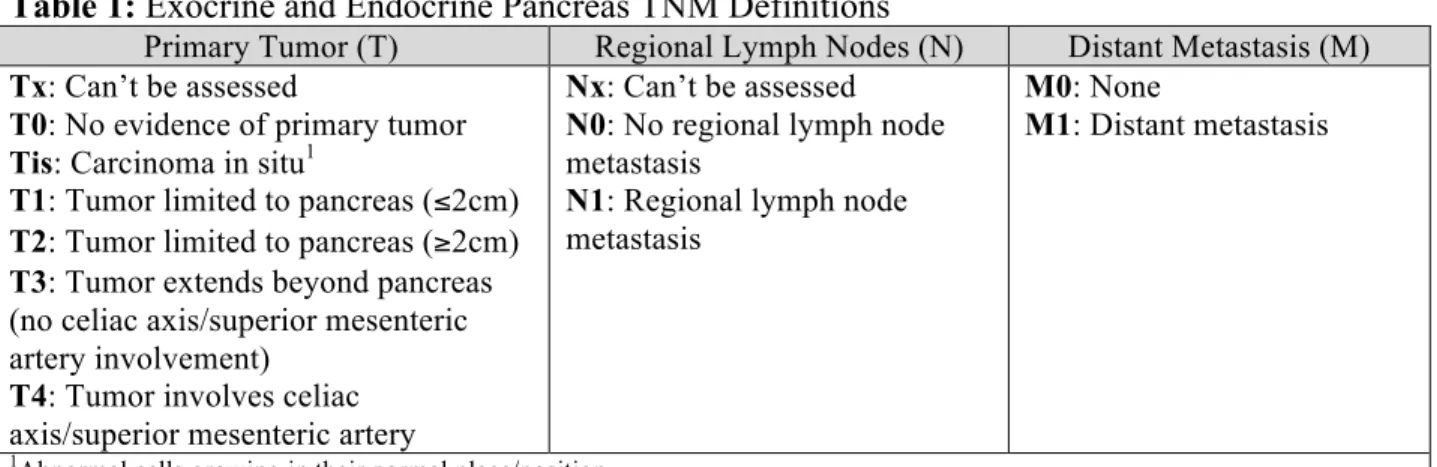
There are TNM algorithms for nearly all anatomic sites including pancreatic cancer, as shown in Table 2.
Table 1: Exocrine and Endocrine Pancreas TNM Definitions
Primary Tumor (T) Regional Lymph Nodes (N) Distant Metastasis (M) Tx: Can’t be assessed
T0: No evidence of primary tumor Tis: Carcinoma in situ1
T1: Tumor limited to pancreas (!2cm) T2: Tumor limited to pancreas ("2cm) T3: Tumor extends beyond pancreas (no celiac axis/superior mesenteric artery involvement)
T4: Tumor involves celiac axis/superior mesenteric artery
Nx: Can’t be assessed N0: No regional lymph node metastasis
N1: Regional lymph node metastasis
M0: None
M1: Distant metastasis
1Abnormal cells growing in their normal place/position.
Table 2: Pancreatic Cancer Staging Algorithm Anatomic Stage Primary Tumor
(T)
Regional Lymph Nodes
(N)
Distant Metastasis
(M)
0 Tis N0 M0
IA T1 N0 M0
IB T2 N0 M0
IIA T3 N0 M0
T1 N1 M0
T2 N1 M0
IIB
T3 N1 M0
III T4 Any N M0
IV Any T Any N M0
%" Methods
Patients
The study included 230 patients who presented to The University of Texas MD Anderson Cancer Center (MDACC) for initial surgical evaluation and/or treatment for suspected or proven
localized pancreatic cancer or periampullary neoplasm between September 2009 and March 2013. Exclusion criteria included non-English speakers, those under 18 years of age, and subjects who had undergone previous anti-neoplastic treatment. Subjects who were deemed ineligible for surgery at any time after their initial clinic visit were taken off study, although their data until that point were still included. One subject withdrew consent, 1 subject was un-evaluable due to mental health concerns, 6 subjects were excluded due to prior treatment, 9 subjects did not have prospective data collection completed as anticipated, and 58 subjects did not return their
completed survey forms (75% response rate). Of the remaining subjects, 110 subjects had a histologic diagnosis of either adenocarcinoma or neuroendocrine tumor within the pancreas or periampullary region, and had AJCC staging information available for this analysis. The study received ethical approval from the MDACC IRB (IRB Protocol #2009-0412).
Data Collection
This analysis used data collected at Gastrointestinal Clinic (GI Clinic) visits as part of a larger longitudinal study (“Correlative Study of Nutrition and Quality of Life in Patients with
Pancreatic Cancer”, IRB Protocol #2009-0412). However, this cross-sectional analysis only includes data obtained upon initial presentation at Visit #1, with the exception of AJCC staging, which was sourced from surgery and/or imaging in subsequent months.
PG-SGA and FACT-Hep questionnaires were distributed to subjects at Visit #1. Subjects completed the forms independently and anonymously returned them during a follow-up
appointment or via a MDACC drop-off location. PG-SGA and FACT-Hep questionnaires were scored and totaled by study staff. Anthropometric data, including height and weight, was collected by clinic staff at Visit #1. Additional information including demographics,
comorbidities, clinical data, pathologic AJCC staging, and treatment-related data was sourced from MDACC’s ongoing IRB-approved Multidisciplinary Pancreatic Tumors Database (MPTD) (IRB# RCR01-112). Comorbidities in the MPTD were sourced from clinical diagnoses listed in the “Past Medical History” section of the subjects’ electronic medical records. Subjects who underwent surgery after Visit #1 had a biopsy-confirmed pathologic AJCC stage present in the MPTD, whereas nonsurgical subjects’ clinical AJCC stage was sourced from electronic medical records within an average of 5 months of original presentation.
Outcome Measures
Nutrition status was determined according to PG-SGA scores. Numerical scores are inversely proportional to nutrition status; a higher score corresponds to a poorer nutrition status. Total PG-SGA scores were stratified into categories including “well-nourished” (0-1 points),
&"
Cutoffs were determined per PG-SGA Nutritional Triage Recommendations. The maximum possible PG-SGA score is 52 points. PG-SGA scores were available for all 110 subjects.
QOL status was measured using total FACT-Hep scores and FACT-G and Hep subscale scores. Both total and subscale scores are directly proportional to QOL; higher FACT-Hep, FACT-G, and subscale scores all correlate with a greater QOL. FACT-G subscales include Physical Well-being (PWB), Social/family Well-Well-being (SWB), Emotional Well-Well-being (EWB), and Functional Well-being (FWB), with possible score ranges of 0-28, 0-28, 0-24, and 0-28 points, respectively. The Hep subscale has a score range of 0-72 points. Total FACT-Hep scores were derived by combining FACT-G and Hep scores, for a maximum score of 180 points. Questionnaire scoring was completed according to FACT-Hep Interpretation Manual guidelines16. FACT-Hep scores were available for 104 of the 110 subjects (95%) due to missing survey responses.
AJCC tumor stage was assessed according to either pathologic or clinical stage. For the analysis, TNM stages were categorized into 2 groups: AJCC stages 0-II (includes stage 0, IA, IB, IIA, and IIB) and AJCC stage III-IV (includes stage III and IV).
Analysis
Statistical analyses were performed using SAS Version 9.3, 2003 (SAS Institute Inc., Cary, NC, USA). Subject characteristics were summarized using descriptive statistics. The associations between AJCC stage and nutrition scores or QOL scores were assessed using Wilcoxon rank-sum tests. Pearson correlations were used to evaluate the relationship between nutrition and QOL scores. Kruskal-Wallis tests were used to assess the association between categorical nutrition status and QOL scores. Fisher’s exact tests were applied to assess the association between AJCC stage and potential categorical confounders. Linear regression analysis was performed to assess the relationship between nutrition, QOL, and comorbidities, enzyme supplementation, jaundice, or histologic diagnosis groups. Logistic regression was used to explore the association between AJCC stage and comorbidities, enzyme supplementation, jaundice, or histologic diagnosis groups, nutrition scores, and QOL scores. Variables with univariate P-value <0.10 were included in a multivariate model. Backward elimination was applied until all remaining variables had a P-value <0.05. Statistical significance was reported at the conventional P <0.05 level (two-tailed).
Results
Subject Characteristics
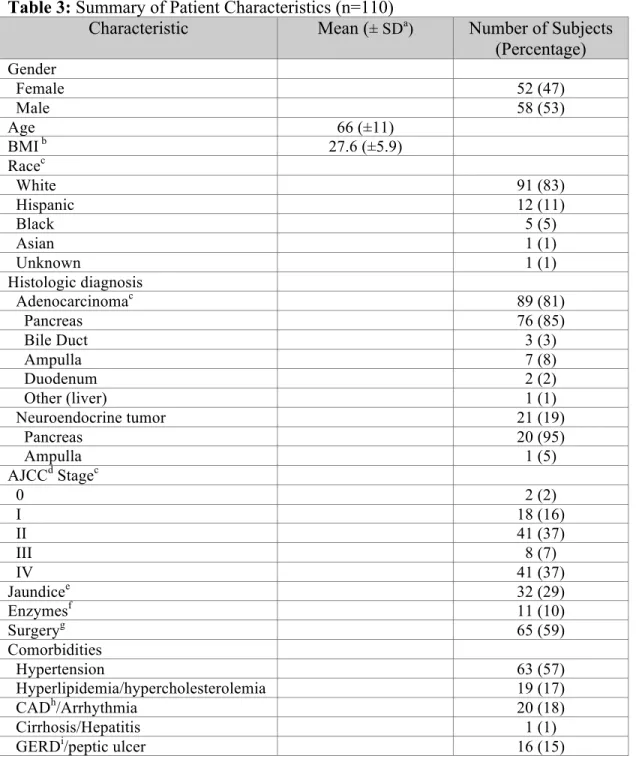
Of the 110 included subjects, 47% (52) were female and 53% (58) were male. The racial
'"
and the remaining 41% (45) of subjects did not undergo surgical intervention. At time of Visit #1, 29% (32) of subjects were diagnosed with jaundice and 10% (11) subjects were receiving pancreatic enzyme supplementation therapy. The majority of patients had either AJCC stage II (37%) or stage IV (37%) disease, while 16% (18) had stage I, and 7% (8) had stage III disease. The most common comorbidities were hypertension (57%), CAD/Arrhythmia (18%), and hyperlipidemia/hypercholesterolemia (17%). The mean PG-SGA score was 8.5± 5.6 points, and the mean total FACT-Hep score was 134± 25.4 points. Subject characteristics are presented in Table 3.
Table 3: Summary of Patient Characteristics (n=110)
Characteristic Mean (± SDa) Number of Subjects
(Percentage) Gender
Female 52 (47)
Male 58 (53)
Age 66 (±11)
BMI b 27.6 (±5.9)
Racec
White 91 (83)
Hispanic 12 (11)
Black 5 (5)
Asian 1 (1)
Unknown 1 (1)
Histologic diagnosis
Adenocarcinomac 89 (81)
Pancreas 76 (85)
Bile Duct 3 (3)
Ampulla 7 (8)
Duodenum 2 (2)
Other (liver) 1 (1)
Neuroendocrine tumor 21 (19)
Pancreas 20 (95)
Ampulla 1 (5)
AJCCd Stagec
0 2 (2)
I 18 (16)
II 41 (37)
III 8 (7)
IV 41 (37)
Jaundicee 32 (29)
Enzymesf 11 (10)
Surgeryg 65 (59)
Comorbidities
Hypertension 63 (57)
Hyperlipidemia/hypercholesterolemia 19 (17)
CADh/Arrhythmia 20 (18)
Cirrhosis/Hepatitis 1 (1)
("
Chronic/acute pancreatitis 6 (5)
MIj 5 (5)
COPDk 3 (3)
CHFl 1 (1)
PG-SGAm score 8.5 (±5.6)
FACT-Hepn (n=104)o
Total FACT-Hep score 134 (±25.4)
FACT-Gp subscore 80.1 (
±15.9)
PWBq subscore 21.7 (
±5.7)
SWBr subscore 23.7 (±4.7)
EWBs subscore 16.8 (
±4.8)
FWBt subscore 17.8 (
±5.9)
Hepu subscore 54.4 (± 11.4)
aStandard deviation bBody Mass Index cPercentages don’t add to 100% due to rounding dAmerican Joint Commission on Cancer ePresence of jaundice at time of presentation fPancreatic enzyme supplementation at time of presentation gSurgical intervention at any time after initial presentation hCoronary Artery Disease
iGastroesophageal Reflux Disease jMyocardial Infarction kChronic Pulmonary Obstructive Disease lChronic Heart Failure mPatient-Generated Subjective Global Assessment questionnaire nFunctional Assessment of Cancer Therapy-Hepatobiliary questionnaire o6 subjects had missing FACT-Hep scores due to incomplete surveys pFunctional Assessment of Cancer Therapy-General sub-questionnaire qPhysical Well-being sub-questionnaire rSocial Well-being sub-questionnaire sEmotional Well-being sub-questionnaire tFunctional Well-being sub-questionnaire uHepatobiliary sub-questionnaire.
Correlation between Nutrition and QOL
The correlation between nutrition and QOL, as analyzed on both continuous and categorical scales, is presented in Table 4. On a continuous scale PG-SGA score is strongly negatively correlated (r= -0.79" -0.62) with total FACT-Hep score, PWB subscore, FWB subscore, and Hep subscore, and moderately negatively correlated (r= -0.21) with EWB subscore. Those subjects with a higher PG-SGA score, and therefore poorer nutrition status, had lower total QOL scores with poorer QOL. Further analyzing this relationship using nutrition status cutoffs on a
categorical scale confirms a significant negative association between PG-SGA and FACT-Hep scores. Total FACT-Hep score (P< 0.001), PWB subscore (P< 0.001), FWB subscore (P< 0.001), and Hep subscore (P< 0.001) are significantly negatively correlated with PG-SGA score. “Well-nourished” subjects had a total FACT-Hep median score of 162.5 points, whereas
“severely malnourished” subjects had a median score of 121 points. Well-nourished subjects had a significantly higher QOL than severely malnourished patients (P< 0.001). These results
)"
Table 4: Correlation between Continuous and Categorical Nutrition Scores and QOL Scores
Characteristic PG-SGA Score
Pearson Correlation Coefficienta Well-nourished (0-1 points) Median (min., max) Moderately/ suspected malnourished (2-8 points) Median (min., max) Severely malnourished
("9 points)
Median (min., max)
P-valueb
Total FACT-Hep score
-0.72 162.5
(135, 180) 145 (112, 180) 121 (46, 161) <0.001
PWB subscore -0.72 27
(23, 28) 25 (14, 28) 19 (2, 27) <0.001
SWB subscore -0.13 25
(20, 28) 25 (0, 28) 24 (11, 28) 0.50
EWB subscore -0.21 19.5
(10, 24) 18 (7, 24) 17 (4, 24) 0.19
FWB subscore -0.62 22
(20, 28) 20 (11, 28) 14 (1, 26) <0.001
Hep subscore -0.79 68
(56, 72) 61 (46, 72) 45 (25, 66) <0.001
aCorrelation coefficients calculated based on a continuous PG-SGA scale bP-values based on Kruskal-Wallis tests.
Univariate linear regression analysis of nutrition status revealed no correlation between PG-SGA score and potential confounders including comorbidities, gender, race, presence of jaundice at presentation, enzyme supplementation therapy at presentation, or histologic diagnosis. Univariate linear regression analysis of QOL found the presence of jaundice at presentation is significantly
negatively associated with total FACT-Hep score (P =0.01). The mean total FACT-Hep score for
subjects with jaundice at the time of Visit #1 was nearly 15 points less than the mean for those without jaundice.
Correlation between Nutrition, QOL and Disease Stage
The association between AJCC stage and nutrition and QOL scores is presented in Table 5.
AJCC stage is significantly positively associated with PG-SGA score (P= 0.004), and
significantly negatively associated with total FACT-Hep score (P= 0.05), PWB subscore (P=
0.02), and Hep subscore (P= 0.02). Subjects with a more advanced disease stage (stage III-IV)
had a significantly higher PG-SGA score (median of 9 points), and therefore a poorer nutrition
status than those subjects with less advanced disease (median of 7 points) (P= 0.004). Subjects
*"
131 points), and therefore lower QOL, than those subjects who had a less advanced disease stage (median of 142 points) (P= 0.05).
Table 5: Correlation between AJCC Stage and Nutrition and QOL
Characteristic AJCC Stage
Stage 0/I/II
Median (min., max)
Stage III/IV
Median (min., max)
P-valuea
PG-SGA score 7
(0, 23)
9 (1, 23)
0.004
Total FACT-Hep score
142 (67, 180)
131 (46, 180)
0.05
PWB subscore 25 (8, 28)
21 (2, 28)
0.02
SWB subscore 25
(0, 28)
24 (11, 28)
0.70
EWB subscore 17 (6, 24)
18 (4, 24)
0.72
FWB subscore 20 (2, 28)
16 (1, 28)
0.08
Hep subscore 59 (34, 72)
51 (25, 72)
0.02
aP-values based on Wilcoxon rank-sum tests.
!+"
Table 6: Correlation between AJCC Stage and Significant Confounders
Characteristic Level AJCC Stage 0/I/II
AJCC Stage III/IV
P-valuea
No 59 (64.8)b 32 (35.2)
Hyperlipidemia/ hypercholesterolemia
Yes 2 (10.5) 17 (89.5) <0.001
Pancreatic or periampullary adenocarcinoma
43 (48.3) 46 (51.7) Histologic diagnosis
Pancreatic or periampullary
neuroendocrine tumor
18 (85.7) 3 (14.3) 0.003
aP-values based on Fisher’s exact tests bNumber of subjects (percentage).
In order to assess potential predictors of AJCC stage, logistic regression analyses were performed. The univariate logistic regression analysis revealed that
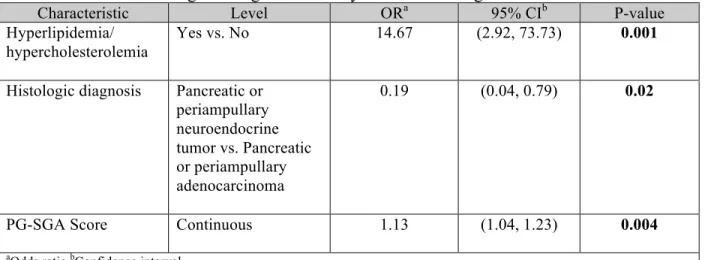
hyperlipidemia/hypercholesterolemia (P< 0.001), histologic diagnosis (P=0.005), PG-SGA (P=0.004), PWB subscore (P=0.02), and Hep subscore (P=0.02) were significantly associated with AJCC stage. A multivariate logistic regression analysis was then conducted and the results are presented in Table 7. Only hyperlipidemia/hypercholesterolemia, histologic diagnosis, and PG-SGA score remained significant in the multivariate model. The results presented in Table 7 show that subjects with hyperlipidemia/hypercholesterolemia were 14.7 times (P=0.001) more likely to have a more advanced disease stage than subjects without
hyperlipidemia/hypercholesterolemia. Subjects with a histologic diagnosis of pancreatic or periampullary neuroendocrine tumor were 81% (P=0.02) less likely to have a more advanced disease stage than subjects diagnosed with pancreatic or periampullary adenocarcinoma. Finally, the odds of having advanced disease stage increased by 13% for every point increase in PG-SGA score. Total FACT-Hep score was not a significant predictor of AJCC disease stage in the
multivariate logistic regression analysis.
Table 7: Multivariate Logistic Regression Analysis of AJCC Stage
Characteristic Level ORa 95% CIb P-value
Hyperlipidemia/ hypercholesterolemia
Yes vs. No 14.67 (2.92, 73.73) 0.001
Histologic diagnosis Pancreatic or periampullary neuroendocrine tumor vs. Pancreatic or periampullary adenocarcinoma
0.19 (0.04, 0.79) 0.02
PG-SGA Score Continuous 1.13 (1.04, 1.23) 0.004
!!" Discussion
The aim of this study was to evaluate if pre-treatment nutrition status is associated with QOL, and if nutrition status and QOL are associated with AJCC tumor stage in subjects with pancreatic and periampullary cancer. The results demonstrate that pre-treatment nutrition status is indeed significantly correlated with QOL, and that nutrition status and QOL are both associated with AJCC tumor stage. Subjects who had higher PG-SGA scores (poorer nutrition status) and lower FACT-Hep scores (lower QOL) were more likely to have a more advanced cancer stage.
However, only nutrition status, histologic diagnosis, and hyperlipidemia/hypercholesterolemia were found to serve as significant predictors of disease stage while other comorbidities, QOL score, gender, race, presence of jaundice at presentation, and enzyme supplementation therapy at presentation were not.
Of the total 110 subjects, 100 of them (91%) had a PG-SGA score " 2 points, which suggests that the majority of subjects were either “moderately/suspected malnourished” or “severely malnourished”. This finding is in accordance with preexisting literature that points to a strong link between cancer and compromised nutrition status. Cancer-associated malnutrition has been demonstrated to affect up to 85% of cancer patients, while at least 80% of pancreatic cancer patients either present with or develop cancer cachexia5. Given the high symptom burden of hepatobiliary cancers and crucial role of the pancreas in digestion and absorption, it is not surprising that these subjects would experience high incidence of symptoms addressed in the PG-SGA such as weight loss, decreased intake, and GI distress.
FACT-Hep scores for this sample also reflected expected QOL trends in this pancreatic and periampullary cancer patient population. The mean total FACT-Hep score of 134 (± 25.4) points
is slightly lower than those reported in other studies of QOL in hepatobiliary cancer patients using the FACT-Hep questionnaire. Hefernan et al. reported mean total FACT-Hep scores of 140-143 points (± 20.6-22.6) among patients with hepatobiliary (primarily liver) cancer. Steel et
al. reported mean total FACT-Hep scores of 139.4 points (± 25.3) at presentation among
metastatic pancreatic cancer patients receiving chemotherapy. QOL may be slightly lower in this sample due to the high prevalence of adenocarcinoma diagnoses and absence of prior treatment.
This strong correlation between PG-SGA and total FACT-Hep scores suggests that common symptoms of pancreatic cancer upon presentation including jaundice, weight loss, and abdominal pain, among others17 influence both nutrition status and QOL. Both the FACT-Hep and PG-SGA questionnaires contain questions related to weight loss, impaired eating, and GI symptoms; therefore, it would be expected that scores would have a degree of correlation. The significant association of PG-SGA score with PWB and Hep subscale scores further confirms this
!#"
This analysis found that both nutrition and QOL scores were significantly associated with AJCC disease stage. This suggests that the more advanced the tumor stage, the greater the severity of symptoms and side effects that impact nutrition and QOL. However, the multivariate logistic regression analysis demonstrated that only hyperlipidemia/hypercholesterolemia, PG-SGA score, and histologic diagnosis serve as predictors of AJCC tumor stage. It was expected that a
diagnosis of pancreatic or periampullary adenocarcinoma would be associated with a more advanced disease stage given the more aggressive nature of adenocarcinoma as compared to neuroendocrine tumors; neuroendocrine tumors have a significantly more favorable prognosis18.
However, the finding that hyperlipidemia/hypercholesterolemia would significantly influence likelihood of more advanced disease stage was unexpected. In fact, subjects with a history of hyperlipidemia/hypercholesterolemia were about 15 times more likely to have stage III-IV pancreatic or periampullary cancer than subjects without this comorbidity. Chronic pancreatitis and cholelithiasis are established risk factors for pancreatic cancer18, which can both influence, and be influenced by, fat absorption and metabolism. This points to a need for future research to further elucidate the role of dyslipidemia in pancreatic and periampullary cancer risk and disease progression.
This study has several limitations. Although this analysis had a cross-sectional study design, AJCC disease stage was not evaluated at the same time point as other clinical, anthropometric, demographic, and treatment-related data at Visit #1. AJCC staging requires confirmed imaging and/or biopsy results, and for this reason both clinical and pathologic AJCC staging was derived at least several months after initial presentation to MDACC. An additional limitation is that the PG-SGA and FACT-Hep questionnaires were self-administered; subjects filled out the surveys at home without supervision. This may have contributed to interpretation inconsistency or
facilitated a greater time lag between survey distribution at Visit #1 and survey return. However, this privacy likely also increased objectivity and reduced likelihood of response bias. Finally, the data sourced from the MPTD from 2009-2013 was collected in two different formats due to a database update performed in 2012. This led to minor discrepancy in comorbidity labels and definitions, which was primarily accounted for by combining related conditions in single categories (ie “Gastroesophageal Reflux Disease (GERD)/peptic ulcer”, “chronic/acute pancreatitis”).
The results can be applied to help inform treatment decisions for patients who have borderline resectable pancreatic or periampullary cancer or suspected metastatic cancer. Those patients who have a diagnosis of pancreatic or periampullary adenocarcinoma, a history of
!$"
the patient prepares for treatment. The strong correlation between FACT-Hep and PG-SGA scores also indicates that using one questionnaire as a proxy for the other may be a viable option when resources limit evaluation of both patients’ nutrition and QOL status. Administration of the PG-SGA could serve as both a measure of nutrition status and a general indicator of QOL.
Direction for future research includes further exploring the relationship between categorized PG-SGA scores and FACT-Hep scores; although FACT-Hep scores are analyzed on a continuous scale, validated FACT-Hep ranges that correspond to established PG-SGA malnutrition categories would aid practitioners in estimating nutrition and QOL status using a single
questionnaire. Further research is also needed to investigate the impact of nutrition intervention by a Registered Dietitian (RD) on nutrition status and QOL in pancreatic and periampullary cancer patients. Lastly, investigation into the relationship between
hyperlipidemia/hypercholesterolemia also may be warranted, given the strongly predictive relationship between this comorbidity and AJCC disease stage.
!%" References
1. Surveillance, Epidemiology, and End Results Program Stat Fact Sheets: Pancreas Cancer. National Cancer Institute website. http://seer.cancer.gov/statfacts/html/pancreas.html." Published April 2014. Accessed October 20, 2014.
2. He X, Yuan Y. Advances in pancreatic cancer research: moving towards early detection. World J Gastroenterol. 2014; 20(32):11241-11248.
3. Steel J, Eton D, Cella D, Olek M, Carr B. Clinically meaningful changes in health-related quality of life in patients diagnosed with hepatobiliary carcinoma. Ann Oncol. 2006; 17:304-312.
4. Sun V, Ferrell B, Juarez G, Wagman L, Yen Y, Chung V. Symptom concerns and quality of life in hepatobiliary cancers. Oncol Nurs Forum. 2008; 35(3):45-52.
5. Argiles, JM. Cancer-associated malnutrition. Eur J of Oncol Nursing. 2005;(9)S39-S50.
6. Isenring E, Bauer J, Capra S. The scored Patient-generated Subjective Global Assessment (PG-SGA) and its association with quality of life in ambulatory patients receiving radiotherapy. Eur J Clin Nutr. 2003; 57:305-209.
7. Heffernan N, Cella D, Webster K, Odom L, Martone M, Passik S, et al. Measuring health-related quality of life in patients with hepatobiliary cancers: the Functional Assessment of Cancer Therapy- Hepatobiliary Questionnaire. J Clin Oncol. 2002; 20(9): 2229-2239.
8. Ravasco P, Monteiro-Grillo I, Vidal P, Camilo M. Cancer: disease and nutrition are key determinants of patients’ quality of life. Support Care Cancer. 2004; 12:246-252.
9. Lis C, Gupta D, Lammersfeld C, Markman M, Vashi P. Role of nutritional status in predicting quality of life outcomes in cancer- a systematic review of the epidemiological literature. Nutr J. 2012; 11:27-45.
10. Cella D, Butt Z, Kindler H, Fuchs C, Bray S, Barlev A, et al. Validity of the FACT Hepatobiliary (FACT-Hep) questionnaire for assessing disease-related symptoms and health-related quality of life in patients with metastatic pancreatic cancer. Qual Life Res. 2013; 22:1105-1112.
11. Nowak A, Cebon J, Hargreaves C, Dhillon H, Findlay M, Gebski V, et al. Assessment of health-related quality of life and patient benefit as outcome measures for clinical trials in hepatocellular carcinoma. Asia Pac J Clin Oncol. 2008; 4:55-67.
!&"
13. Tamm E, Balachandran A, Bhosale P, Katz M, Fleming J, Lee J, et al. Imaging of pancreatic
adenocarcinoma: update on staging/resectability. Radiol Clin N Am. 2012; 50:407-428.
14. Edge SB, Byrd DR, Compton CC, Fritz AG, Greene FL, Trotti A, editors. AJCC cancer staging manual (7th ed). New York, NY: Springer; 2010.
15. Yamamoto Y, Nemoto T, Okubo Y, Nihonyanagi Y, Ishiwatari T, Takuma K, et al. Comparison between the location and the histomorphological/immunohistochemical
characteristics of noninvasive neoplasms of the ampulla of Vater. Hum Pathol.
2014;45(9):1910-17.
16. FACT-Hep Scoring Guidelines (Version 4). Functional Assessment of Chronic Illness Therapy (FACIT) website. www.facit.org. Last revised May 21, 2003. Accessed October 11, 2014.
17. de Braud F, Cascinu S, Gatta G. Cancer of Pancreas. Crit Rev Oncol Hematol.
2004;50(2):147-155.
18. Thomassett SC, Dileep NL. Pancreatic cancer. Surgery (Oxford). 2010;28(5):183-242.
!'"
!"#$%&'()*+',-./0)12)
( (
C,$3D(%&(.($%&<(3A(&<.<,4,"<&(<'.<(3<',-(:,3:$,(D%<'(;3E-(%$$",&&('.+,(&.%F(.-,(%4:3-<."<3)45'6-')7.,75')
/,)86,9)/0')0:8;',)(',)5.0')</).0=.76<')>/:,),'-(/0-')6-).<)6((5.'-)</)<?')(6-<)@)=6>-3)
( (
( (
(
4&ABC#"D)EFDD%GFCHI)
(
H/<)
6<)655) ")5.<<5');.<) B/8'%J?6<) K:.<'6);.<) 8:7?)+',>)
G@0( H('.+,(.($.IJ(3A(,",-#; KKKKKKKKKKKKKKKKKKKKKKKKKKKKKKKKKKKKKKKKKKKKKKKKKKKKKKK 7( 0( 6( B( L(
G@6( H('.+,(".E&,. KKKKKKKKKKKKKKKKKKKKKKKKKKKKKKKKKKKKKKKKKKKKKKKKKKKKKKKKKKKKKKKKKKKKKK 7( 0( 6( B( L(
G@B( C,I.E&,(3A(4;(:';&%I.$(I3"F%<%3"?(H('.+,(<-3E5$,(
4,,<%"#(<',(",,F&(3A(4;(A.4%$; KKKKKKKKKKKKKKKKKKKKKKKKKKKKKKKKKKKKKKKKK ( 7(
( 0(
( 6(
( B(
( L(
G@L( H('.+,(:.%" KKKKKKKKKKKKKKKKKKKKKKKKKKKKKKKKKKKKKKKKKKKKKKKKKKKKKKKKKKKKKKKKKKKKKKKKKK 7( 0( 6( B( L(
G@M( H(.4(53<',-,F(5;(&%F,(,AA,I<&(3A(<-,.<4,"< KKKKKKKKKKKKKKKKKKKKKKKKK 7( 0( 6( B( L(
G@1( H(A,,$(%$$ KKKKKKKKKKKKKKKKKKKKKKKKKKKKKKKKKKKKKKKKKKKKKKKKKKKKKKKKKKKKKKKKKKKKKKKKKKKKKKK 7( 0( 6( B( L(
G@8( H(.4(A3-I,F(<3(&:,"F(<%4,(%"(5,FKKKKKKKKKKKKKKKKKKKKKKKKKKKKKKKKKKKKKKKK 7( 0( 6( B( L(
( (
(
BL#C"DM!"NCDA)EFDD%GFCHI)
(
H/<) 6<)655)
")5.<<5') ;.<)
B/8'% J?6<)
K:.<' 6);.<)
+',>) 8:7?)
GN0( H(A,,$(I$3&,(<3(4;(A-%,"F&KKKKKKKKKKKKKKKKKKKKKKKKKKKKKKKKKKKKKKKKKKKKKKKKKKKK 7( 0( 6( B( L(
GN6( H(#,<(,43<%3".$(&E::3-<(A-34(4;(A.4%$; KKKKKKKKKKKKKKKKKKKKKKKKKKKK 7( 0( 6( B( L(
GNB( H(#,<(&E::3-<(A-34(4;(A-%,"F&KKKKKKKKKKKKKKKKKKKKKKKKKKKKKKKKKKKKKKKKKKKKK 7( 0( 6( B( L(
GNL( O;(A.4%$;('.&(.II,:<,F(4;(%$$",&& KKKKKKKKKKKKKKKKKKKKKKKKKKKKKKKKKKKK 7( 0( 6( B( L(
GNM( H(.4(&.<%&A%,F(D%<'(A.4%$;(I344E"%I.<%3"(.53E<(4;(
%$$",&&KKKKKKKKKKKKKKKKKKKKKKKKKKKKKKKKKKKKKKKKKKKKKKKKKKKKKKKKKKKKKKKKKKKKKKKKKKKKKKKKKK 7(( 0(( 6(( B(( L((
GN1( H(A,,$(I$3&,(<3(4;(:.-<",-()3-(<',(:,-&3"(D'3(%&(4;(4.%"(
&E::3-</ KKKKKKKKKKKKKKKKKKKKKKKKKKKKKKKKKKKKKKKKKKKKKKKKKKKKKKKKKKKKKKKKKKKKKKKKKKKKKK ( 7(
( 0(
( 6(
( B(
( L(
P0( !"#$%&'"(()*+),*-%).-%%"/0)'"1"')*+)("2-$')$.03130,4)5'"$(")
$/(6"%)07")+*''*63/#)8-"(03*/9):+),*-)5%"+"%)/*0)0*)$/(6"%)304) 5'"$(");$%<)073()=*2)))))))))))$/&)#*)0*)07")/"20)(".03*/9(
( ( ( ( (
!"#$%&'()*+',-./0)12)
((
C,$3D(%&(.($%&<(3A(&<.<,4,"<&(<'.<(3<',-(:,3:$,(D%<'(;3E-(%$$",&&('.+,(&.%F(.-,(%4:3-<."<3)45'6-')7.,75') /,)86,9)/0')0:8;',)(',)5.0')</).0=.76<')>/:,),'-(/0-')6-).<)6((5.'-)</)<?')(6-<)@)=6>-3)
( (
( (
(
4&ABC#"D)EFDD%GFCHI)
(
H/<)
6<)655) ")5.<<5');.<) B/8'%J?6<) K:.<'6);.<) 8:7?)+',>)
G@0( H('.+,(.($.IJ(3A(,",-#; KKKKKKKKKKKKKKKKKKKKKKKKKKKKKKKKKKKKKKKKKKKKKKKKKKKKKKK 7( 0( 6( B( L(
G@6( H('.+,(".E&,. KKKKKKKKKKKKKKKKKKKKKKKKKKKKKKKKKKKKKKKKKKKKKKKKKKKKKKKKKKKKKKKKKKKKKK 7( 0( 6( B( L(
G@B( C,I.E&,(3A(4;(:';&%I.$(I3"F%<%3"?(H('.+,(<-3E5$,(
4,,<%"#(<',(",,F&(3A(4;(A.4%$; KKKKKKKKKKKKKKKKKKKKKKKKKKKKKKKKKKKKKKKKK ( 7(
( 0(
( 6(
( B(
( L(
G@L( H('.+,(:.%" KKKKKKKKKKKKKKKKKKKKKKKKKKKKKKKKKKKKKKKKKKKKKKKKKKKKKKKKKKKKKKKKKKKKKKKKKK 7( 0( 6( B( L(
G@M( H(.4(53<',-,F(5;(&%F,(,AA,I<&(3A(<-,.<4,"< KKKKKKKKKKKKKKKKKKKKKKKKK 7( 0( 6( B( L(
G@1( H(A,,$(%$$ KKKKKKKKKKKKKKKKKKKKKKKKKKKKKKKKKKKKKKKKKKKKKKKKKKKKKKKKKKKKKKKKKKKKKKKKKKKKKKK 7( 0( 6( B( L(
G@8( H(.4(A3-I,F(<3(&:,"F(<%4,(%"(5,FKKKKKKKKKKKKKKKKKKKKKKKKKKKKKKKKKKKKKKKK 7( 0( 6( B( L(
( (
(
BL#C"DM!"NCDA)EFDD%GFCHI)
(
H/<) 6<)655)
")5.<<5') ;.<)
B/8'% J?6<)
K:.<' 6);.<)
+',>) 8:7?)
GN0( H(A,,$(I$3&,(<3(4;(A-%,"F&KKKKKKKKKKKKKKKKKKKKKKKKKKKKKKKKKKKKKKKKKKKKKKKKKKKK 7( 0( 6( B( L(
GN6( H(#,<(,43<%3".$(&E::3-<(A-34(4;(A.4%$; KKKKKKKKKKKKKKKKKKKKKKKKKKKK 7( 0( 6( B( L(
GNB( H(#,<(&E::3-<(A-34(4;(A-%,"F&KKKKKKKKKKKKKKKKKKKKKKKKKKKKKKKKKKKKKKKKKKKKK 7( 0( 6( B( L(
GNL( O;(A.4%$;('.&(.II,:<,F(4;(%$$",&& KKKKKKKKKKKKKKKKKKKKKKKKKKKKKKKKKKKK 7( 0( 6( B( L(
GNM( H(.4(&.<%&A%,F(D%<'(A.4%$;(I344E"%I.<%3"(.53E<(4;(
%$$",&&KKKKKKKKKKKKKKKKKKKKKKKKKKKKKKKKKKKKKKKKKKKKKKKKKKKKKKKKKKKKKKKKKKKKKKKKKKKKKKKKKK 7(( 0(( 6(( B(( L((
GN1( H(A,,$(I$3&,(<3(4;(:.-<",-()3-(<',(:,-&3"(D'3(%&(4;(4.%"(
&E::3-</ KKKKKKKKKKKKKKKKKKKKKKKKKKKKKKKKKKKKKKKKKKKKKKKKKKKKKKKKKKKKKKKKKKKKKKKKKKKKKK ( 7(
( 0(
( 6(
( B(
( L(
P0( !"#$%&'"(()*+),*-%).-%%"/0)'"1"')*+)("2-$')$.03130,4)5'"$(")
$/(6"%)07")+*''*63/#)8-"(03*/9):+),*-)5%"+"%)/*0)0*)$/(6"%)304) 5'"$(");$%<)073()=*2)))))))))))$/&)#*)0*)07")/"20)(".03*/9(
( ( ( ( (
!"#$%&'()*+',-./0)12)
((
45'6-')7.,75')/,)86,9)/0')0:8;',)(',)5.0')</).0=.76<')>/:,),'-(/0-')6-).<)6((5.'-)</)<?')(6-<)@) =6>-3)
( ( (
(
FNL$CLH"D)EFDD%GFCHI)
H/<)6<)655)
")5.<<5') ;.<)
B/8'% J?6<)
K:.<' 6);.<)
+',>) 8:7?)
G!0( H(A,,$(&.F KKKKKKKKKKKKKKKKKKKKKKKKKKKKKKKKKKKKKKKKKKKKKKKKKKKKKKKKKKKKKKKKKKKKKKKKKKKKKK 7( 0( 6( B( L(
G!6( H(.4(&.<%&A%,F(D%<'('3D(H(.4(I3:%"#(D%<'(4;(%$$",&&KKKKKKKKKK 7( 0( 6( B( L(
G!B( H(.4($3&%"#('3:,(%"(<',(A%#'<(.#.%"&<(4;(%$$",&&KKKKKKKKKKKKKKKKKK 7( 0( 6( B( L(
G!L( H(A,,$(",-+3E&KKKKKKKKKKKKKKKKKKKKKKKKKKKKKKKKKKKKKKKKKKKKKKKKKKKKKKKKKKKKKKKKKKKKKKK 7( 0( 6( B( L(
G!M( H(D3--;(.53E<(F;%"# KKKKKKKKKKKKKKKKKKKKKKKKKKKKKKKKKKKKKKKKKKKKKKKKKKKKKKKKKKKKK 7( 0( 6( B( L(
G!1( H(D3--;(<'.<(4;(I3"F%<%3"(D%$$(#,<(D3-&, KKKKKKKKKKKKKKKKKKKKKKKKKKKK 7( 0( 6( B( L(
( ( ( (
(
!OH#$CLH"D)EFDD%GFCHI)
(H/<) 6<)655)
")5.<<5') ;.<)
B/8'% J?6<)
K:.<' 6);.<)
+',>) 8:7?)
GR0( H(.4(.5$,(<3(D3-J()%"I$EF,(D3-J(.<('34,/ KKKKKKKKKKKKKKKKKKKKKKKKKK 7( 0( 6( B( L(
GR6( O;(D3-J()%"I$EF,(D3-J(.<('34,/(%&(AE$A%$$%"#KKKKKKKKKKKKKKKKKKKKK 7( 0( 6( B( L(
GRB( H(.4(.5$,(<3(,"S3;($%A,KKKKKKKKKKKKKKKKKKKKKKKKKKKKKKKKKKKKKKKKKKKKKKKKKKKKKKKKKK 7( 0( 6( B( L(
GRL( H('.+,(.II,:<,F(4;(%$$",&&KKKKKKKKKKKKKKKKKKKKKKKKKKKKKKKKKKKKKKKKKKKKKKKKKKK 7( 0( 6( B( L(
GRM( H(.4(&$,,:%"#(D,$$ KKKKKKKKKKKKKKKKKKKKKKKKKKKKKKKKKKKKKKKKKKKKKKKKKKKKKKKKKKKKKKK 7( 0( 6( B( L(
GR1( H(.4(,"S3;%"#(<',(<'%"#&(H(E&E.$$;(F3(A3-(AE" KKKKKKKKKKKKKKKKKKKKKK 7( 0( 6( B( L(
GR8( H(.4(I3"<,"<(D%<'(<',(TE.$%<;(3A(4;($%A,(-%#'<("3DKKKKKKKKKKKKKK 7( 0( 6( B( L(
!"#$%&'()*+',-./0)12)
( (
45'6-')7.,75')/,)86,9)/0')0:8;',)(',)5.0')</).0=.76<')>/:,),'-(/0-')6-).<)6((5.'-)</)<?')(6-<)@) =6>-3)
( (
(
"PPC$CLH"D)#LH#FQHB)
(H/<)6<) 655)
")5.<<5') ;.<)
B/8'% J?6<)
K:.<') 6);.<)
+',>) 8:7?)
90( H('.+,(&D,$$%"#(3-(I-.4:&(%"(4;(&<34.I'(.-,. KKKKKKKKKKKKKKKKKKK 7( 0( 6( B( L(
96( H(.4($3&%"#(D,%#'<KKKKKKKKKKKKKKKKKKKKKKKKKKKKKKKKKKKKKKKKKKKKKKKKKKKKKKKKKKKKKKK 7( 0( 6( B( L(
9B( H('.+,(I3"<-3$(3A(4;(53D,$&KKKKKKKKKKKKKKKKKKKKKKKKKKKKKKKKKKKKKKKKKKKKKKKK 7( 0( 6( B( L(
9L( H(I."(F%#,&<(4;(A33F(D,$$ KKKKKKKKKKKKKKKKKKKKKKKKKKKKKKKKKKKKKKKKKKKKKKKKKKKK 7( 0( 6( B( L(
9M( H('.+,(F%.--',.()F%.--'3,./ KKKKKKKKKKKKKKKKKKKKKKKKKKKKKKKKKKKKKKKKKKKKKKKKKK 7( 0( 6( B( L(
91( H('.+,(.(#33F(.::,<%<, KKKKKKKKKKKKKKKKKKKKKKKKKKKKKKKKKKKKKKKKKKKKKKKKKKKKKKKKK 7( 0( 6( B( L(
U,:
0( H(.4(E"'.::;(.53E<(.(I'."#,(%"(4;(.::,.-."I,KKKKKKKKKKKKKKKKK 7( 0( 6( B( L(
92N
8( H('.+,(:.%"(%"(4;(5.IJ KKKKKKKKKKKKKKKKKKKKKKKKKKKKKKKKKKKKKKKKKKKKKKKKKKKKKKKK 7( 0( 6( B( L(
9Q1( H(.4(53<',-,F(5;(I3"&<%:.<%3" KKKKKKKKKKKKKKKKKKKKKKKKKKKKKKKKKKKKKKKKKKKKK 7( 0( 6( B( L(
U08( H(A,,$(A.<%#E,F KKKKKKKKKKKKKKKKKKKKKKKKKKKKKKKKKKKKKKKKKKKKKKKKKKKKKKKKKKKKKKKKKKKKKK 7( 0( 6( B( L(
V"8( H(.4(.5$,(<3(F3(4;(E&E.$(.I<%+%<%,&KKKKKKKKKKKKKKKKKKKKKKKKKKKKKKKKKKKKKK 7( 0( 6( B( L(
U,:
6( H(.4(53<',-,F(5;(S.E"F%I,(3-(;,$$3D(I3$3-(<3(4;(&J%"KKKKKKKK 7( 0( 6( B( L(
U,:(
B( H('.+,('.F(A,+,-&(),:%&3F,&(3A('%#'(53F;(<,4:,-.<E-,/ KKKKKK 7( 0( 6( B( L(
U,:(
L( H('.+,('.F(%<I'%"# KKKKKKKKKKKKKKKKKKKKKKKKKKKKKKKKKKKKKKKKKKKKKKKKKKKKKKKKKKKKKKKK 7( 0( 6( B( L(
U,:(
M( H('.+,('.F(.(I'."#,(%"(<',(D.;(A33F(<.&<,& KKKKKKKKKKKKKKKKKKKKKKKKK 7( 0( 6( B( L(
U,:(
1( H('.+,('.F(I'%$$& KKKKKKKKKKKKKKKKKKKKKKKKKKKKKKKKKKKKKKKKKKKKKKKKKKKKKKKKKKKKKKKKKK 7( 0( 6( B( L(
U2(
6( O;(43E<'(%&(F-; KKKKKKKKKKKKKKKKKKKKKKKKKKKKKKKKKKKKKKKKKKKKKKKKKKKKKKKKKKKKKKKKKK 7( 0( 6( B( L(
U,:(
>( H('.+,(F%&I34A3-<(3-(:.%"(%"(4;(&<34.I'(.-,. KKKKKKKKKKKKKKKKKKKK 7( 0( 6( B( L(
History (Boxes 1-4 are designed to be completed by the patient.)
2. Food Intake: As compared to my normal intake, I would rate my food intake during the past month as:
unchanged (0) more than usual (0) less than usual (1)
I am now taking:
normal food but less than normal amount (1)
little solid food (2) only liquids (3)
only nutritonal supplements (3) very little of anything (4)
only tube feedings or only nutrition by vein (0)
1. Weight (See Worksheet 1)
In summary of my current and recent weight:
I currently weigh about _______ pounds I am about _________ feet _________ tall
One month ago I weighed about _________ pounds Six months ago I weighed about _________ pounds
During the past two weeks my weight has:
decreased(1) not changed (0) increased (0)
3. Symptoms: I have had the following problems that have kept me from eating enough during the past two weeks (check all that apply):
no problems eating (0)
no appetite, just did not feel like eating (3)
nausea (1) vomiting (3)
constipation (1) diarrhea (3) mouth sores (2) dry mouth (1) things taste funny or have no taste (1) smells bother me (1) problems swallowing (2) feel full quickly(1)
pain; where? (3)________________ fatigue(1) other** (1) ______________________________________________
** Examples: depression, money, or dental problems
Scored Patient-Generated Subjective
Global Assessment (PG-SGA)
Additive Score of the Boxes 1-4
Patient ID Information
A 4. Activities and Function: Over the past month, I
would generally rate my activity as: normal with no limitations (0)
not my normal self, but able to be up and about with fairly normal activities (1)
not feeling up to most things, but in bed or chair less than half the day (2) able to do little activity and spend most of the day in bed or chair (3) pretty much bedridden, rarely out of bed(3)
Box 1
Box 3
Box 2
Box 4
( >30mg prednisone
equivalents/day)
The remainder of this form will be completed by your doctor, nurse, dietitian, or therapist. Thank you.
7. Worksheet 4 - Physical Exam
Scored Patient-Generated Subjective Global Assessment (PG-SGA)
Additive Score of the Boxes 1-4
5. Worksheet 2 - Disease and its relation to nutritional requirements
All relevant diagnoses (specify) ________________________________________
Numerical score from Worksheet 1
Numerical score from Worksheet 3 C
Numerical score from Worksheet 4 D 6. Work Sheet 3 - Metabolic Demand
A
One point each:
Cancer AIDS Pulmonary or cardiac cachexia Presence of decubitus, open wound, or fistula Presence of trauma Age greater than 65 years Chronic renal insufficiency
Score for metabolic stress is determined by a number of variables known to increase protein & calorie needs. The score is additive so that a patient who has a fever of > 102 degrees (3 points) and is on 10 mg of prednisone chronically (2 points) would have an additive score for this section of 5 points.
Stress none(0) low (1) moderate(2) high (3)
Fever no fever >99 and <101 >101 and <102 >102
Fever duration no fever <72 hrs 72 hrs > 72 hrs
Corticosteroids no corticosteroids low dose moderate dose high dose steroid
(<10mg prednisone
equivalents/day) equivalents/day(>10 and <30mg prednisone)
Physical exam includes a subjective evaluation of 3 aspects of body composition: fat, muscle, & fluid status. Since this is subjective, each aspect of the exam is rated for degree of deficit. Muscle deficit impacts point score more than fat deficit. Definition of categories: 0 = no deficit, 1+ = mild deficit, 2+ = moderate 3+ = severe
Muscle Status:
temples (temporalis muscle) 0 1+ 2+ 3+
clavicles (pectoralis & deltoids) 0 1+ 2+ 3+
shoulders (deltoids) 0 1+ 2+ 3+
interosseous muscles 0 1+ 2+ 3+
Scapula (latissimus dorsi, trapezius, deltoids) 0 1+ 2+ 3+
thigh (quadriceps) 0 1+ 2+ 3+
calf (gastrocnemius) 0 1+ 2+ 3+
Global muscle status rating 0 1+ 2+ 3+
Fluid Status:
ankle edema 0 1+ 2+ 3+
sacral edema 0 1+ 2+ 3+
ascites 0 1+ 2+ 3+
Global fluid status rating 0 1+ 2+ 3+
Fat Stores:
orbital fat pads 0 1+ 2+ 3+
triceps skin fold 0 1+ 2+ 3+
fat overlying lower ribs 0 1+ 2+ 3+
Global fat deficit rating 0 1+ 2+ 3+
Clinician Signature ___________________________ RD RN PA MD DO Other ___ Date _______
(See Side 1) Worksheet 1 - Scoring Weight (Wt) Loss
To determine score, use 1 month weight data if available. Use 6 month data only if there is no 1 month weight data. Use points below to score weight change and add one extra point if patient has lost weight during the past 2
Wt lossin 1 month
10% or greater
5-9.9%
3-4.9%
2-2.9%
0-1.9%
Points
4 3 2 1 0
Wt loss in 6 months
20% or greater
10 -19.9%
6 - 9.9%
2 - 5.9%
0 - 1.9%
Numerical score from Worksheet 2 B
Total PG-SGA score
(Total numerical score of A+B+C+D above)
(See triage recommendations below)
Worksheet 5 - PG-SGA Global Assessment Categories
Stage A Stage B Stage C
Category Well nourished Moderately malnourished Severely malnourished Weight No wt loss < 5% wt loss in 1 month > 5% wt loss in 1 month
OR Recent wt gain (or 10% in 6 mos) (or >10% in 6 mos)
OR Progressive wt loss OR Progressive wt loss Nutrient intake No deficit
OR Significant recent Definite decrease in intake Severe deficit in intake improvement
Nutrition Impact None Present of nutrition impact Present of nutrition impact Symptoms OR Singificant recent symptoms (PG-SGA Box 3) symptoms (PG-SGA Box 3)
improvement allowing adequate intake
Functioning No deficit OR Moderate functional deficit Severe functional deficit Recent improvement OR Recent deterioration OR recent significant deterioration Physical Exam No deficit OR Evidence of mild to moderate Obvious signs of malnutrition
Chronic deficint but loss of muscle mass / SQ fat / (eg, severe loss muscle, SQ tissue, recent improvement muscle tone on palpation possible edema)
Nutritional Triage Recommendations:Additive score is used to define specific nutritional interventions including patient & family education, symptom management including pharmacologic intervention, and appropriate nutrient intervention (food, nutritional supplements, enteral, or parenteral triage).
First line nutrition intervention includes optimal symptom management.
Triage based on PG-SGA point score
0-1 No intervention required at this time. Re-assessment on routine and regular basis during treatment. 2-3 Patient & family education by dietitian, nurse, or other clinician with pharmacologic intervention as
indicated by symptom survey (Box 3) and lab values as appropriate.
4-8 Requires intervention by dietitian, in conjunction with nurse or physician as indicated by symptoms (Box 3). > 9 Indicates a critical need for improved symptom management and/or nutrient intervention options.