Exploring Common Determinants of Caries and Overweight/Obesity in Early Childhood: The 30,000-foot View
Meredith Gentry Byrd, DDS
The University of North Carolina at Chapel Hill Gillings School of Global Public Health
A paper submitted to the faculty of the University of North Carolina at Chapel Hill in partial fulfillment of the requirements for the degree of Master of Public Health in the Department of Nutrition
Date April 20, 2018
Approved by: _ _____
(Paper Advisor)
[The following scientific manuscript is formatted according to author instructions for Pediatrics, AMA Style]
Title: Exploring Common Determinants of Caries and Overweight/Obesity in Early Childhood: The 30,000-foot View
M. Gentry Byrda,b, DDS, Alice Ammermanb, DrPH, Kimon Divarisa,c DDS, PhD
Affiliations:aDepartment of Pediatric Dentistry, School of Dentistry, bDepartment of Nutrition, and cDepartment of Epidemiology, Gillings School of Global Public Health, University of North Carolina at Chapel Hill
Address Correspondence to: Meredith Gentry Byrd, 228 Brauer Hall CB #7450, Pediatric Dentistry Dept, UNC School of Dentistry, Chapel Hill, NC, 27599, 919-537-3956
Short Title: Caries and Overweight/Obesity: The 30,000-foot View
Financial Disclosure Statement: The authors have no financial relationships relevant to this article to disclose
Funding Source: All phases of this study were supported by NIH/NIDCR: U01DE025046.
Potential Conflicts of Interest: The authors have no conflicts of interest relevant to this article to disclose.”
Abbreviations:
OWOB - Overweight/Obesity
GIS - Geographic Information Systems
Table of Contents Summary: “While no significant associations between caries and BMI in early childhood were observed, this study identified significant geographic clustering of chronic
Contributor’s Statement Page
Dr Byrd and Dr Divaris conceptualized and designed the study, drafted the initial manuscript, and reviewed and revised the manuscript.
Dr Ammerman reviewed the manuscript for important intellectual content.
Abstract
Objectives: Dental caries and overweight/obesity (OWOB) are two of the most common chronic diseases in early childhood. In this study, we sought to determine disease burden and potential common risk factor associations with caries, OWOB, and their comorbidity among preschool-age children. We employed GIS-based methods to examine the geographical differences within the context of social and environmental determinants.
Methods: The sample comprised 2,698 preschool-age children enrolled and participating in ZOE 2.0, a community-based study of early childhood oral health in NC Head Start. Self-administered questionnaires were given to caregivers to collect information on parent and child
sociodemographic characteristics, and child dietary and health-related behaviors. Anthropometric measurements (i.e., BMI percentiles) and clinical oral health information (i.e., dental caries experience) were collected by calibrated oral health examiners. Analyses included descriptive and bivariate methods, including X2, non-parametric trend tests or ANOVA and spatial hot spot analyses based on Getis-Ord Gi* and Local Moran’s I.
Results: Two-thirds of children had caries experience, OWOB, or both, and parental education was the strongest predictor of these outcomes (P<0.0005). Parents’ oral health status (P<0.0005) and individual-level behaviors were also significantly associated with caries and comorbidity. Geocoding revealed significant, non-random geographical spatial clustering of ‘hot spots’ and ‘cold spots’ among our analytical sample, that corresponded to census tract-level population estimates of social determinants of health in NC.
Introduction
Dental caries and overweight/obesity (OWOB) are two highly prevalent chronic health diseases of early childhood. Nationwide, close to 1 in 4 2-5 year-old children old have dental caries
experience while 1 in 5 are overweight or obese.1,2 While often studied in isolation, studies have investigated associations between the two chronic diseases and yielded mixed to inconclusive
results, which could be partially attributed to non-standardized methods in definitions, clinical measures and categorizations of each.3
The disease processes of caries and OWOB are characterized by unique pathways of causation with multifactorial etiologies, however, both are largely nutritionally-driven. Dental caries relies
on fermentable carbohydrate substrate for selection of bacterial species, eventually resulting in dysbiosis and the establishment and maturation of biofilm on the tooth-surface level if not removed mechanically. Overweight/obesity is not without microbiome interactions but is largely
attributed to a nutritional imbalance towards excess energy consumption. The most recent meta-analysis reports that caries in the primary dentition is significantly associated with overweight
and obesity, while previous meta-analyses demonstrate a significant relationship between the two but conclude that this is attenuated by age and socioeconomic factors.3,4 Crossover likely exists along the two causal pathways. Literature suggests that the common determinants are likely tied
Caries and OWOB are considered to be largely preventable, underlining the magnitude of their
public health importance. Disease onset in early childhood has significant implications for future disease development and quality of life on the individual level, not to mention the economic burden on the family, community, and societal levels for treatment and management over time.7-9 The Fisher-Owens conceptual model for oral health in childhood, which would easily be adapted to OWOB, depicts the influence of caregiver/family-level factors and the greater social and
environmental context (Appendix A).5 Non-modifiable factors such as a child’s genetic makeup, which inform susceptibility to disease and treatment, are undoubtedly important, but the more upstream, modifiable social determinants of health bidirectionally interact with the caregiver and
child, influencing health behaviors and values to promote or protect against disease development.
Investigating the complex interactions of factors along the causal pathway is challenging to capture; of increasing value in these considerations is the geographical dimension. Across the US, we know there is considerable state-level variation in oral health in access to health care and
health status.5 Studies investigating childhood chronic disease show that the geographical
location and neighborhood of where a child lives is of considerable importance.10 With advances in geographic information systems (GIS) technology, novel applications for public health
research facilitate the investigation of geographic relationships and further inform community-level differences in considering the complex interactions of determinants.11,12 Understanding the common upstream determinants may better inform strategic resource allocation and approaches to move away from targeting individual behavior change specific to each chronic disease in
children ages 3-5. The two aims of this study were to 1) determine disease burden and common
risk factor associations and 2) identify potential geographical variation (i.e., clustering) of these diseases and their comorbidity across the state of North Carolina using GIS methodology.
Methods
This investigation was approved by the University of North Carolina-Chapel Hill Office of Human Research Ethics (UNC IRB #14-1992) and was carried out in the context of the ZOE 2.0 (“Genes for Smiles”) parent study. North Carolina public preschool student recruitment,
enrollment and study protocol have been described elsewhere.13 English or Spanish-language questionnaires were administered to participants’ caregivers for completion prior enrollment in
the study to collect sociodemographic and oral health-related behavior information.
Anthropometric measurements collected were weight, obtained using a calibrated portable digital
scale (Doran® Remote Indicator Scale), and height, obtained using a calibrated portable/wall mounted stadiometer with a movable head piece (seca®). Height was recorded in inches (in.) and
weight was recorded in pounds (lbs.) by two examiners for quality assurance. Age- and sex-specific BMI percentiles according to CDC growth charts were calculated using Stata’s (StataCorp LP, College Station, TX) zanthro program, The BMI percentile classifications
Comprehensive dental examinations were carried out by calibrated oral health professionals
according to a well-established clinical examination protocol using International Caries Diagnosis System (ICDAS) visual diagnostic criteria for the determination of dental disease experience and severity. Tooth-surface caries diagnoses were based on these criteria and made at
the levels of health (ICDAS code: 0), early-stage (ICDAS codes: 1-2) and established/severe stage (ICDAS codes: 3-6). A dmfs (decayed, missing due to caries and filled/restored primary
tooth surfaces; ranging between 0 and 88) index is created as a sum of surface-level conditions, with dmfs>0 indicating an Early Childhood Caries (ECC) case. For the purposes of this study, the outcome of severe/established caries was defined as presence of one or more
established/severe carious lesion, ( >ICDAS 3), restored, crowned, and/or missing due to caries.13
The primary outcome was child “comorbidity count” of caries and overweight/obesity (OWOB) status during childhood, defined as joint existence of dental caries and OWOB (0, not caries case
and healthy weight or underweight; 1, caries case or OWOB; 2 caries case and OWOB). In
addition to age and sociodemographic characteristics (race/ethnicity, parent education level), six
nominal covariates informed child dietary pattern, oral health-related hygiene behaviors and parent perceptions of oral health status for both self and child. Dietary factors included whether child was put to bed with bottle containing something other than water (yes or no), and the
number of sugar-containing snacks or beverages consumed between meals (0-1, 2-3, >4)]. Parent-reported perception of oral health status (OHS) for their child OHS and self OHS were
brushes, or not brushed at home) and frequency of daily tooth brushing (sometimes/not every
day, once a day, or twice a day/more often)]. Initial data analysis for descriptive and presentation purposes investigated caries outcome and OWOB status independently prior to analyzing the primary outcome, comorbidity count. Bivariate tests of association (X2, non-parametric trend tests or ANOVA) were performed using Stata 15.1 (StataCorp, College Station, TX).
We used geocoding technology to code participants’ addresses into latitude and longitude
coordinates. These addresses were matched to complete (enrolled and examined) and incomplete (enrolled but not yet examined) study data in March of 2018 and geocoded. Six-thousand
dummy addresses from the North Carolina One-map dataset were geocoded simultaneously to protect participants from deductive disclosure (citation NC One-Map).14 One hundred and seven participants were excluded due to non-matched addresses, leaving N=4,204 total geocoded participants. Once geocoded, the latitude and longitude address coordinates were converted to metrics for spatial analysis. Getis-Ord Gi* was employed for hot spot analysis, where presence
or absence of geographic hot spots and cold spots for a given outcome or variable were determined for the study population. Local Moran’s I test was also performed to validate the
Getis-Ord Gi* test and identify outliers within hot and cold spots. For both spatial analyses, the FDR parameter controlled for Type I error, fixed distance band set at at 42,977 meters ensured each participant had at least one neighbor, and Euclidean distance was the standardized distance
measurement parameter. In Local Moran’s I testing, row standardization was employed to control for spatial density of observations. Finally, secondary databases comprising population
geographical distributions of these factors aid understanding of results (SVI, USDA FA, USDA
FE).15,16 Geocoding and spatial analytics were carried out using ArcGIS Pro (v.2.1).
Results
The study’s analytical sample included 2,698 children, with equal proportions male and female
(Table 1a-b). Mean and median age was 54 months. The race/ethnicity most represented was African American (43%), which was double that of Non-Hispanic white (22%) and Hispanic (21%) race/ethnicities. Parent education level ranged from having completed some elementary
school to being a college graduate. Roughly one-third reported having a high school diploma or GED and over one-third experienced post-high school education (29% reported some technical
or community college and 14% reported college graduate or more). One-fifth of parents reported low educational attainment, completing some elementary school (6%) or some high school (15%) education.
Parent perceptions of self-OHS mostly mirrored their children’s OHS. Parent-reported self OHS
varied widely. Overall child OHS was reported as positive (84%), which ranged from good (31%) to very good (30%) to excellent (23%). Reported oral health behaviors focused on tooth brushing degree of supervision and daily frequency. Only 2 parents reported that their child’s
teeth were not brushed at home; the overwhelming majority reported either the child brushes on his/her own (37%), an adult helps (56%) or an adult brushes (7%). The majority of parents (93%)
day” are teeth brushed. One in four parents allowed their child to ever be put to bed with a bottle
containing something other than water. Close to three-fourths (70%) of parents reported child dietary intake of sugar-containing snacks and beverages between meals as two or more daily (5% consuming > 4).
Aim 1: Disease burden and associations
Over half of children (56%) presented with severe/established caries. One in five (22%) children were OWOB according to BMI percentile classification (13% overweight, 9% obese) (Table 2). There were no significant associations between children’s caries case status and anthropometry
regardless of BMI classification method (Table 2).
Tables 1a-b present bivariate analyses for caries outcome. Factors significantly associated with positive caries experience were race/ethnicity, parental education, parent-reported self and child OHS, and dietary intake behaviors: Hispanic race/ethnicity (P <0.0005), and lower parent
education level (P <0.0005) were associated with caries status. The proportion of children with caries increased with increasing frequency of daily between-meal sugar-containing snacks and
beverages (P <0.0005). Children’s caries cases were significantly associated with being put to bed with something other than water (P=0.003). Parent-reported self and child OHS each paralleled clinically-determined caries classification, with children of parents with “poor” and “fair” self OHS having being more likely to be caries cases than those with “very good” and “excellent” OHS. Parents perceived “poor” child OHS (92% were actual caries cases) and “fair”
good” child OHS and 29% “excellent” were actual caries cases. Factors that were not
significantly associated with caries were oral health-related hygiene behaviors.
In bivariate analysis for OWOB outcome (Table 3a-b) age (P<0.0001) and parent education level
(P=0.02) were the two factors significantly associated with OWOB (Table 3a-b). Older age and lower educational attainment were associated with a greater proportion of OWOB. Disparities
according to race/ethnicity were not present. Oral health-related behaviors were not significantly associated with OWOB.
Bivariate tests of association for the primary outcome, “comorbidity count” of caries and OWOB are presented in Table 4a-b. Two-thirds of children presented with caries, OWOB status, or both.
One in 8 children had the comorbidity of caries and OWOB. Significant factors associated with comorbidity were also significant for caries outcome independently. Older age (P <0.0005), Hispanic race/ethnicity (P <0.0005), and lower parent education level (P <0.0005) were
associated with comorbidity. The proportion of children with comorbidity increased by
increasing frequency of daily between-meal sugar-containing snacks and beverages (P <0.0005).
A higher proportion of children’s comorbidity was significantly associated with being put to bed with something other than water (P =0.003). Parent-reported self and child OHS were also significantly associated with comorbidity (1 or 2); “excellent” child and self OHS were
associated with higher proportional absence of comorbidity, and “poor” and “fair” child and self OHS were associated with higher proportional comorbidity (1 or 2). Oral hygiene-related
Aim 2: Geocoding and hot spot analysis
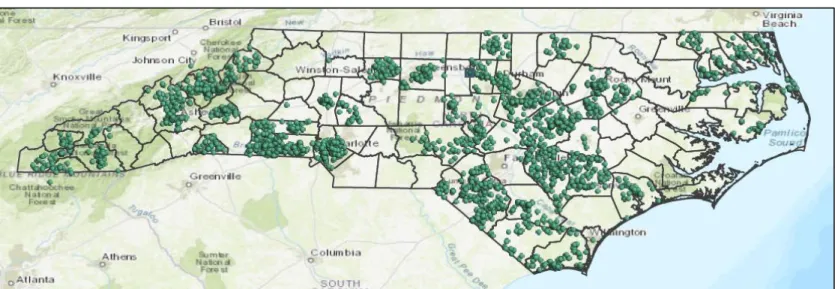
Geocoding results for all enrolled study participants, N=4,204, with both incomplete and complete anthropometric and clinical data in March of 2018 are presented in Figure 1. The prevalence map of comorbidity shows the geographical distribution of disease burden across the
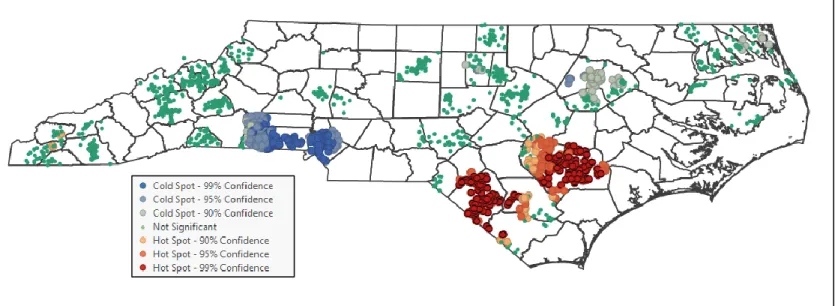
study sample (Figure 2). In spatial analyses, the Hot Spot Analysis (Getis-Ord Gi*) test generated hot and cold spots at the 95% confidence level. Significant clustering of high values
(deep red) defined a hot spot, and that of low values (deep blue) defined a cold spot (95% CI). This spatial analysis testing was performed for participants with complete data (N=2,567) for caries, OWOB, and comorbidity independently and is presented in Figures 3, 4, and 5,
respectively. Hot spots in southeast central North Carolina (Duplin, Sampson, Robeson county areas) and cold spots in southwest central North Carolina (Mecklenburg, Cleveland, and Gaston
county areas) found for caries mirrored those for comorbidity. For OWOB, no significant hot or cold spots within a 95% level of confidence emerged (Fig. 4). The Hot Spot and Outlier Analysis (Local Moran’s I) test for comorbidity paralleled the Getis-Ord Gi*testing results and further
identified the positive outliers in hot spots (individuals with healthy weight and no caries) and negative outliers in cold spots (OWOB individuals with caries).
The geocoded Social Vulnerability Index (SVI) overall theme encompassed socioeconomic, housing/transportation, and minority status/language aspects, serving as a geographic visual for
overall social determinants of health index for the purposes of this study (Appendix C).15 Quartiles of overall vulnerability were determined from low (lowest vulnerability) to high
Access Atlas database was geocoded to depict the geographical distribution of proportion of kids
living beyond 10 miles from supermarket by census tract, and number of households lacking a vehicle by census tract, both indicators of relative access to grocery stores (Appendix D-E).16 The USDA Food Environment Atlas database depicted the geographical distribution of degree of
change in convenience stores and fast food restaurants per 1,000 people, by county. This is informative regarding vendors associated with more processed, calorically dense food items, and
less fresh fruits, vegetables, and whole grain options (Appendix F-G).17
Discussion
Across this state-wide multi-ethnic community-based sample of preschoolers, there is an overwhelming burden of caries and OWOB. Two-thirds of children ages 3-6 years presented
with at least one of these important childhood conditions at the time of their examination. The overall disease presence early in life is alarming, as it is establishing an unfavorable lifetime health trajectory. Prevalence for moderate-to-advanced dental caries (56%) was higher than the
national average (23%) and that of a recent investigation of caries experience among North Carolina kindergartners (36%).1,18 OWOB was similar to the national prevalence recently reported.2 The two nutritionally driven disease processes (involving frequency and/or excess of refined carbohydrate intake) coupled with the current generalized obesogenic environment would logically lead to a stronger relationship between the two outcomes; perhaps the interaction is
attenuated in this sample given that participants have a similar food environment exposure for the majority of their days at preschool (in which both breakfast and lunch are provided). Our
Investigating the comorbidity outcome shifted focus to the common factors associated with developing both caries and OWOB in early childhood. One in 8 children had comorbidity (both severe/established caries and OWOB); the significant covariate associations were similar to
those for caries outcome and included age, race/ethnicity, oral-health-related dietary behaviors, parent education, and parent perception of self and child OHS. Age and parent education were
also significantly associated with OWOB alone. Interestingly, the number of sugar-containing snacks and beverages was significantly associated with comorbidity and caries, but not with OWOB alone. Literature has suggested sugar-sweetened beverage intake is a common risk factor
for both caries and OWOB, with soda tax being proposed as a solution to curb intake.19 Not to diminish the adverse health effects associated with excess sugar intake in beverages specifically,
as this may be a viable solution in some instances, the findings highlight the importance of considering the broader community food environment and agriculture system influences in order to successfully tailor community nutrition interventions for overall health promotion.
Educational attainment and its influence along the causal pathway of chronic disease
development is not fully understood as it is in constant interaction with other determinants. Results illustrated significantly higher proportions of caries, OWOB and comorbidity cases associated with parents of less formal education. A proposed mechanism by Muennig et al.
involves a pathway for educational attainment influencing health outcomes; cognition and knowledge dictate health literacy and behavioral risk factors somewhat independently of how one’s occupation and income determine one’s neighborhood/community and means to access
factors and social norms on attitudes and beliefs surrounding health and health behaviors
independently of education. Interestingly, the hot spot analysis for education generated hot spots for low educational attainment in the same areas as disease hot spots and cold spots for high educational attainment for health cold spots (Table 7). Perhaps the solution is two-fold in
communities for low educational attainment. First, promoting improvements in adult health literacy through programs like Women, Infants and Children (WIC) may mediate the relationship
between low educational attainment and child health outcomes.21,22 Second, investment in quality early education, like Head Start, could be a critical component for communities breaking the cycle of poor health outcomes. The Heckman equation has been used to demonstrate the
cost-effectiveness of this theory- investment in earlier developmental periods results in exponential societal return (Heckman equation).23 Public health interventions targeting a social determinant like education may also be more equitable in nature.24
Likewise, access to early healthcare prevention in the prenatal and infancy developmental
periods may reduce future burden of disease.25 The results support a link between caregiver and child oral health, finding that poorer caregiver-reported self OHS was positively associated with
parent oral health, the fact that parents reporting “very good” and “excellent” OHS tended to
have children without caries or comorbidity emphasizes the importance of parental oral health outcomes (and perhaps overall health outcomes) on those of their children. Prenatal health initiatives may be an important starting point for upstream oral health and overall health
prevention, given that some pregnant women of low socioeconomic status gain coverage through insurance they qualify for during pregnancy that they may not otherwise. Improvements in
prenatal and infant oral health and nutrition through interdisciplinary systems initiatives (i.e. WIC and medical-dental integration) and dietary guidelines focused on the prenatal and infancy periods may help mediate the development of chronic disease and establish positive health
trajectories in the first 1,000 days.
Education level and access to services for parents and children are determinants that are also related to income level. While income was not determined for participants, Head Start children qualify for enrollment based on family income relative to federal poverty level, therefore the
entire sample was of lower socioeconomic status by study design. Racial/ethnic disparities were evident in both caries alone and comorbidity outcomes, with a greater proportion of Hispanic
children having caries (66%) and comorbidity (16%) compared to African Americans (54% and 12%) and Non-Hispanic whites (53% and 12%). Racial/ethnic differences likely influence culture and social norms and though outside this study’s scope, may be important contributors to
community and neighborhood-level variation.
contributing factors among distinct geographic areas, i.e. counties census tracts, or
neighborhoods. The southwest central North Carolina cold spot for comorbidity may have be related to the urban-ness of these counties. Not coincidentally, this region happens to be at the forefront of utilizing GIS mapping to understand community needs; Carolinas HealthCare
system has already committed to addressing upstream social and economic factors that influence health in service are.29 The south-central North Carolina hot spot for comorbidity may be related to the rural-ness of this area and density of social vulnerability, including adverse food
environment attributes (Appendix D-G). Penney et al found similar trends in local cluster analysis of overweight and obesity. Canadian “cold spots” of community clustering tended to
occur in urban areas and “hot spots” in more rural areas.30 Areas with greater and lesser concentrated disease burden and their outliers have the potential for informing successful
interventions in similar communities, with care in accounting for rural and urban characteristics.
Strengths and Limitations
The strength of these findings lies in the large population-based sample and robust study design. A community-based sample affords adequate representation among those who have been
historically underrepresented in population-based studies. Because selection was determined irrespective of children’s clinical status or health care-seeking behavior, several common biases
(e.g., selection) were minimized. Given the large, multi-ethnic sample size and the wide
representation of NC counties, both urban and rural, these results are likely to have external validity. The study protocol adheres to systematic and universal measures for BMI categorization
Findings should be interpreted in context of limitations. The primary objective of the ZOE 2.0
study is a genome-wide association study of early childhood caries, therefore, primary data available for the specific research question were limited in scope. Recall bias is introduced in the collection of self-reported survey information. Study results should be interpreted with the
understanding that BMI percentiles are proxies for actual adiposity and body composition when developing weight categorizations; BMI may not accurately represent percent fat mass or
distribution which may partially account for the reasons the literature is inconclusive regarding relationship between adiposity and dental caries.31 Given that children qualifying for Head Start preschool qualify by family income in relation to the federal poverty line, some homogeneity
may be present, making it difficult to discern differences. In GIS spatial analytics, the variations in density of data (number of nearest neighbors) and categorization of data limited the type of
analytical testing with point data possible; similar testing may be more informative with use of continuous data.
Conclusion
As we continue to develop solutions to reduce chronic disease burden during childhood and
improve lifelong health trajectories, individual-level factors will always be important determinants. With highly prevalent diseases, greater depth of understanding of disease
clustering and community-level (even neighborhood-level) variation in upstream determinants
inform more targeted approaches tailored to community needs. Directions for future research include the qualitative investigation of significant outliers of hot spots and cold spots to better
areas, i.e. at the census tract level, could be informative for local boards of health and community
health needs assessments. The use of GIS methodology in this study enabled the translation of ‘scientific’ findings into digestible, visually compelling illustrations for the public health
problems and health disparities under study, that can be appreciated by a multitude of
stakeholders. These applications hold promise for local and state-level policy making in their ability to inform strategic investment of resources for health care interventions tailored to
Acknowledgements
References
1. Dye BA, Thornton-Evans G, Li X, Iafolla TJ. Dental caries and sealant prevalence in children and adolescents in the United States, 2011-2012. NCHS Data Brief.
2015(191):1-8.
2. Skinner AC, Ravanbakht SN, Skelton JA, Perrin EM, Armstrong SC. Prevalence of Obesity and Severe Obesity in US Children, 1999-2016. Pediatrics. 2018.
3. Chen D, Zhi Q, Zhou Y, Tao Y, Wu L, Lin H. Association between Dental Caries and BMI in Children: A Systematic Review and Meta-Analysis. Caries Res. 2018;52(3):230-245.
4. Hayden C, Bowler JO, Chambers S, et al. Obesity and dental caries in children: a systematic review and meta-analysis. Community Dent Oral Epidemiol. 2013;41(4):289-308.
5. Fisher-Owens SA, Soobader MJ, Gansky SA, et al. Geography matters: state-level variation in children's oral health care access and oral health status. Public Health. 2016;134:54-63.
6. Paisi M, Kay E, Kaimi I, et al. Obesity and caries in four-to-six year old English children: a cross-sectional study. BMC Public Health. 2018;18(1):267.
7. Casamassimo PS, Thikkurissy S, Edelstein BL, Maiorini E. Beyond the dmft: the human and economic cost of early childhood caries. J Am Dent Assoc. 2009;140(6):650-657. 8. Meyer BD, Lee JY, Casey MW. Dental Treatment and Expenditures Under General
Anesthesia Among Medicaid-Enrolled Children in North Carolina. Pediatr Dent. 2017;39(7):439-444.
9. Umer A, Kelley GA, Cottrell LE, Giacobbi P, Jr., Innes KE, Lilly CL. Childhood obesity and adult cardiovascular disease risk factors: a systematic review with meta-analysis. BMC Public Health. 2017;17(1):683.
10. Lee DC, Yi SS, Fong HF, et al. Identifying Local Hot Spots of Pediatric Chronic
Diseases Using Emergency Department Surveillance. Acad Pediatr. 2017;17(3):267-274. 11. Musa GJ, Chiang PH, Sylk T, et al. Use of GIS Mapping as a Public Health Tool-From
Cholera to Cancer. Health Serv Insights. 2013;6:111-116.
12. Watt RG, Sheiham A. Integrating the common risk factor approach into a social determinants framework. Community Dent Oral Epidemiol. 2012;40(4):289-296.
13. Ginnis J. FZA, Slade GD, Cantrell J, Antonio-Obese ME, Pahel BT, Meyer BD, Divaris K. Measurement of early childhood oral health for research purposes: dental caries experience and developmental defects of the enamel in the primary dentition. Methods Mol Biol.In Press.
14. NC Dept. of Information Technology GDAC, Center for Geographic Information and Analysis. North Carolina Master Address Dataset of 2014. In:2014.
15. Centers for Disease Control and Prevention/ Agency for Toxic Substances and Disease Registry/ Geospatial Research A, and Services Program. Social Vulnerability Index 2014 US Database. In.
16. Economic Research Service (ERS) USDoAU. Food Environment Atlas. 2015. 17. Economic Research Service (ERS) USDoAU. Food Access Research Atlas.
19. Frantsve-Hawley J, Bader JD, Welsh JA, Wright JT. A systematic review of the
association between consumption of sugar-containing beverages and excess weight gain among children under age 12. J Public Health Dent. 2017;77 Suppl 1:S43-S66.
20. Muennig PA. How Education Produces Health: A Hypothetical Framework. Columbia University Academic Commons. 2007.
21. Schillinger D, Barton LR, Karter AJ, Wang F, Adler N. Does literacy mediate the relationship between education and health outcomes? A study of a low-income population with diabetes. Public Health Rep. 2006;121(3):245-254.
22. Vann WF, Jr., Lee JY, Baker D, Divaris K. Oral health literacy among female caregivers: impact on oral health outcomes in early childhood. J Dent Res. 2010;89(12):1395-1400. 23. Heckman J. The Heckman Equation Brochure. 2013; www.heckmanequation.org.
Accessed October 21, 2017.
24. Cohen AK, Syme SL. Education: a missed opportunity for public health intervention. Am J Public Health. 2013;103(6):997-1001.
25. Nowak AJ, Casamassimo PS, Scott J, Moulton R. Do Early Dental Visits Reduce Treatment and Treatment Costs for Children? J Mich Dent Assoc. 2016;98(1):36-42. 26. Weintraub JA, Prakash P, Shain SG, Laccabue M, Gansky SA. Mothers' caries increases
odds of children's caries. J Dent Res. 2010;89(9):954-958.
27. Dye BA, Vargas CM, Lee JJ, Magder L, Tinanoff N. Assessing the relationship between children's oral health status and that of their mothers. J Am Dent Assoc. 2011;142(2):173-183.
28. Ersin NK, Eronat N, Cogulu D, Uzel A, Aksit S. Association of maternal-child
characteristics as a factor in early childhood caries and salivary bacterial counts. J Dent Child (Chic). 2006;73(2):105-111.
29. Cole AJ. Collaboration is Critical: Working Together to Optimize Health in Our Communities. N C Med J. 2017;78(4):255-257.
30. Penney TL, Rainham DG, Dummer TJ, Kirk SF. A spatial analysis of community level overweight and obesity. J Hum Nutr Diet. 2014;27 Suppl 2:65-74.
Tables
Table 1a. Children’s sociodemographic and oral health-related information and its association with children’s caries case status (binary; defined at the ICDAS≥3 level).
Entire sample
Caries non-case
Caries
case P value* n (col %) n (col %)
Total 2,698 (100) 1,176 (44) 1,522 (56)
Gender 0.2
boy 1,362 (50) 577 (42) 785 (58) girl 1,336 (50) 599 (45) 737 (55)
Age, months (mean, SD); median 54 (7); 54 53 (7); 53 54 (7); 55 <0.0005
Race/Ethnicity <0.0005
African American 1,132 (43) 519 (46) 613 (54) Non-Hispanic white 588 (22) 278 (47) 310 (53) Hispanic 551 (21) 186 (34) 365 (66) Multi-racial/other 367 (14) 163 (44) 204 (56)
Parent-reported child oral health status <0.0005 Poor 65 (2) 5 (8) 60 (92)
Fair 379 (14) 51 (13) 328 (87) Good 813 (31) 250 (31) 563 (69) Very good 780 (30) 423 (54) 357 (46) Excellent 601 (23) 427 (71) 174 (29)
Tooth brushing frequency 0.3
Sometimes, not every day 191 (7) 74 (39) 117 (61) Once a day 821 (31) 356 (43) 465 (57) Twice a day or more often 1,644 (62) 728 (44) 916 (56)
Child’s tooth brushing at home 0.8
Brushes his/her own teeth 979 (37) 415 (42) 564 (58) An adult helps 1,497 (56) 665 (44) 832 (56) An adult brushes 181 (7) 77 (43) 104 (57) Not brushed at home 2 (0.1) 1 (50) 1 (50) Number of daily between-meal
sugar-containing snacks and beverages
<0.0005 0-1 794 (30) 403 (51) 391 (49)
2-3 1,730 (65) 715 (41) 1,015 (59) 4 or more 133 (5) 41 (31) 92 (69) Child has ever been put to bed with
something other than water
0.003 yes 662 (25) 225 (39) 407 (61)
Table 1b. Parents’ sociodemographic and oral health-related information and its association with children’s caries case status (binary; defined at the ICDAS≥3 level).
Entire sample
Caries
non-case Caries case P value* n (col %) n (col %)
Total 2,698 (100) 1,176 (44) 1,522 (56)
Parent education level <0.0005
Some elementary 144 (6) 36 (25) 108 (75) Some high school 396 (15) 132 (33) 264 (67) High school diploma or GED 953 (37) 407 (43) 546 (57) Some technical or community college 746 (29) 367 (49) 379 (51) College graduate or more 362 (14) 191 (53) 171 (47)
Parent-reported own oral health status <0.0005
Table 2. Association between children’s anthropometry measures (underweight, healthy weight, overweight, obese) and their association with caries case status (binary; defined at the ICDAS≥3 level).
Entire sample Caries non-case Caries case P value* n (col n (col %) n (col %)
Total 2,698 (100) 1,176 (44) 1,522 (56)
Body mass index 7-level classification 0.5
Grade 3 thinness 41 (2) 21 (51) 20 (49) Grade 2 thinness 34 (1) 13 (38) 21 (62) Grade 1 thinness 196 (7) 95 (48) 101 (52)
Healthy weight 1,831 (68) 787 (43) 1,044 (57) Overweight 349 (13) 150 (43) 199 (57)
Obese 247 (9) 110 (45) 137 (55)
Body mass index 4-level classification 0.5
Underweight 271 (10) 129 (48) 142 (52) Healthy weight 1,831 (68) 787 (43) 1,044 (57)
Overweight 349 (13) 150 (43) 199 (57) Obese 247 (9) 110 (45) 137 (55)
Body mass index 3-level classification 0.9
Underweight/healthy weight 2,102 (78) 916 (44) 1,186 (56) Overweight 349 (13) 150 (43) 199 (57)
Obese 247 (9) 110 (45) 137 (55)
Body mass index binary classification 1.0
Table 3a. Children’s sociodemographic and oral health-related information and its association with children’s overweight/obese status (binary; healthy weight/underweight vs. overweight/obese).
Entire sample
Healthy/ underweight
Overweight/
obese P value* n (col %) n (col %)
Total 2,698 (100) 2,025 (78) 572 (20)
Gender 0.1
boy 1,362 (50) 1,078 (79) 284 (21) girl 1,336 (50) 1,024 (77) 312 (23)
Age, months (mean, SD); median 54 (7); 54 53 (7); 54 55 (7); 56 0.0001
Race/Ethnicity 0.2
African American 1,132 (43) 880 (78) 252 (22) Non-Hispanic white 588 (22) 462 (79) 126 (21) Hispanic 551 (21) 416 (76) 135 (24) Multi-racial/other 367 (14) 299 (81) 68 (19) Parent-reported child oral health
status
0.5 Poor 65 (2) 52 (80) 13 (20)
Fair 379 (14) 295 (78) 84 (22) Good 813 (31) 628 (77) 185 (23) Very good 780 (30) 594 (76) 186 (24) Excellent 601 (23) 483 (80) 118 (20)
Tooth brushing frequency 0.1
Sometimes, not every day 191 (7) 150 (79) 41 (21) Once a day 821 (31) 655 (80) 166 (20) Twice a day or more often 1,644 (62) 1,263 (77) 381 (23)
Child’s tooth brushing at home 0.7
Brushes his/her own teeth 979 (37) 755 (77) 224 (23) An adult helps 1,497 (56) 1,169 (78) 328 (22) An adult brushes 181 (7) 144 (80) 37 (20) Not brushed at home 2 (0.1) 2 (100) 0 (0) Number of daily between-meal
sugar-containing snacks and beverages
0.3
0-1 794 (30) 628 (79) 166 (21) 2-3 1,730 (65) 1,340 (77) 390 (23) 4 or more 133 (5) 101 (76) 32 (24) Child has even been put to bed with
something other than water
0.1 yes 662 (25) 500 (76) 162 (24)
Table 3b. Parents’ sociodemographic and oral health-related information and its association with children’s overweight/obese status (binary; healthy weight/underweight vs. overweight/obese).
Entire sample
Healthy/ underweight
Overweight/
obese P value* n (col %) n (col %)
Total 2,698 (100) 2,025 (78) 572 (20)
Parent education level 0.02
Some elementary 144 (6) 103 (72) 41 (28) Some high school 396 (15) 294 (74) 102 (26) High school diploma or GED 953 (37) 750 (79) 203 (21) Some technical or community college 746 (29) 594 (80) 152 (20) College graduate or more 362 (14) 286 (79) 76 (21) Parent-reported own oral health
status
0.1 Poor 224 (9) 162 (72) 62 (28)
Table 4a. Children’s sociodemographic and oral health-related information and its association with children’s “comorbidity count” (defined as joint existence of dental caries and overweight/obesity: 0, not caries case and
healthy weight or underweight; 1, caries case or overweight/obese; 2 caries case and overweight/obese). Entire sample Comorbidity count: 0 Comorbidity count: 1 Comorbidity
count: 2 P value* n (col %) n (col %) n (col %)
Total 2,698 (100) 916 (34) 1,446 (54) 336 (12)
Gender 0.5
boy 1,362 (50) 455 (33) 745 (55) 162 (12) girl 1,336 (50) 461 (35) 701 (52) 174 (13)
Age, months (mean, SD); median 54 (7); 54 53 (7); 53 54 (7); 54 56 (7); 56 <0.0005
Race/Ethnicity <0.0005
African American 1,132 (43) 400 (35) 599 (53) 133 (12) Non-Hispanic white 588 (22) 222 (38) 296 (50) 70 (12)
Hispanic 551 (21) 138 (25) 326 (59) 87 (16) Multi-racial/other 367 (14) 135 (37) 192 (52) 40 (11) Parent-reported child oral health
status
<0.0005 Poor 65 (2) 4 (6) 49 (75) 12 (18)
Fair 379 (14) 39 (10) 268 (71) 72 (19) Good 813 (31) 193 (24) 492 (61) 128 (16) Very good 780 (30) 316 (41) 385 (49) 79 (10)
Excellent 601 (23) 349 (58) 212 (25) 40 (7)
Tooth brushing frequency 0.9
Sometimes, not every day 191 (7) 56 (29) 112 (59) 23 (12) Once a day 821 (31) 288 (35) 435 (53) 98 (12) Twice a day or more often 1,644 (62) 558 (34) 875 (53) 211 (13)
Child’s tooth brushing at home 0.8
Brushes his/her own teeth 979 (37) 315 (32) 540 (55) 124 (13) An adult helps 1,497 (56) 521 (35) 792 (53) 184 (12) An adult brushes 181 (7) 65 (36) 91 (50) 25 (14) Not brushed at home 2 (0.1) 1 (50) 1 (50) 0 (0) Number of daily between-meal
sugar-containing snacks and beverages
<0.0005
0-1 794 (30) 321 (40) 389 (49) 84 (11) 2-3 1,730 (65) 553 (32) 949 (55) 228 (13) 4 or more 133 (5) 29 (22) 84 (63) 29 (22) Child has even been put to bed
with something other than water
0.003 yes 662 (25) 195 (29) 365 (55) 102 (15)
Table 4b. Parents’ sociodemographic and oral health-related information and its association with children’s “comorbidity count” (defined as joint existence of dental caries and overweight/obesity: 0, not caries case and healthy weight or underweight; 1, caries case or overweight/obese; 2 caries case
and overweight/obese).
Entire sample Comorbidity count: 0 Comorbidity count: 1 Comorbidity
count: 2 P value* n (col %) n (col %) n (col %)
Total 2,698 (100) 916 (34) 1,446 (54) 336 (12)
Parent education level <0.0005
Some elementary 144 (6) 27 (19) 85 (59) 32 (22) Some high school 396 (15) 94 (24) 238 (60) 64 (16) High school diploma or GED 953 (37) 322 (34) 513 (54) 118 (12)
Some technical or community college
746 (29) 296 (40) 369 (49) 81 (11) College graduate or more 362 (14) 145 (40) 187 (52) 30 (8) Parent-reported own oral
health status
<0.0005 Poor 224 (9) 62 (28) 116 (52) 46 (21)
Fair 619 (24) 181 (29) 349 (56) 89 (14) Good 974 (37) 294 (30) 557 (57) 123 (13) Very good 531 (20) 223 (42) 263 (50) 45 (8)
Figures
Figure 1. Geocoded study participants, N=4204
Figure 2. Comorbidity prevalence, N=2567
Figure 3. Getis-Ord-Gi* Hot Spot Analysis for Caries, N=2567
Figure 5. Getis-Ord-Gi* Hot Spot Analysis for Comorbidity, N=2567
Appendix
A. Fisher-Owen Conceptual Model for Oral Health in Childhood
‘
C. North Carolina Overall Social Vulnerability Index (SVI) (socioeconomic,
housing/transportation, minority status/language composite score) population estimates, 2014
D. USDA Food Access Atlas, Proportion of kids living beyond 10 miles from supermarket, by census tract, 2015
Quartile 1 (lowest vulnerability) Quartile 2
Quartile 3
Quartile 4 (highest vulnerability)
Quartile 1 (lowest proportion) Quartile 2
Quartile 3
E. USDA Food Access Atlas, number of households lacking a vehicle, by census tract, 2015
F. USDA Food Environment Atlas, Change in number of convenience stores per 1,000 by county, 2015
Quartile 1 (lowest vulnerability) Quartile 2
Quartile 3
Quartile 4 (highest vulnerability) Quartile 1 (lowest number) Quartile 2
Quartile 3
Quartile 4 (highest number)
Quartile 1 (highest negative change) Quartile 2 (negative change)
Quartile 3 (positive change)
G. USDA Food Environment Atlas, Change in number of fast food restaurants per 1,000 people, by county, 2015
Quartile 1 (highest negative change) Quartile 2 (negative change)
Quartile 3 (positive change)