INTRODUCTION
In the United States, childhood obesity remains a serious problem. According to the Centers
for Disease Control and Prevention, approximately 17% of children ages 2-17 are obese.
Among school-aged children in 2011-2012, the prevalence of obesity was 17.7% of 6- to
11-year-olds and 20.5% of 12- to 19-year-olds.1 Other countries are also struggling with
the childhood obesity epidemic. The 2013 Health Survey for England found that 12.4% of
2- to 10-year-olds and 19.9% of 11- to 15-year-olds are obese.2 In South Korea, the overall
childhood obesity rate was 9.7% in 2011 based on data from the Korean National Health
and Nutrition Examination Survey. In 2005, the prevalence of obesity among Korean
children was 8.6% in 7- to 12-year-olds, 14.8% in 13- to 15-year-olds, and 17.5% in 16- to
18-year-olds.3
Being obese early in life can have negative consequences on a child’s well-being,
both physical and psychosocial. In the long-term, obese children are at greater risk for
chronic diseases such as type 2 diabetes and heart disease.4 Poor dietary intake is closely
associated with obesity, and since children consume an average of 35% of their daily
calories at school, schools are a logical food environment to target with policies and
environmental changes to improve dietary intake among children.4,5,6 Furthermore,
research has shown that school food environments and policies can have a positive impact
on the overall quality of children’s diets, beyond the foods eaten in schools.7 In addition,
dietary preferences developed during childhood are a strong predictor of food preferences
in adulthood and can impact dietary choices later in life.14
This purpose of this paper is to explore the association between school lunch
compare those findings with results from the United Kingdom and South Korea. When
assessing the impact of school lunch participation on health, there are several different
measures that can be used to evaluate health impact. These include BMI, weight, adiposity,
dietary intake, prevalence/incidence of obesity or other chronic disease, self-reported
health status, and life expectancy. Examining total dietary intake as an outcome of interest
is advantageous when focusing on the nutritional quality and adequacy of a population’s
diet. However, factors such as physical activity, socioeconomic status, food
availability/accessibility, stress, and cultural norms can affect total dietary intake.8,9,10
Since the primary objective and direct effect of school meal programs is to impact a
student’s dietary intake, this paper focuses on total dietary intake as the outcome of
interest.
In the United States and other countries, the school food environment can also
include school breakfast, after school meals, summer meals, competitive foods, and
nutrition education. The scope of this paper is limited to school lunch to allow for more
equivalent comparisons between countries and to simplify the complex school food
environment.
There are different ways to quantify total dietary intake, including using indices of
diet quality, food group consumption frequency, and estimated nutrient intake. For the
sake of comparison, this paper focuses on studies that examined estimated nutrient intake.
One advantage of looking at nutrient intake over food groups is the ability to identify
specific nutrients of interest that may be especially significant to the health of school-aged
children. Additionally, for cross-country comparisons, differences in food cultures may
nutrients is that it fails to capture overall diet quality as well as the potential importance of
certain food groups. Consequently, comparisons on diet quality based on indices are also
included when there are existing studies that include such measures.
The United Kingdom and South Korea were chosen to be comparison countries
because they are also developed countries, have relatively similar school lunch
environments, and have also recently updated their school lunch standards as described in
the next section. While there are also many differences across these countries, these
similarities allow the United Kingdom and South Korea to serve as reasonable countries for
comparison.
SCHOOL LUNCH PROGRAMS BY COUNTRY
This section provides an overview of the school lunch programs in each country, with an
emphasis on participation rates, prices, and standards. Understanding the overall
participation rates in each country is important for establishing the amount of students
that could potentially be reached by school lunch. Participation rates are influenced by
prices, thus a discussion of average school lunch prices provides context for participation
rates. Lastly, school lunch standards influence the foods served to students and
subsequently their dietary intake.
United States
The National School Lunch Program (NSLP) in the United States began in 1946 during the
administration of President Harry Truman. As it exists today, the NSLP is a federally
residential child care institutions. It also provides reimbursement for snacks provided to
children up to 18 years of age in afterschool education or enrichment programs.11
Participation rates for all lunch categories have remained fairly steady over the past
25 years, at about 60% (Figure 1). Recently, however, the number of paid participants and
reduced-price participants has fallen. According to the USDA Economic Research Service,
the proportion of children who paid full price for lunch has fallen from 40% in 2008 to 28%
in 2014.12 The authors identify three contributing factors to the decline in paid lunches: (1)
an increase in the number of students eligible for free and reduced-price lunches following
the 2007-2009 recession, (2) revamped school lunch standards under the Healthy,
Hunger-free Kids Act of 2010 that required healthier offerings and may have initially been poorly
accepted by students, and (3) higher lunch prices.12
The prices of school meals vary greatly across the United States and are set by local
school districts. Table 1 shows the average prices of school meals during the 2013-2014
school year, with lunch prices ranging from $2.18 in elementary schools to $2.42 in high
schools. These prices reflect increases that began in 2011 as a result of the Paid Lunch
Equity provision, which requires schools to cover the difference between reimbursement
rates for free and paid lunch through revenues from paid lunch or non-Federal sources
instead of Federal NSLP subsidies. As a result, many districts raised the price of lunch to
generate additional revenue.12
The Healthy, Hunger-Free Kids Act of 2010 (HHFKA) updated the NSLP nutrition
standards to better align with the 2010 Dietary Guidelines for Americans amid growing
concerns over the childhood obesity epidemic. Figure 2 presents a summary of the
the current requirements increase the availability of fruit, vegetable, and whole grain
offerings, sets calorie limits, restricts trans fat, and sets gradual sodium reduction targets.
United Kingdom
School meals have a much longer history in the United Kingdom compared to the United
States, as they first began in the mid-19th century.16 Like the United States, schools in the
United Kingdom provide hot or cold lunches (often referred to in the UK as school dinners),
but children are free to bring packed lunches and some may even go home for lunch.17 In
the 2013-2014 school year, 97% of schools offered a hot meal and the average
participation rate in was 42.6%.18 The 2013-2014 school year participation rate for paid
lunches was 35.5% and 75.1% for free lunches; these figures are similar to those of the
United States.18
The average price of a school lunch during the 2013-2014 school year was £2.04
(ranging from £1 to £3), according to a report published by the United Kingdom
Department for Education.18 Using the 2013 United Kingdom purchasing power parity
(PPP) factor from the Organisation for Economic Co-operation and Development (OECD),
the equivalent average price in US dollars is $2.92.34 In addition to varying by region,
school lunch prices in the United Kingdom also vary by proportion of students eligible for
free school meals (Table 2).
School food standards were first introduced in the United Kingdom in 1941 under a
National School Meals policy that set national standards for protein, fat, and calorie
provision in school meals.16 The standards have been updated many times since then,
Margaret Thatcher, the United Kingdom passed an Education Act which no longer required
schools to offer school meals (except for students entitled to free school meals) and
eliminated nutritional standards.16 Minimum nutrition standards were reintroduced in
2001; these standards were food-based standards that provided guidance on how many
servings from each food group to provide, but did not address specific nutrient
provisions.16
In early 2005, British chef Jamie Oliver was featured in a television documentary
series called “Jamie’s School Dinners,” which showed his efforts to reform the meals at a
secondary school in London.19 The series generated a great deal of public interest and
concern regarding the nutritional quality of school meals in the UK, and also attracted
government attention.19 In response to these concerns, the government organized a
national School Meals Review panel and established the School Food Trust (renamed in
2012 to the Children’s Food Trust).19 New standards, both food-based and nutrient-based,
were passed in 2006 and went into effect beginning in 2008.19
The standards were again updated in 2014, in an effort to address feedback that the
2006 standards were too complicated and expensive to implement.20 This update modified
the food-based standards while retaining the existing nutrient-based standards as a
framework.21 The current nutrient-based standards are shown in Table 3, and a
comparison of the previous and current food-based standards are shown in Table 4. The
new school meal standards increase the availability and variety of fruit and vegetable
offerings, starchy foods, whole grains, protein (including non-dairy sources of protein for
vegetarians), and low-fat milk and dairy. The standards also restrict foods that are high in
January 2015 and are mandatory for schools established before 2010 and after 2014.20 For
state-funded schools established between 2010 and 2014, the new standards are voluntary
because they were not part of their original funding agreements.20
South Korea
The provision of school meals first began in South Korea in 1953 following the Korean War,
and in 1981 the School Meals Act was passed, which created the modern school lunch
program.23 The program has grown dramatically over the past two decades (Figure 3): in
1991 the percent of schools serving lunch was 13.3%; in 2001 that figure had risen to
91.9% and by 2010, 99.9% of schools were providing school lunch.23 Furthermore, the
percentage of students who participate in school lunch is also very high: 98.8%23, more
than double the participation rate in the United Kingdom and roughly 1.6 times the
participation rate in the United States.
In 2010, the average price of a school lunch in elementary schools was 1,900 KRW
($1.76), and 2,700 KRW ($2.50) in secondary schools.23 Based on the 2010 OECD PPP
factor for Korea, the equivalent prices in US dollars are $2.26 and $3.21.34 In the capital city
of Seoul, school lunches are currently provided at no cost to all students regardless of
household income.24 This program has been politically controversial, and the city’s
previous mayor resigned in 2011 after voters rejected his proposal to limit free school
meals to low-income children in a city-wide referendum.24
Table 5 shows the nutritional standards for school lunches in South Korea. These
standards were established in January 2007 by the Enforcement Rules of School Meals Act
Intakes for Koreans.23 The standards vary by gender and age group and allow a range of
±10% for energy (calories).23 They also include recommend ranges for energy from
carbohydrates (55-70%), protein (7-20%), and fat (15-30%).23 In addition, school lunches
should provide at least the Estimated Average Requirement (EAR) of the micronutrients,
and ideally more than the Recommended Intake (RI).23 Finally, the standards also
emphasize a traditional diet, variety in types of foods and cooking methods, sparing use of
oils, fats, simple sugar, and food additives, and the use of natural and seasonal foods as
much as possible.23
Summary of school lunch program characteristics across US, UK and South Korea
Tables 6 and 7 provide a summary of school lunch program characteristics across the
United States, the United Kingdom, and South Korea. South Korea appears to have the
highest participation rate at 98.8%, while the United Kingdom has the lowest participation
rate at 42.6% and the highest average price at $3.08 USD. The United States has the lowest
average price at $2.32 and falls in between South Korea and the United Kingdom with a
60% participation rate.
In terms of school lunch standards, the United Kingdom has more comprehensive
nutrient standards than the United States and South Korea. The United States currently
does not have nutrient standards for protein or iron, whereas South Korea does not have
nutrient standards for saturated fat or sodium. All three countries provide guidelines for
energy provision, and the range of values across countries show some overlap; however, it
should be noted that the United Kingdom provides a much narrower range of values for
Korea are slightly higher than the requirements in the United Kingdom, while the minimum
iron requirements in South Korea are lower than those in the United Kingdom. Finally, the
United States has set a target for maximum sodium of 740 mg by 2022, which is still higher
than the current standards in the United Kingdom (499 mg for primary school students,
714 mg for secondary school students).
METHODS
For this narrative review, a literature search was conducted in September 2015 using
computerized databases from the University of North Carolina library system and Google
Scholar. The search terms included “school lunch”, “school meals”, and “school food”. The
initial date range was from 2010 (corresponding to the passage of the Healthy,
Hunger-Free Kids Act) to September 2015. This initial date range was expanded to 2008 in order to
include a greater number of articles.
To be included, articles were published in English and examined the total dietary
intake of school lunch participants and non-participants in the United States, the United
Kingdom, or South Korea. Articles were excluded if they were written in languages other
than English, did not compare dietary intakes of school lunch participants and
non-participants, did not include data from the United States, the United Kingdom, or South
Korea, non-peer reviewed, or dissertations. Included in the review are four articles from
the United States, four from the United Kingdom, and two from South Korea.
Association Between School Lunch Participation and Total Dietary Intake: Key
Findings by Country
United States
Diet quality can be measured using a variety of methods, one of which is the Healthy Eating
Index-2005 (HEI-2005). As shown in Table 8, the HEI-2005 is comprised of 12 component
scores: eight which measure consumption of food groups and subgroups, and four which
measure the consumption of oils, saturated fat, sodium, and calories from solid fats,
alcoholic beverages, and added sugar (SoFAAS). Higher consumptions of the latter four
result in lower scores. Thus, a higher HEI-2005 score suggests a healthier eating pattern.26
The overall diet quality of school-age children in the United States is poor, as evidenced by
the average HEI-2005 score of 55 out of a possible 100 points26, 53.6 for weekdays, and 48
for weekends27. The low average HEI-2005 scores of school-age children suggest that their
usual diets fall short of recommendations.26,27
The majority of children attending US public schools have adequate usual intakes of
most vitamins and minerals; however, their intakes of saturated fat and sodium exceed the
Dietary Reference Intakes and 2005 Dietary Guidelines.25,26 Participation in the school
lunch program is associated with an increased likelihood of adequate vitamin and mineral
intake, but also with increased likelihood of excessive sodium intake25,27 and saturated fat
intake.27,28
High school students are of particular concern for meeting nutrition needs because
relative to younger children, high school students are more likely to have excessive intakes
Adolescent girls may be at the greatest risk for inadequate intakes of vitamins and
minerals.25,26
The effect of school lunch participation on total dietary intake may differ by family
income: low-income participants had a higher overall diet quality compared to low-income
non-participants, while high income participants’ overall diet quality did not differ from
high income non-participants.27
United Kingdom
None of the studies from the United Kingdom examined diet quality in terms of an index.
Since the implementation of the 2006 food and nutrient-based standards, the average daily
intake of calcium, vitamin C, iron, zinc, vitamin A, and folate in primary school children
increased; however, mean intake of calcium, iron, zinc, and vitamin A remain below the
minimum standard.19 The average intake of saturated fat, non-milk extrinsic sugars, and
sodium has decreased in UK primary school children (ages 4-7) post-implementation;
however, intake of these nutrients remains above the Dietary Reference Values.19
Among primary school children (age 9-10), school lunches on average met the
School Food Trust food-based standards, while packed lunches were less healthy.29 Among
UK adolescents (age 14-15), both school lunches and packed lunches did not provide
sufficient energy and nutrient intakes as compared to the recommendations made by the
Caroline Walker Trust30. Packed lunches of adolescent girls, in particular, contributed less
nutrients to their daily total intake compared to school lunches.30
There were no significant differences in overall nutrient intake between school
income households, despite significant differences in nutrient provision of school lunches
compared to packed lunches.30,31
South Korea
Again, none of the studies from South Korea examined diet quality in terms of an index.
School lunches met the minimum standards for all nutrients; however, compared to US
school lunches, Korean school lunches were lower in calcium, iron, and vitamin A.32
However, the nutrient provision from school lunch was inconsistent within a small sample
of elementary schools (n=3) in Bucheon, South Korea.32
Among middle school students in Incheon, South Korea, total daily intake of energy
and most micronutrients was significantly lower in school lunch participants compared to
non-participants.33 A study of elementary students from low-income families in rural South
Korea also found that school lunch participants had lower average nutrient intakes and
nutrient adequacy ratios.34
Association Between School Lunch Participation and Total Dietary Intake of Select
Nutrients
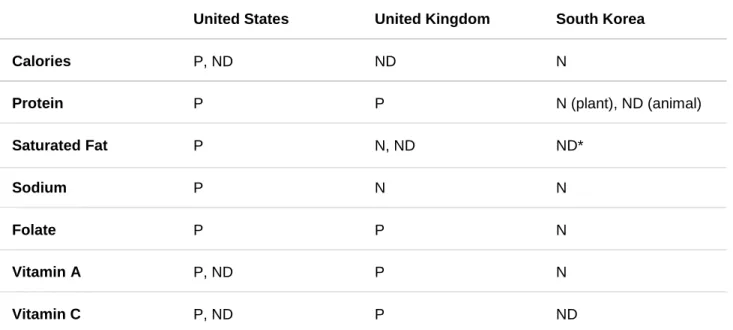
Table 9 presents a summary of the following findings:
Calories
The results are inconsistent, even within the same country. While some studies found no
differences between calorie intake in school lunch participants and non-participants,27,29,31
non-participants25,28 and one study of middle school students in South Korea found that school
lunch participants consumed fewer calories than non-participants.33
Protein
Studies from the United States and United Kingdom found that school lunch participants
consumed more protein than non-participants.28,29,19 In contrast, a study from South Korea
found that school lunch participants consumed less plant protein than non-participants,
while the differences in animal protein consumption were not significant.33
Saturated Fat
Studies from the United States found that school lunch participants had higher saturated
fat intakes28 and worse Healthy Index Scores for saturated fat (which can be interpreted to
correspond to higher saturated fat intake) compared to non-participants.27 In the United
Kingdom results were mixed, as one study found that school lunch participants consumed
less saturated fat than non-participants19 while another found no difference in saturated fat
intake between participants and non-participants.31 The study from South Korea did not
specifically measure saturated fat, however it did not find a significant difference in animal
fat consumption between school lunch participants and non-participants.33
Sodium
In the United States, school lunch participants consume more sodium than
non-participants.25,28 In the United Kingdom and South Korea, studies found that school lunch
participants consumed less sodium than non-participants.19,33
Folate
One study from the United States found that school lunch participants are less likely to
school students.25 A study from the United Kingdom found that school lunch participants
consumed more folate than non-participants.19 In South Korea, by contrast, a study found
that school lunch participants consumed less folate compared to non-participants.33
Vitamin A
Results from studies from the United States were mixed, with one study finding that middle
and high school students who participated in school meals were less likely to have
inadequate intakes of vitamin A compared to non-participants,25 while another did not find
a significant difference in vitamin A intake between participants and non-participants.28 In
the United Kingdom school lunch participants consumed more vitamin A compared to
non-participants,19 while in South Korea a study found the reverse.33
Vitamin C
Studies from the United States had mixed results. One study found that school lunch
participants in middle and high school were less likely to have inadequate intakes of
vitamin C compared to non-participants,25 while another did not find a significant
difference in vitamin C intake between participants and non-participants.28 In the United
Kingdom, school lunch participants consumed more vitamin C compared to
non-participants.19 In South Korea, there was no significant difference.33
DISCUSSION
This paper investigates the associations between school lunch participation and total
dietary intake in children from the United States, the United Kingdom, and South Korea.
The associations varied by country and sometimes even within the same country; however,
Results from both the United States and the United Kingdom suggest that the overall
intake of saturated fat and sodium in school-age children exceed the recommended
amounts. Furthermore, studies from the United States suggest that school lunch
participation is associated with higher intakes of saturated fat and sodium.25,27,28 These
findings are concerning since excess saturated fat and sodium intake are thought to have
negative effects on an individual’s health. It should be noted that these studies used data
collected before the most recent nutritional standards update in both countries. Future
studies will need to examine whether or not these updates to school meal standards have
the intended effect of lowering saturated fat and sodium intakes in school-age children.
In the United States and the United Kingdom, adolescents seem to be at greater risk
for inadequate nutrient intake compared to other age groups. Among high school students
in the United States, the prevalence of inadequate intake was greater than 15% for vitamin
A, vitamin C, vitamin E, and magnesium.25 For adolescent girls, the prevalence of
inadequate intake exceeded 15% for these nutrients plus vitamin B6, folate, thiamine, iron,
phosphorus, and zinc.25 In the United Kingdom, the majority of school lunches and packed
lunches of 14- to 15-year-olds did not provide sufficient amounts of folate, calcium, or iron;
however, this study did not look at the adequacy of overall intake.30 In the same study, a
greater proportion of girls than boys who ate school lunches did not meet the
recommendations for iron and folate and packed lunches of girls were more likely than
packed lunches of boys to be deficient in vitamin C.30
Further research is needed to understand why adolescents seem to have poorer
diets compared to other age groups. Is it related to taste preferences, peer effects, or
Moreover, because the studies mentioned in this paper used dietary recall to estimate
nutrient intake, it seems reasonable to question if the greater dietary inadequacies
measured among adolescent girls are due to true deficiencies or underreporting of food
intake as a result of social desirability bias.
There were also some interesting differences between countries. Students from
low-income families in the United States who participated in school lunch had a higher overall
diet quality compared to low-income non-participants.27 In contrast, there were no
significant differences in overall nutrient intake between school lunch participants and
non-participants observed in students from low-income households in the United
Kingdom.31 One possible explanation for this difference is that the packed lunches of
low-income students in the United Kingdom are healthier than those of low-low-income students in
the United States. Another explanation might be that the quality of meals eaten away from
school among income students in the United Kingdom is higher than those among
low-income students in the United States, so that school lunch participation has a greater
impact on total dietary intake for low-income students in the United States. Lastly, one
must consider that school lunch participants and non-participants may differ
fundamentally in ways that were not captured by these studies.
The findings from South Korea seem to suggest that school meal participants
consume fewer nutrients than non-participants. For all of the nutrients examined in this
paper, South Korean participants either had lower intakes than non-participants or there
was no significant difference in intakes. It is important to note that these conclusions are
based on the results from a single study of 491 middle school students in Incheon, South
compare the intakes to the DRIs for Koreans or use other methods to evaluate the adequacy
of the nutrient intakes. If the intakes for both groups met minimum recommendations, then
the comparison of school lunch participants to non-participants seems less relevant.
This paper does have limitations. First, only a few studies from each country were
reviewed. The intent was to use recently published studies to approximate the current
situation in each country given recent school nutrition standards, thus papers from before
2008 were not considered. Studies from South Korea were particularly difficult to find, and
much of the analysis presented in this paper is based on a single South Korean study.
Second, because there is often a lag between policy implementation, data collection, and
research publication, some of these studies used dietary intake data from as far back as
2003, before the most recent or even the second most recent nutrition standards went into
effect. Third, this paper presents studies that used 24-hour dietary recall data as their
method of approximating dietary intake, and did not examine actual amounts consumed
(i.e., plate waste studies). This may introduce certain recall or response biases into the
results. Lastly, there are many more factors in a child’s food environment that could affect
total dietary intake besides school lunch participation, which were not addressed in this
paper. These factors include nutrition education, individual beliefs and attitudes, foods
eaten at home or away from school, the availability of competitive foods at school, and level
of physical activity.
Conclusion
Further research is needed to assess the effects of the new nutrition standards that have
adolescent diets, with an emphasis on adolescent girls, and potential differences between
participants and non-participants from low-income families.
There is still work to be done to improve the overall diets of school-age children in
the United States, the United Kingdom, and South Korea. While school lunch is a promising
and logical setting to impact child nutrition, it cannot shoulder the burden of childhood
obesity prevention alone. Additional policies targeting food environments and emphasizing
nutrition education are needed.
Acknowledgments
I would like to thank to Dr. Shu Wen Ng for her invaluable guidance and comments. This
References
1. Childhood Obesity Facts. Centers for Disease Control and Prevention. 2015. Available at: http://www.cdc.gov/obesity/data/childhood.html. Accessed 2015.
2. Health Survey for England - 2013, Trend tables. Health and Social Care Information Centre. 2014. Available at:
http://www.hscic.gov.uk/searchcatalogue?productid=16572&returnid=3945. Accessed 2015. 3. Lee HA, Park H. Overview of Noncommunicable Diseases in Korean Children and Adolescents:
Focus on Obesity and Its Effect on Metabolic Syndrome. J Prev Med Public Heal. 2013;46(4):173-182. doi:10.3961/jpmph.2013.46.4.173.
4. Briefel RR, Crepinsek MK, Cabili C, Wilson A, Gleason PM. School Food Environments and Practices Affect Dietary Behaviors of US Public School Children. J Am Diet Assoc.
2009;109(2):S91-S107. doi:10.1016/j.jada.2008.10.059.
5. Hawkes C, Jewell J, Allen K. A food policy package for healthy diets and the prevention of obesity and diet-related non-communicable diseases: the NOURISHING framework. Obes Rev.
2013;14(November):159-168. doi:10.1111/obr.12098.
6. Wechsler H, McKenna M, Lee S, Dietz W. The Role of Schools in Preventing Childhood Obesity. Centers for Disease Control and Prevention. 2004. Available at:
http://www.cdc.gov/healthyyouth/physicalactivity/pdf/roleofschools_obesity.pdf. Accessed 2015.
7. Briefel RR, Crepinsek MK, Cabili C, et al. School food environments and practices affect dietary behaviors of US public school children. J Am Diet Assoc. 2009;109:S91–S107.
8. Melzer K, Kayser B, Saris W, Pichard C. (2005). Effects of physical activity on food intake. Clinical Nutrition,24(6), 885-895.
9. Westerterp, K. (2010). Physical activity, food intake, and body weight regulation: Insights from doubly labeled water studies. Nutrition Reviews,68(3), 148-154.
doi:10.1111/j.1753-4887.2010.00270.x
10.The Determinants of Food Choice. European Food Information Council. 2005. Available at: http://www.eufic.org/article/en/expid/review-food-choice/. Accessed 2015.
11.National School Lunch Program (NSLP). United States Department of Agriculture Food and Nutrition Service. 2015. Available at: http://www.fns.usda.gov/nslp/national-school-lunch-program-nslp. Accessed 2015.
12.Ralston K, Newman C. A Look at What's Driving Lower Purchases of School Lunches. United States Department of Agriculture Economic Research Service. 2015. Available at:
http://www.ers.usda.gov/amber-waves/2015-october/a-look-at-what’s-driving-lower-purchases-of-school-lunches.aspx#.vj-0qq6rre7. Accessed 2015.
13.School Meal Trends & Stats. School Nutrition Association. Available at:
https://schoolnutrition.org/aboutschoolmeals/schoolmealtrendsstats/. Accessed 2015. 14.Venter C, Harris G. (2009). The Development Of Childhood Dietary Preferences And Their
15.School Lunch: Implementing Nutrition Changes Was Challenging and Clarification of Oversight Requirements Is Needed. United States Government Accountability Office. 2014. Available at: http://www.gao.gov/assets/670/660427.pdf. Accessed 2015.
16.Evans C, Harper C. (2009). A History And Review Of School Meal Standards In The UK. Journal of Human Nutrition and Dietetics, 22(2), 89-99. doi:10.1111/j.1365-277X.2008.00941.x
17.School dinners. British Council. Available at: http://learnenglishteens.britishcouncil.org/uk-now/read-uk/school-dinners. Accessed 2015.
18.School lunch take-up survey 2013 to 2014. United Kingdom Department for Education. 2015. Available at: https://www.gov.uk/government/uploads/system/uploads/attachment_data/ file/395189/rr405_-_school_lunch_take-up_survey_2013_to_2014.pdf. Accessed 2015. 19.Spence S, Delve J, Stamp E, Matthews JNS, White M, Adamson AJ. The Impact of Food and
Nutrient-Based Standards on Primary School Children's Lunch and Total Dietary Intake: A Natural Experimental Evaluation of Government Policy in England. PLoS ONE. 2013;8(10). doi:10.1371/journal.pone.0078298.
20.New school food standards. United Kingdom Department for Education. 2014. Available at: https://www.gov.uk/government/news/new-school-food-standards. Accessed 2015. 21.Development and pilot testing of revised food-based standards for school lunches in England.
Children's Food Trust. 2013. Available at:
http://www.schoolfoodplan.com/wp-content/uploads/2014/02/school-food-plan-pilot-study-evaluation-report-final-v3.pdf. Accessed 2015.
22.School food standards: A practical guide for schools their cooks and caterers. Children's Food Trust. 2015. Available at:
http://www.schoolfoodplan.com/wp-content/uploads/2015/01/school-food-standards-guidance-final-v3.pdf. Accessed 2015. 23.Yoon J, Kwon S, Shim J. Present status and issues of school nutrition programs in Korea. Asia Pac
J Clin Nutr. 2012;21(1):128–133.
24.Sang-hun C. In First, South Korea Votes on Social Policy. The New York Times. 2011. Available at: http://www.nytimes.com/2011/08/25/world/asia/25korea.html?_r=0. Accessed 2015.
25.Clark M, Fox M. Nutritional quality of the diets of US public school children and the role of the school meal programs. Journal of the American Dietetic Association. 2009;109(2):S44–S56. doi:10.1016/j.jada.2008.10.060.
26.Cole N, Fox M. Diet Quality of American School-Age Children by School Lunch Participation Status: Data from the National Health and Nutrition Examination Survey, 1999-2004. U.S. Department of Agriculture, Food and Nutrition Service, 2008.
27.Hanson KL, Olson CM. School meals participation and weekday dietary quality were associated after controlling for weekend eating among U.S. school children aged 6 to 17 years. Journal of Nutrition. 2013;143(5):714–721. doi:10.3945/jn.112.170548.
28.Campbell BL, Nayga RM, Park JL, Silva A. Does the National School Lunch Program improve children's dietary outcomes? American Journal of Agricultural Economics. 2011;93(4):1099– 1130. doi:10.1093/ajae/aar031.
30.Prynne CJ, Handford C, Dunn V, Bamber D, Goodyer IM, Stephen AM. The quality of midday meals eaten at school by adolescents; school lunches compared with packed lunches and their contribution to total energy and nutrient intakes. Public Health Nutrition. 2011;16(6):1118– 1125.
31.Stevens L, Nelson M. The contribution of school meals and packed lunch to food consumption and nutrient intakes in UK primary school children from a low income population. Journal of Human Nutrition and Dietetics. 2011;24:223–232.
32.Park J, Kim E, Kim M, Choi M. Comparison of Meal Satisfaction, Dietary Habits, and Nutrient Intakes according to School Lunch Support among Middle School Boys and Girls in Incheon. Journal of the Korean Dietetic Association. 2012;18(1):1–15.
33.Park N, Choi Y. Nutritional Status of School Lunch-Supported Elementary School Children in Gyeongbuk Rural Area. Korean J Nutr. 2008;41(4):341–352.
Figures and Tables
Figure 1. Participation rates in the National School Lunch Program.
Source: Ralston and Newman, 2015.
Table 1. Average US school meal prices, 2013-2014 school year.
Lunch Breakfast
Elementary $2.18 $1.26
Middle $2.37 $1.33
High $2.42 $1.36
Figure 2. Previous and current U.S. Federal nutrition requirements for school lunches.
Table 2. Average UK school meal prices by free school meal density, 2013-2014 school year.
Low FSM Density Medium FSM Density High FSM Density
Average price (£) 2.09 2.05 1.99
Source: United Kingdom Department for Education, 2015
Table 3. Nutrient-based standards for primary and secondary students in the UK.
Source: Children’s Food Trust, 2013 EAR: Estimated average requirement RNI: Reference nutrient intake
Table 4. Previous and current food-based standards for school lunches in the UK.
Food Group Previous Standards (2006) Current Standards (2014)
Starchy food Starchy food cooked in fat or oil should not be provided more than three times a week across the school day
Bread with no added fat or oil must be available every days
One or more portions every day
Three or more different starchy foods each week One or more whole grain foods each week Starchy food cooked in fat or oil no more than two
days each week*
Bread with no added fat or oil must be available every day
Fruits and vegetables
At least two portions per day must be provided; at least one vegetable or salad and at least one fruit.
One or more portions of vegetables/salad every day One or more portions of fruit every day
A dessert containing at least 50% fruit two or more times each week
At least three different fruits and vegetables each week
Meat, fish, eggs, beans, and other non-dairy protein
Oily fish must be provided at least once every three weeks
A meat product (manufactured or homemade and meeting the legal requirements) may be provided no more than once per fortnight*
A portion every day
A portion of meat/poultry at least three days each week
Oily fish once or more every three weeks
A portion of vegetarian non-dairy protein on three or more days each week
A meat or poultry product (manufactured or
homemade, and meeting the legal requirements) no more than once each week in primary schools and twice each week in secondary schools*
Milk and dairy No standard A portion every day; low fat milk must be available for drinking at least once a day during school hours Foods high in fat,
sugar, and salt
No snacks, except nuts, seeds, vegetables and fruit with no added salt, sugar or fat
Savory crackers or breadsticks can be served at lunch with fruit, vegetables, or dairy food
No candy, chocolate or chocolate coated products*
Cakes and biscuits are allowed at lunch but must not contain any candy No salt shall be available to add after
the cooking process is complete Condiments must be limited to sachets
or individual portions of no more than 10g or 1 tsp
No more than two portions of food that have been fried, batter- or breadcrumb-coated each week* No more than two portions of food which include
pastry each week*
No snacks, except nuts, seeds, vegetables and fruit with no added salt, sugar or fat*
Savory crackers or breadsticks can be served at lunch with fruit, vegetables, or dairy food
No candy, chocolate or chocolate coated products* Cakes and biscuits are allowed at lunch but must
not contain any candy
No salt shall be available to add after the cooking process is complete*
Condiments must be limited to sachets or individual portions of no more than 10 g or 1 tsp*
Healthier drinks* Free, fresh drinking water provided at all times
The only drinks permitted are plain water (still or sparkling), low fat milk or lactose reduced milk, fruit or vegetable juice, plain soy, rice, or oat drinks enriched with calcium, plain yogurt drinks, combination drinks, flavored low fat milk. Tea, coffee and hot chocolate containing <5% added sugars or honey are also permitted.
Free, fresh drinking water provided at all times The only drinks permitted are plain water (still or
sparkling), low fat milk or lactose reduced milk, fruit or vegetable juice (max 150 mL), plain soy, rice or oat drinks enriched with calcium, plain yogurt drinks, combinations drinks with <5% added sugars or honey, tea, coffee, and hot chocolate
Combination drinks are limited to 330 mL and may contain no more than 150 mL of fruit or vegetable juice. Fruit or vegetable juice combination drinks must be at least 45% fruit or vegetable juice
Figure 3. Trends in school lunch provision by South Korean schools.
Source: Yoon, Kwon, & Shim, 2012
Table 5. Nutritional standards for school lunches in South Korea.
Table 6. Summary characteristics of school lunch programs by country.
United States United Kingdom South Korea
School Year 2013-2014 2013-2014 2010-2011
Participation Rate (%) 60 42.6 98.8
Average Price ($US) 2.32 2.92* 2.74**
*Converted to USD using 2013 OECD PPP factor **Converted to USD using 2010 OECD PPP factor
Table 7. Summary of school lunch standards by country.
United States United Kingdom South Korea
Year last updated 2010 2014 2007
Energy requirements for primary
school students* (kcal) 550-650 503.5-556.5 500-634
Energy requirements for secondary
school** students (kcal) 600-850 613.7-678.3 667-900
Minimum protein requirements for
primary school students (g) n/a 7.5 8.4-11.7
Minimum protein requirements for
secondary school students (g) n/a 13.3 15-20
Maximum saturated fat for primary
school students (g) 5.5-6.5 6.5 n/a
Maximum saturated fat for
secondary school students (g) 6.0-8.5 7.9 n/a
Maximum sodium for primary
school students (mg) 740 (by 2022) 499 n/a
Maximum sodium for secondary
school students (mg) 740 (by 2022) 714 n/a
Minimum iron for primary school
students (mg) n/a 3.0 2.4-3.0
Minimum iron for secondary school
students (mg) n/a 5.2 3-4
Table 8. Healthy Eating Index-2005 (HEI-2005) scoring system
Source: Cole and Fox, 2008
Table 9. Association between school lunch participation and total dietary intake of select nutrients
United States United Kingdom South Korea
Calories P, ND ND N
Protein P P N (plant), ND (animal)
Saturated Fat P N, ND ND*
Sodium P N N
Folate P P N
Vitamin A P, ND P N
Vitamin C P, ND P ND
P: School lunch participants had higher intakes compared to non-participants N: Non-participants had higher intakes compared to participants
Appendices
Appendix A. Examples of school lunches from the United States
Source: http://www.springlakeparkschools.org
Appendix B. Examples of school lunches from the United Kingdom
Source: http://www.dailymail.co.uk
Appendix C. Examples of school lunches from South Korea
Source: http://www.veganurbanite.com