A custom microarray platform for analysis of microRNA
gene expression
J Michael Thomson
1, Joel Parker
2,5, Charles M Perou
2–4& Scott M Hammond
1,2MicroRNAs are short, noncoding RNA transcripts that post-transcriptionally regulate gene expression. Several hundred microRNA genes have been identified inCaenorhabditis elegans,
Drosophila, plants and mammals. MicroRNAs have been linked to developmental processes inC. elegans, plants and humans and to cell growth and apoptosis inDrosophila. A major impediment in the study of microRNA function is the lack of quantitative expression profiling methods. To close this technological gap, we have designed dual-channel microarrays that monitor expression levels of 124 mammalian microRNAs. Using these tools, we observed distinct patterns of expression among adult mouse tissues and embryonic stem cells. Expression profiles of staged embryos demonstrate temporal regulation of a large class of microRNAs, including members of thelet-7family. This microarray technology enables comprehensive investigation of microRNA expression, and furthers our understanding of this class of recently discovered noncoding RNAs.
MicroRNAs comprise a large family of noncoding RNAs found in organisms ranging from nematodes to plants to humans (see ref. 1 for a review). Over 200 microRNAs have been identified in mammals, either through computational searches or by RT-PCR-mediated cloning. These RNAs function as natural triggers of the RNAi pathway, regulating gene expression at a post-transcrip-tional step.
MicroRNA biogenesis begins with a primary transcript that contains a stem-loop structure1. This transcript is processed by the ribonuclease III enzyme Drosha, liberating the stem-loop, which is termed the precursor. This precursor is transported out of the nucleus in a process dependent on the Ran GTPase and the export receptor exportin-5. Further processing in the cytoplasm by the ribonuclease III enzyme Dicer leads to the production of mature RNAs ofB22 nucleotides (nt) that are incorporated into the RNAi effector complex RISC (RNA-induced silencing com-plex). Complementarity with elements in mRNAs leads to suppres-sion of gene expressuppres-sion. In cases where the microRNA is an imperfect match to the mRNA, as withC. elegans lin-4, recognition leads to reduction in protein levels without affecting mRNA levels. In plants, mRNA targets in the scarecrow-like family of
transcription factors contain sequences perfectly complementary to the microRNA miR-39. Similarly, in mammals, miR-196 has near-perfect identity with elements in the mRNA of the
homeobox transcription factor gene HoxB8 (ref. 2). In this
case recognition of the mRNA by microRNAs leads to cleavage, rather than translational repression, analogous to siRNA-mediated gene silencing3,4.
Despite the large number of identified microRNAs, the scope of their roles in regulating cellular gene expression is not known. The founding members of this family of noncoding RNAs are the
C. elegans lin-4andlet-7(refs. 5,6). Expression of these microRNAs,
originally termed short-temporal RNAs, is essential for proper timing of events during larval development. For example, levels of the let-7RNA increase during the fourth larval stage and the adult stage, resulting in suppression of larval-specific genes,
includ-inglin-41(ref. 6). Partially complementary elements in thelin-41
mRNA are binding sites for let-7 (ref. 7). The role of microRNAs in cell lineage and development has recently been found to
extend to mammalian systems. miR-181 is highly expressed in
hematopoietic progenitors, and its overexpression promotes differ-entiation into B-lineage cells8. The regulation of homeobox genes by microRNAs further links this gene family to mammalian developmental processes2.
One approach to identifying the cellular roles of microRNAs is the identification of mRNA targets. Several groups have developed computational methods to search for target sequences of micro-RNAs (see ref. 1 for a discussion). These methods have yielded hundreds of candidate targets in plants,Drosophilaand mammals that implicate microRNAs in a diverse range of cellular pathways. Essential for the interpretation of these data, however, is an
understanding of microRNA expression patterns vis-a`-vis
expression patterns of predicted targets. The temporally restricted expression of large sets of microRNAs inC. elegansandDrosophila
has been reported9–11. More recently, tissue-specific expression
patterns of mammalian microRNAs have been described12.
All data were obtained by northern blot analysis of microRNA levels. As a refinement to this approach, the use of nylon macro-arrays for analysis of 44 microRNAs during brain development has
been reported13. All the aforementioned approaches, however,
PUBLISHED ONLINE 29 SEPTEMBER 2004; DOI:10.1038/NMETH704
1Department of Cell and Developmental Biology,2Lineberger Comprehensive Cancer Center,3Department of Genetics and4Department of Pathology and Laboratory Medicine, University of North Carolina, Chapel Hill, North Carolina 27599, USA.5Present address: Constella Group, Inc., 2605 Meridian Parkway, Durham, North Carolina 27713, USA. Correspondence should be addressed to S.M.H. ([email protected]).
©
2004 Nature Publishing
Gr
oup
http://www
.nature
.com/nature
suffer from drawbacks associated with all northern blot analysis, including unequal hybridization efficiency of individual probes and targets and the use of single data points (such as GADPH, or in the case of microRNA northern blots, 5S rRNA or U6 snRNA) for normalization. This impairs accurate quantification and limits the measurement of small changes in expression levels. mRNA expression profiling has benefited from two-color fluores-cence-based microarray technologies, which have largely overcome these issues.
To better understand microRNA function, we have adapted oligonucleotide microarray methods for microRNA expression profiling. Here we describe the methodology of microRNA micro-arrays and report the expression profiles of 124 microRNAs in adult mouse tissues and embryonic stages.
RESULTS
MicroRNA microarray design strategy
The design of our microRNA microarrays is similar to that of other spotted oligonucleotide microarrays, with several important differ-ences. First, mature microRNAs are not polyadenylated, precluding standard labeling methods that begin with oligo(dT)-primed reverse transcription. We adapted a published labeling method
that uses T4 RNA ligase to couple the 3¢ end of RNAs to a
fluorescent modified dinucleotide14. We use a large molar excess of the dinucleotide, which is the donor molecule in the ligation mechanism. This drives the reaction, enhancing sensitivity while reducing the chance of aberrant ligation products. The dinucleotide itself cannot concatemerize because its 3¢ end is blocked by the fluorescent moiety. Another advantage of this labeling method is
that it requires the presence of 3¢-OH termini on microRNAs,
which we have found significantly improves specificity. We have tested several alternative labeling methods. Molecular Probes sells a platinum-based chemical labeling product for nucleic acids (Ulysis Alexa Fluor). Labeling of cellular RNA with this nonspecific product yielded spurious signal from many array elements, which are likely to arise from the much more abundant ribosomal and transfer RNAs (data not shown). Removal of excess reagent is also crucial because it is amine reactive, and the GAPS microarray slide is amine based. Terminal deoxynucleotide transferase can also be used to label nucleic acids. In our hands this method was less sensitive by a factor of 10 than the ligation method.
The second major distinction of microRNA arrays is the minimal sequence available for hybridization. Mature microRNAs range between 18 and 25 nt, restricting probe design to this sequence length. The wide range of melting temperatures of microRNA sequences presents an unsatisfactory probe set for a microarray; however, we find high specificity across a range of hybridization conditions (as discussed later).
Oligonucleotide probes were synthesized in duplicate for 124 nonredundant, conserved human and mouse microRNAs, anti-sense to the published mature sequence (seeSupplementary Fig. 1 online for sequences). Sequences were based on original publica-tions describing the microRNAs, although the gene names were adjusted to follow the Sanger microRNA database15. Probes were duplicate spotted on Corning GAPS-2 coated slides using a robotic spotter (see Fig. 1 for a representative microarray). MicroRNAs were labeled with Cy3 (green channel) and hybridized to the array. Current hybridization protocols use microchambers instead of coverslips, which allows mixing of the hybridization buffer and
prevents edge effects. We adapted MJ Research in situ PCR
chambers as disposable hybridization chambers. A reference oligo-nucleotide set corresponding to all mature microRNAs, labeled with Cy5 (red channel), was included in all hybridizations. This reference set provides an internal hybridization control for every probe on the array. In principle, this could permit absolute levels of microRNAs to be measured. Owing to labeling differences and differences in RNA-DNA versus DNA-DNA hybridization, how-ever, we cannot quantitatively interpret the data in absolute terms. Therefore, all expression data in this paper follow microarray conventions whereby expression levels are reported as relative across samples.
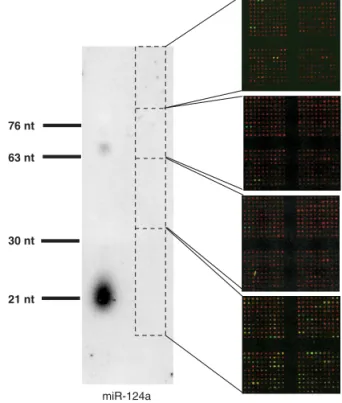
We initially gel-isolated RNA in the 18–25 nt size range before labeling. This was intended to prevent cross-hybridization with abundant cellular RNAs under the moderately low-stringency conditions that were necessitated by the short nature of the array probes. We found that this was not necessary owing to the specificity gained by using ligation-based labeling. We gel-isolated RNA from several different size ranges and hybridized it to
the microarray (Fig. 1). Only RNA derived from the expected
18–30-nt size range gave appreciable signal in the green (Cy3, labeled microRNA) channel. Signal from the high molecular size range was limited to three probe pairs, which were excluded from further analysis.
We tested a range of RNA quantities to determine the sensitivity of the microarray procedure. Amounts of mouse kidney total RNA ranging from 5 ng to 50mg were labeled with Cy3 and hybridized to
76 nt
63 nt
30 nt
21 nt
miR-124a
Figure 1| Validation of the labeling method. RNA from the mouse
neuroblastoma cell line NIE-115 was fractionated on a 15% acrylamide gel and the indicated size fractions were isolated. A northern blot of miR-124a is shown as a size reference. RNA was labeled with Cy3, combined with a Cy5 oligonucleotide reference set and hybridized to a microRNA microarray. Shown are raw TIFF images from each RNA size range. Arrays were scanned at equal PMT voltages. The reduced reference-set signal from upper arrays is likely to result from competition from increased total RNA in larger size ranges.
©
2004 Nature Publishing
Gr
oup
http://www
.nature
.com/nature
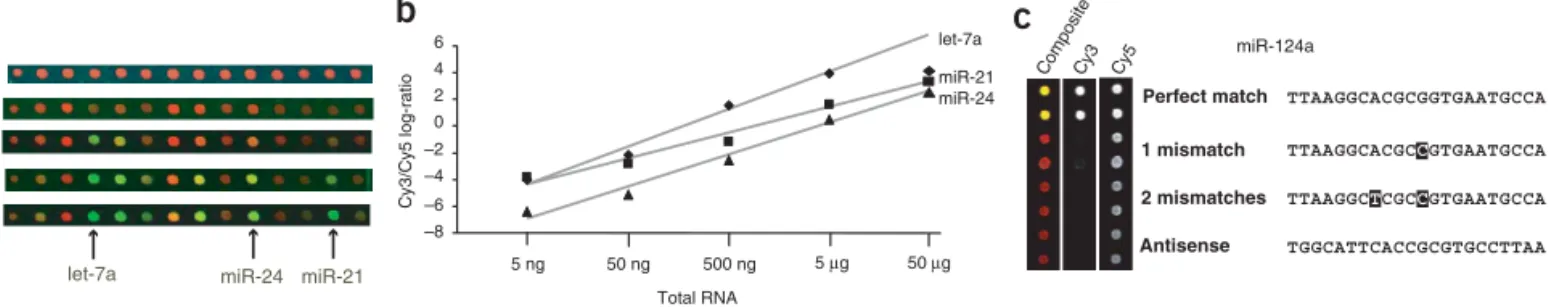
the array (Fig. 2a). Abundant microRNAs in this RNA source can be detected in as little as 50 ng total RNA. Plotting un-normalized Cy3/Cy5 ratios against RNA quantity for three microRNAs (Fig. 2b) revealed a linear relationship in the range from 50 ng to 5mg. It should be emphasized that for less abundant microRNAs 50 ng does not give adequate signal over background. Using a cutoff value of 1.5-fold over background for raw Cy3 values, 50 ng total kidney RNA yields detectable signal for 10.5% of the microRNA
probes on the array, whereas 500 ng and 5mg total RNA yields
signal for 51% and 72% of probes, respectively. Increasing the amount of RNA to 50mg results in partial saturation of signal, likely resulting from competition during the labeling reaction. Removal of large-molecular-weight RNAs by polyethylene glycol (PEG) precipitation extends the linear range to 50mg. All clustered data
in this report were obtained using 25 mg PEG-treated RNA to
maximize signal intensity.
Mismatch controls incorporated into the array were used to confirm the specificity of hybridization (Fig. 2c). We cannot exclude the possibility, however, that microRNAs with very similar sequences yield some cross-hybridization. We feel that this does not impair interpretation of the array data. Because microRNAs recog-nize target mRNAs by hybridization, similar microRNAs will be likely to target overlapping sets of mRNAs. Minimal cross-hybridization in our arrays would therefore not affect interpreta-tion of biological pathways regulated by microRNA gene families. Furthermore, the hybridization stringency can be customized for specific melting temperatures of microRNA sequences to optimize specificity. The simple and sensitive array method we describe here facilitates such studies.
Several normalization methods have been developed for micro-array data (see ref. 16 for a review). Global median centering multiplies each Cy3/Cy5 ratio by a constant such that the median value is zero (for log-transformed ratios). This type of normalization method corrects for RNA quantity and quality and the efficiency of individual labeling reactions. It does not perform well, however, when there are large differences in RNA concentrations between samples. More sophisticated methods have been developed, such as Lowess normalization, which takes into account pin-specific biases during the spotting process. We have tested arrays in which all probes are spotted by all pins and have not seen significant pin differences (Pearson correlation40.95 from pin to pin). Another normalization method is based on ‘housekeeping’ genes that are
relatively invariant17. The lack of such information about micro-RNAs precluded such a supervised approach. We therefore used global median centering for all data analysis (see Supplementary Fig. 2online).
Replicate hybridizations for each RNA source described here showed an average Pearson correlation of 0.915, with thymus showing the weakest correlation, 0.75. This reproducibility is more than adequate for the analysis we have performed to date, as individual tissues and cell lines have microRNA expression correlations ranging from 0.0 to 0.7. Typical correlations among different print batches were in the range of 0.70–0.85. To maximize data quality, array data from different print batches were not combined in any individual cluster analysis.
Expression analysis of embryonic and adult mouse
Tissue-specific expression patterns for a subset of known micro-RNAs have been reported on the basis of on cloning frequencies and northern blotting. To more thoroughly examine expression patterns, we profiled RNA from seven mouse tissues, four different embryonic stages, embryonic stem (ES) cells and embryoid bodies (Fig. 3). Embryoid bodies are ES cells that are cultured in suspen-sion in the absence of leukocyte inhibitory factor (LIF). Such growth conditions promote differentiation into clusters of cells containing all three primordial germ layers, which loosely approx-imates early development18.
Several interesting points are readily apparent in the expression map. The adult tissues separate on the dendrogram from the embryos and from the ES cells and embryoid bodies. The data are complicated by the fact that whole embryos contain mixed cell types, and even tissues are a mixture of several cell lineages. Nevertheless, a large group of microRNAs are highly expressed in diverse adult tissues but are not detectably expressed in embryo. This includes themir-29andmir-30families and the
mir-23–mir-24–mir-27 polycistronic cluster. The let-7 family, shown in the
expanded cluster, is induced at embryonic day (E) 17 and increases in adult tissues. C. elegans let-7is a well-characterized develop-mental regulator. The expression pattern in mice suggests this family has a developmental role in this organism as well.
Although the adult tissues cluster together, restricted microRNA expression is apparent for many of them. Clusters of genes that are abundantly expressed in liver, heart, ES cells, brain and thymus are highlighted. Many tissue-specific genes are also expressed in
500 ng 5 µg 50 µg 50 ng 5 ng
let-7a miR-24 miR-21
–8 –6 –4 –2 0
C
y
3/C
y
5 log-ratio
Total RNA 2
4
6 miR-124a
Cy5 Cy3 Co
mp osite
TGGCATTCACCGCGTGCCTTAA TTAAGGCTCGCCGTGAATGCCA TTAAGGCACGCCGTGAATGCCA TTAAGGCACGCGGTGAATGCCA Perfect match
1 mismatch
2 mismatches
Antisense
5 ng 50 ng 500 ng 5 µg 50 µg let-7a miR-21 miR-24
a
b
c
Figure 2| Sensitivity and specificity of microRNA microarrays. (a) Total RNA from mouse kidney was labeled with Cy3 with the indicated amounts of starting material. RNA was not PEG fractionated. Labeled RNA was combined with a Cy5 reference set and hybridized to the microarray. TIFF images of sections of the arrays are shown, with the positions of three abundant microRNAs in this tissue source. Arrays were scanned at identical PMT voltages. (b) Plots of raw Cy3/Cy5 log-ratios of three microRNAs, with calculated linear regression lines shown (excluding 50mg values, which were saturating). (c) Expanded sections of TIFF images fromFigure 1, with the position of mismatched control probes for 124a. Individual channels and a composite image are shown. Mismatched miR-124a sequences are shown, with mutations in bold. Exact inverse complement sequences were spotted on the array.
©
2004 Nature Publishing
Gr
oup
http://www
.nature
.com/nature
embryo at specific stages (see expanded clusters). For example, the liver cluster is not induced significantly until E17, whereas heart-specific microRNAs appear by E7. Several brain-heart-specific
micro-RNAs, including mir-124 and mir-136, are induced early in
embryoid body formation and remain high during development. The temporal expression patterns do not necessarily define devel-opment points for specific lineages, as many early markers for cell lineages are detectable earlier than corresponding tissue-specific
miR-21 miR-145 miR-218 miR-137 miR-101 miR-29b miR-29c miR-29a miR-28 miR-32 miR-19b miR-98 miR-30d miR-30b miR-30c miR-26b miR-26a miR-15b miR-30a* miR-24 miR-126 miR-23a let-7i let-7g miR-224 let-7a let-7e let-7b let-7f let-7d let-7c miR-106b miR-16 miR-10a miR-22 miR-27b miR-27a miR-99b miR-23b miR-193 miR-200b miR-33 miR-200a miR-141 miR-195 miR-150 miR-142-3P miR-140 miR-122a miR-148 miR-143 miR-31 miR-146 miR-126* miR-191 miR-199a* miR-199a miR-190 miR-15a miR-130b miR-130a miR-144 miR-206 miR-133a miR-1 miR-185 miR-30a miR-187 miR-208 miR-139 miR-216 miR-153 miR-7 miR-204 miR-132 miR-129 miR-213 miR-221 miR-107 miR-103 miR-223 miR-194 miR-196 miR-192 miR-184 miR-152 miR-10b miR-205 miR-93 miR-20 miR-17-5P miR-25 miR-182 miR-214 miR-92 miR-134 miR-188 miR-142-5P miR-18 miR-34a miR-222 miR-125b miR-125a miR-100 miR-96 miR-186 miR-138 miR-128a miR-219 miR-154 miR-136 miR-9 miR-124a miR-127 miR-9* miR-149 miR-99a miR-203 miR-183 miR-135 miR-210 miR-181b miR-181a miR-212 E15 E11 E17 E7 EB 28 d EB 3 d
ES BrainThymus Liver HeartKidney OvaryLung
let-7i let-7g miR-224 let-7a let-7e let-7b let-7f let-7d let-7c miR-154 miR-136 miR-9 miR-124a E15 E11 E17 E7
EB 28 d
EB 3 d
ES Brain Thymus Liver Heart Kidney Ovary Lung
miR-140 miR-122a miR-206 miR-133a miR-1 miR-222 miR-125b miR-125a miR-210 miR-181b miR-181a miR-212 miR-127
–4 0 4
Fold change Thymus cluster Th ym us Br
ain Late brain cluster
Early brain cluster
ES cell Heart cluster Hear t Liver cluster Liv e r let-7 cluster Adult tissues
Figure 3| Expression data from seven adult mouse tissues, ES cells, embryoid bodies (EB) and four mouse embryo stages. Median values from four normalized, log-ratio (base 2) data sets were hierarchically clustered in both dimensions and plotted as a heat map. Yellow denotes high expression and blue low expression. Data from each microRNA row were median centered. Dendrograms indicate correlation among groups of tissues and genes. The range of expression values is from –4-fold to 0 to +4-fold, although values at each maximal color may exceed that amount. For example, the value for miR-1 is 84-fold higher in heart than brain; however, the expression map is saturated and thus the true variation in expression may be greater. Vertical bars highlight tissue-restricted clusters, several of which are expanded at the right of the figure for emphasis.
©
2004 Nature Publishing
microRNA genes19. Rather, our data present an overview of the developmental time course of the microRNA gene family.
To validate our microRNA microarrays, we compared expression profiles to published northern blot and cloning frequency data for microRNAs that are expressed predominantly in one tissue (Table 1). Published data were included in our analysis only if they compared specific microRNA expression levels across several distinct tissues. In general our microarray data correlate very well with published data. The primary difference is the high sensitivity of our method, which allows profiling of weakly expressed genes. In such cases, cloning frequencies are very low, which prevents a good statistical analysis of expression patterns. In the case of northern analysis, the expression levels of many microRNAs are at the detection limit, making quantification unreliable.
DISCUSSION
We describe here a microarray method for the analysis of micro-RNA expression levels. We have performed a basic analysis of
124 microRNA genes in different mouse tissues and embryo stages. As previously reported using semiquantitative approaches, microRNAs show tissue-restricted and developmentally restricted expression patterns. We are currently pursuing a more defined developmental and spatial analysis in mouse brain using micro-dissected samples. In addition, a large number of microRNA genes have been identified since we initially designed our array. We are presently developing a new microarray format that includes 169 human, 184 mouse and 169 rat genes. This includes many brain-and ES cell–specific genes that were not included in the array described here.
A microarray method for microRNA profiling has recently been reported20. This method differs from the one described here in that it labels and measures quantities of the microRNA primary transcript. Although primary transcript profiling offer some bene-fits, such as the ability to study the regulation of microRNA transcript processing across many genes at once, it might not provide an exact representation of the expression profile of active mature microRNA species. Because the microRNA primary tran-script undergoes several processing and RISC assembly steps before it is in a biologically active form, equating levels of the primary transcript with the mature, RISC-loaded microRNA could be misleading. In addition, labeling the highly structured primary transcript using random primers and Superscript reverse transcrip-tase may be susceptible to strong biases in efficiency. These biases are likely generated when the reverse transcriptase needs to traverse the highly structured stem-loop to reach the region the probe is directed against. According to a comprehensive study, using gene-specific primers that anneal within the stem-loop and a thermostable reverse transcriptase at high temperature facilitate the labeling of microRNA precursors21. In light of these points, and our incomplete understanding of microRNA biogenesis, we feel that direct measurement of mature microRNA species, which are the active form and thus the most relevant indicator of biologic function, is more reliable.
We have performed over 500 arrays spanning six print runs. The ease of use is comparable to that of typical mRNA microarrays. Total unfractionated RNA is a suitable substrate, although using PEG-fractionated RNA allows for a stronger signal. The labeling reaction and cleanup take 2 h. For samples of 5mg or more, a 4-h hybridization is sufficient. It is reasonable to perform 20 micro-arrays in one day. Because the micro-arrays are produced in-house, costs are kept low.
RNA ligase has a poor reputation for reliability; however, we have had very few failures. The reaction conditions, and the large molar excess of the donor dinucleotide, combine to make the reaction efficient and reliable. The primary source of bias in the labeling reaction is the differential ligation efficiency toward the acceptor nucleotide on the microRNA. An examination of average signal intensities for microRNA probes, grouped by 3¢-terminal nucleo-tide, showed less than a twofold range.
The sensitivity is much higher than that of current northern blot approaches. For example, we find miR-10b weakly expressed in kidney; however, we can detect this microRNA at 2.7-fold over
background using 5 mg total RNA. In a published analysis of
microRNA expression using a highly sensitive northern blot method (StarFire labeling, Integrated DNA Technologies), no miR-10b expression was detected in any tissue using 1.1-fold over background as a cutoff value12. Of course, northern blotting, or the
Table 1|Comparison of expression data with published data
Predominant tissue (microarray)
MicroRNA
gene name Northern data Cloning data
Liver 122a Liver12 Liver
140 NA NA
ES cell 214 NA NA
134 NA NA
92 ES cell23 HeLa cell
25 NA HeLa cell
182 NA NA
204 NA NA
132 Brain12 NA
Thymus 210 NA NA
181a Thymus8 Several
181b Thymus8 Several
212 NA NA
Heart 206 Heart, skel12 NA
133a Heart, skel12 Heart
1 Heart, skel12 Heart
144 Spleen12 Heart
Brain 222 NA NA
218 NA NA
125a Brain12 Kid, skel, brain
125b Brain12 Several
34a NA NA
128a Brain12 Brain
136 NA NA
127 Brain, spleen12 NA
138 NA NA
9 Brain12 Brain
9* Brain12 Brain
219 NA NA
124a Brain12 Brain
154 NA NA
149 NA NA
MicroRNAs that are restricted to one primary tissue, as indicated by microarray data, are listed in the first column. Predominant tissue expression, as indicated by northern blot analysis, is listed in column 2 (based on published work where several tissues were surveyed8,12,23).
Predominant tissues from which microRNAs were cloned are listed in column 3. Only cases where more than three total microRNA clones were reported are listed24. NA, not available;
skel, skeletal muscle; kid, kidney.
©
2004 Nature Publishing
Gr
oup
http://www
.nature
.com/nature
recently reported quantitative PCR method, is still essential for verification of microarray data22.
The methods we have developed should also be applicable to
other non-polyadenylated RNAs, provided a 3¢ OH group is
available to ligate the fluorophore. In addition, this method may have utility for direct labeling of mRNAs for standard microarray processes. Direct labeling has the advantage of reduced bias. In fact, because all mRNAs terminate in polyadenosine, ligation biases should be completely eliminated. This fact, coupled with the sensitivity we observed, makes this a promising general approach.
METHODS
RNA sources.Total RNA from adult mouse tissues was obtained
from Ambion. Total RNA from staged mouse embryos was obtained from Clontech. The feederless ES cell line E14Tg2A.4 was grown on gelatin-coated plates in Glasgow MEM (Sigma)
supplemented with 2 mM glutamine, 1 mM pyruvate, 1
non-essential amino acids, 15% fetal bovine serum (HyClone), 0.1 mM
b-mercaptoethanol and 103 units/ml leukocyte inhibitory factor (LIF, Chemicon). Embryoid bodies were generated by growth in
ES medium lacking LIF andb-mercaptoethanol on nonadherence
Petri dishes. Embryoid bodies were grown in suspension for 3 or 28 d, as indicated in the figure. Total RNA was isolated with Trizol (Invitrogen). High-molecular-weight RNAs were removed by pre-cipitation with 12.5% PEG-8000, 1.25 M NaCl. For the
experi-ments shown in Figure 1, RNA was fractionated on a 15%
acrylamide, 8 M urea TAE gel and extracted in water. For experiments shown in the remaining figures, RNA was only fractionated with PEG.
Nucleic acid labeling. RNA labeling was performed using RNA
ligase as described14. The labeling reaction contained RNA
(typi-cally 25 mg before PEG precipitation), 0.1 mM ATP, 50 mM
HEPES, pH 7.8, 3.5 mM DTT, 20 mM MgCl2, 10 mg/ml BSA,
10% DMSO, and 500 ng 5¢-phosphate-cytidyl-uridyl-Cy3-3¢
(Dharmacon) with 20 units T4 RNA ligase (NEB). The labeling
reaction was allowed to proceed at 01C for 2 h. Labeled RNA
was precipitated with 0.3 M sodium acetate, 2 volumes ethanol, and resuspended in water containing the labeled reference set. Reference-set oligodeoxynucleotides complementary to each probe were synthesized (Sigma-Genosys). A 0.5 mM mixture of all reference oligonucleotides was labeled using the Alexa 647 (Cy5) Ulysis kit from Molecular Probes, and excess labeling reagent was removed by Sephadex G-25 spin column (Amer-sham). This reference was used at a 1,000-fold dilution in each hybridization mixture.
Microarray methods.Oligonucleotide probes for 124 microRNAs
(seeSupplementary Fig. 1online for sequences) were synthesized (Sigma-Genosys) in duplicate and duplicate spotted on Corning
GAPS-2 slides in 3SSC using a Genomic Solutions OmniGrid
100 arrayer. Slides were crosslinked with UV at 600 mJ,
prehybridized in 3 SSC, 0.1% SDS, 0.2% BSA for 45 min,
and hybridized for 2 h at 371C in 400 mM Na2HPO4pH 7.0,
0.8% BSA, 5% SDS, 12% formamide. Hybridization was per-formed in disposable chambers from MJ Research (part number SLF-0601). These consist of square frames of interior
dimension 15 mm 15 mm that are made of an adhesive
polymer. They are attached to the slide with the array inside the frame. A plastic coverslip is placed on the upper side, creating a chamber of 65ml volume. The hybridization mixture, total volume 61 ml, is injected into the chamber. Slides were washed once in
2SSC, 0.025% SDS, three times in 0.8SSC, and three times
in 0.4 SSC, at 25 1C. Slides were scanned with a Genepix
4000B Scanner (Axon) and raw pixel intensities extracted with Axon software.
Computational methods. Cy3 and Cy5 median pixel intensity
values were background subtracted, and Cy3/Cy5 ratios were obtained. Data points were removed when Cy5 values did not exceed 200% background. Database calculations were performed with Winstat for Excel. Cy3/Cy5 ratios were log-transformed (base 2), median centered by arrays and genes, and hierarchically clustered (average linkage correlation metric) using the Cluster program from Stanford University. Dendrograms and expression maps were generated by Treeview from Stanford.
Accession numbers.All microarray data were deposited at GEO-NCBI with the following accession numbers: GSE1635 and GSM28499–GSM28533.
Note: Supplementary information is available on the Nature Methods website.
ACKNOWLEDGMENTS
Cluster and Treeview software were developed by M. Eisen and generously distributed by Stanford University. The authors acknowledge the UNC Genomics and Microarray Core Facility for assisting in microarray production. The authors thank G. Hannon, Y. Xiong, M. Carmell, and members of the Hammond laboratory for critical reading of the manuscript and discussion of the project. S.M.H. is a General Motors Cancer Research Foundation Scholar.
COMPETING INTERESTS STATEMENT
The authors declare that they have no competing financial interests.
Received 6 June; accepted 10 August 2004
Published online at http://www.nature.com/naturemethods/
1. Bartel, D.P. MicroRNAs: genomics, biogenesis, mechanism, and function.Cell 116, 281–297 (2004).
2. Yekta, S., Shih, I.H. & Bartel, D.P. MicroRNA-directed cleavage of HOXB8 mRNA.
Science304, 594–596 (2004).
3. Doench, J.G., Petersen, C.P. & Sharp, P.A. siRNAs can function as miRNAs.Genes Dev.17, 438–442 (2003).
4. Zeng, Y., Yi, R. & Cullen, B.R. MicroRNAs and small interfering RNAs can inhibit mRNA expression by similar mechanisms.Proc. Natl. Acad. Sci. USA100, 9779– 9784 (2003).
5. Arasu, P., Wightman, B. & Ruvkun, G. Temporal regulation of lin-14 by the antagonistic action of two other heterochronic genes, lin-4 and lin-28.Genes Dev. 5, 1825–1833 (1991).
6. Reinhart, B.J.et al.The 21-nucleotide let-7 RNA regulates developmental timing inCaenorhabditis elegans.Nature403, 901–906 (2000).
7. Vella, M.C., Choi, E.Y., Lin, S.Y., Reinert, K. & Slack, F.J. TheC. elegansmicroRNA let-7 binds to imperfect let-7 complementary sites from the lin-41 3¢UTR.Genes Dev.18, 132–137 (2004).
8. Chen, C.Z., Li, L., Lodish, H.F. & Bartel, D.P. MicroRNAs modulate hematopoietic lineage differentiation.Science303, 83–86 (2004).
9. Aravin, A.A.et al.The small RNA profile duringDrosophila melanogaster development.Dev. Cell5, 337–350 (2003).
10. Sempere, L.F., Sokol, N.S., Dubrovsky, E.B., Berger, E.M. & Ambros, V. Temporal regulation of microRNA expression inDrosophila melanogastermediated by hormonal signals and broad-complex gene activity.Dev. Biol.259, 9–18 (2003).
11. Lim, L.P.et al.The microRNAs ofCaenorhabditis elegans.Genes Dev.17, 991–1008 (2003).
12. Sempere, L.F.et al.Expression profiling of mammalian microRNAs uncovers a subset of brain-expressed microRNAs with possible roles in murine and human neuronal differentiation.Genome Biol.5, R13 (2004).
©
2004 Nature Publishing
Gr
oup
http://www
.nature
.com/nature
13. Krichevsky, A.M., King, K.S., Donahue, C.P., Khrapko, K. & Kosik, K.S. A microRNA array reveals extensive regulation of microRNAs during brain development.RNA9, 1274–1281 (2003).
14. Igloi, G.L. Nonradioactive labeling of RNA.Anal. Biochem.233, 124–129 (1996).
15. Griffiths-Jones, S. The microRNA Registry.Nucleic Acids Res.32, D109–D111 (2004).
16. Quackenbush, J. Microarray data normalization and transformation.Nat. Genet. 32(Suppl.), 496–501 (2002).
17. Wang, Y., Lu, J., Lee, R., Gu, Z. & Clarke, R. Iterative normalization of cDNA microarray data.IEEE Trans. Inf. Technol. Biomed.6, 29–37 (2002). 18. Eistetter, H.R. A mouse pluripotent embryonal stem cell line stage-specifically
regulates expression of homeo-box containing DNA sequences during differentiationin vitro.Eur. J. Cell Biol.45, 315–321 (1988).
19. Leahy, A., Xiong, J.W., Kuhnert, F. & Stuhlmann, H. Use of developmental marker genes to define temporal and spatial patterns of differentiation during embryoid body formation.J. Exp. Zool.284, 67–81 (1999).
20. Liu, C.G.et al.An oligonucleotide microchip for genome-wide microRNA profiling in human and mouse tissues.Proc. Natl. Acad. Sci. USA101, 9740–9744 (2004). 21. Schmittgen, T.D., Jiang, J., Liu, Q. & Yang, L. A high-throughput method to
monitor the expression of microRNA precursors.Nucleic Acids Res.32, e43 (2004).
22. Meister, G.et al.Human argonaute2 mediates RNA cleavage targeted by miRNAs and siRNAs.Mol. Cell15, 185–197 (2004).
23. Houbaviy, H.B., Murray, M.F. & Sharp, P.A. Embryonic stem cell–specific microRNAs.Dev. Cell5, 351–358 (2003).
24. Lagos-Quintana, M., Rauhut, R., Lendeckel, W. & Tuschl, T. Identification of novel genes coding for small expressed RNAs.Science294, 853–858 (2001).
©
2004 Nature Publishing
Gr
oup
http://www
.nature
.com/nature