Peter B. Shirts. Using Circulation and Interlibrary Loan Statistics to Inform Subsection-level Collection Development in an Academic Branch Music Library. A Master’s Paper for the M.S. in L.S. degree. April, 2014. 35 pages. Advisor: Rebecca Vargha
This study attempts to address future collection development priorities of the Music Library at the University of North Carolina at Chapel Hill through recent-past circulation patterns by examining circulation statistics for the past twenty years, as well as
interlibrary loan statistics for the past nine years, to determine which subsections of the library are overused or underused compared to the library’s baseline circulation. Subsections studied included LC subclasses of books and scores, book and score size, Dewey vs. LC scores, books stored offsite, and book language. Results suggest that the music library has an acceptable circulation rate for both books and scores, though the library might consider collecting more of the following to more closely align with patron use and demand: secular vocal music scores, French- and Spanish-language books, and books about jazz and popular music.
Headings:
Collection Development (Libraries)
Music libraries--Collection Development
USING CIRCULATION AND INTERLIBRARY LOAN STATISTICS TO INFORM SUBSECTION-LEVEL COLLECTION DEVELOPMENT
IN AN ACADEMIC BRANCH MUSIC LIBRARY
by Peter B. Shirts
A Master’s paper submitted to the faculty of the School of Information and Library Science of the University of North Carolina at Chapel Hill
in partial fulfillment of the requirements for the degree of Master of Science in
LibraryScience.
Chapel Hill, North Carolina
April 2014
Approved by
Table of Contents
Introduction ... 2
Literature Review ... 4
Methodology ... 10
Study Limitations ... 14
Results and Discussion ... 17
Conclusion and Future Studies ... 29
Introduction
Collections budgets in academic libraries across the United States are either
leveling or, in many cases, shrinking. At the same time, the number of academic
resources (print, electronic, periodical, etc.) available for purchase is growing. How can
academic libraries allocate their budgets to purchase the books most needed by their
users?
This resource allocation for academic music libraries is a special case compared
with many other libraries. Besides monographs, which are still the major source of
dissemination for music scholarship, music libraries also purchase a large number of
musical recordings and musical scores, including new music and new editions of old
music. While monographs and recordings are increasingly published in electronic
formats, the different user treatment of scores (often used for performance and highly
marked) has led to a much slower transition to electronic formats. This slower adoption
rate means that academic music libraries purchase musical scores almost exclusively in
print. The varied musical activity at colleges and universities also prompts various
collection strategies among the different music libraries. Not only is musical research
very specialized, but some university students are also performers. As such, the music
library purchases performance scores and study scores. While according to one study,
music librarians are typically above average at picking materials that will be used
(Dinkins, 2003, p.51), there is still much room for improvement in matching purchases
might consider collecting that category more selectively. While music libraries at large
research institutions may not be so limited by cost, more and more these large institutions
are also held accountable for their purchases.
The University of North Carolina at Chapel Hill’s Music Library (hereafter
UNC-CH Music Library) is one of the premier academic music research libraries in the United
States, and also serves a sizable performance-oriented population. Like most academic
libraries, the UNC-CH Music Library does not have an unlimited budget for acquisitions
and more information regarding collection use and user demand would be helpful to the
librarians responsible for collection development. To determine what sections of the
music branch library are overused or underused, this study uses Ochola’s (2002)
methodology to determine 1) what subsections of the score and monograph collection are
overused or underused relative to the library’s base circulation rate of these materials, and
2) if materials frequently borrowed from other libraries pertain to these particular
subsections, when possible. Use of materials is determined by analyzing a combination of
library circulation statistics and materials ordered from interlibrary loan (ILL) to generate
two statistics: percentage of expected use (PEU) and ratio of borrowing to holdings
(RBH). At the outset of the study, it was believed that foreign language monographs and
scores for chamber music significantly underperform in circulation and demand, while
vocal music, music for keyboard instruments, and English-language biographical
Literature Review
While academic libraries are holding on to budgets better than many other types
of libraries, there are some caveats. According to Regazzi (2012), from 1998–2008, U.S.
academic library collections budgets were on average growing 23 percent faster than
inflation (p.466). Much of this spending, however, was for electronic materials—print
material usage is declining dramatically (p.466–467). Also, Regazzi notes that small and
medium-sized libraries are falling behind large libraries in collections (p.449). In
addition, the time period accounted in this study does not cover the shrinkage in library
budgets after the 2008–2009 financial crisis.
Despite the rise in academic library budgets, these budgets continue to lag behind
the increase in resource production. As Cheug and Chung (2011) comment, just in the
United States, in 1980 there were 42,377 new books and new editions produced. By
2008, however, this number had increased to 289,729 (Cheug and Chung, 2011, p.420).
The explosion in the amount of information produced, not just in the U.S., but also
worldwide, necessitates the need for larger collection budgets and an increased need for
selectivity. Determining how to best select materials for libraries is not straightforward,
however.
In order to focus collection development priorities, and taking advantage of faster
delivery and processing mechanisms, starting in the late 1990s many libraries adopted a
new model of patron-driven acquisitions, called “just-in-time” acquisitions. The basic
interlibrary loan or otherwise, the library simply buys the material, if the cost is not too
onerous (Mortimore, 2005, p.30). While this model has been used with success in many
libraries (see Comer, 2006, p.76), an academic library cannot focus its entire budget on
these users’ requests, as these institutions also attempt to collect for the future needs of
their users as well as the immediate present. This traditional model of academic
acquisitions has been called “just-in-case,” to distinguish it from the newer just-in-time
model. A responsible model would seek to balance the two goals of helping library users
fulfill immediate needs and also predicting their future needs. Of course, fulfilling either
of these goals is risky, as both the just-in-case and just-in-time models can result in the
purchase of materials that receive little use. While it is impossible to eliminate risk
entirely, past collection development can be used to help decrease the inherent risk of
collection development.
For decades, one of the preferred tools to quantify use of libraries’ materials has
been circulation (Martell, 2008, p.401). Circulation attempts to quantify the main mission
of libraries—the use of collections. Librarians are always attempting to purchase
materials that will be used, but identifying those materials is hardly ever straightforward.
As Galvin and Kent comment, “It is useless to tell the acquisitions librarian that half the
monographs ordered will never be used, unless we can specify which 50 percent to avoid
buying” (1977, p.2317). For many years, the main line of circulation inquiry concentrated
on resources that receive large amounts of circulation in order to allocate resources (time,
space, money) more effectively. One of the most famous studies was by Richard
Truesdale in 1969, in which he coined the “80/20 rule,” which stipulates that 20% of the
including Britten’s “A Use Statistic in Collection Management: the 80/20 Rule
Revisited” (1990). Britten’s purpose was to show which sections of the library at the
University of Tennessee, Knoxville, showed the most use. He found considerable
variation between LC subclasses at his institution, though the larger subclasses did tend
toward the predicted 80/20 use statistic. Britten was able to use his circulation statistics to
answer collection questions about which specific sections of the library could use less or
more development.
Other studies have built on Britten’s success of isolating subsections for
collections scrutiny, such as Dinkins (2003) and Adams and Noel (2008). Dinkins
focused on the relationship between the selector of the books and circulation. She found
that materials selected by librarians during a four-year period had higher circulation rates
than materials selected by faculty or students. Adams and Noel conducted a similar study
with regard to music publishers, demonstrating that it is possible to predict the circulation
of a book simply by identifying the publisher. These results of these studies suggest that
exclusive just-in-time acquisitions cannot replace a librarian’s just-in-case selections.
In 2002, John N. Ochola took circulation inquiry to a new level with his article
“Use of Circulation Statistics and Interlibrary Loan Data in Collection Management,” in
which he outlined an empirical method of determining book use and demand by
subsection. Ochola’s method is based on several preceding studies. First, he utilized
Bonn’s (1974) concept of “use factor” and Mills’ (1981) elaboration of the same concept,
“percentage of expected use,” in which instead of simply reporting circulation numbers,
the circulation of various sections of the collection is compared to the average circulation
Aguilar’s (1986) claim that comparing circulation data with interlibrary loan will confirm
or deny the results of local analysis (p.3). Ochola calls his manifestation of this
comparison “ratio of borrowing to holdings.” According to Ochola, “by using a
combination of circulation statistics and interlibrary loan data, it is possible to provide
reliable proof of use or disuse of materials” (p.3). While Ochola’s purpose was mostly to
determine what materials could be stored at an off-site facility, the method has a broader
use of allowing librarians to fine-tune their collection development allocations.
Ochola’s methods have been used multiple times as a productive way of
comparing circulation of different subsections of library materials. Mortimore (2005)
promotes using Ochola’s methods to inform access-informed collection development,
especially with regard to just-in-time acquisitions decisions, though he does not pair his
exhortations with a case study. Rose-Wiles’ 2013 study of book circulation at a mid-sized
academic library uses percentage of expected use per subject area to target weeding areas,
but does not pair this with interlibrary loan data. After analyzing her data, Rose-Wiles
suggests two reasons why a print book’s circulation might be low: either the collection
does not match the user’s needs, or the user’s need for print books is low (p.145). She
says it is hard to pinpoint which is the case from the data. Rose-Wiles’ case illustrates the
importance of Ochola’s pairing of interlibrary loan data with circulation data, as
interlibrary loan requests could let librarians know if a certain category of book is
needed. Knievel et al. (2006) use Ochola’s methods to inform collection management
decisions at the University of Colorado at Boulder from interlibrary loans. In the study,
the authors examine the ratio of interlibrary loan requests to holdings, though instead of
statistic. Unlike percentage of expected use, transaction per item does not rely on relation
to other subclasses’ circulation. All of these studies mostly use large LC or subject area
classes and do not delve deeper to determine use within subclasses. The exception is
Britten (1990), who did a cursory analysis within the PT subclass but without the
refinement of Ochola’s methods.
In the aforementioned circulation studies, music collections are often excluded or
dismissed as an outlier. Britten (1990) excluded music classes from his study of the 80/20
rule without justification (p.186). Ochola excluded music from his study because the
music collections were not part of central library collections at Baylor, but in a branch
library (Ochola, 2002, p.4). Dinkins (2003), the only study here in which music played a
major part, found that even though music librarians and faculty selected 1,500 more
monographs than other departments, 39 percent of the music subject books accounted for
80 percent of the circulation, in defiance of the 80/20 rule (p.51). It is unclear whether
this comparatively higher use was because of the particular music librarians or some
other factor, however.
While circulation studies are numerous, studies about music collection circulation
are few and far between. These extant music circulation studies are not connected with
collection development decisions. Sandor’s 2008 study focused on finding missing items
to increase circulation statistic accuracy. Gillie and Teper’s 2005 study of musical scores
at the University of Illinois only dealt with circulation tangentially, though it did show
heavy use of their very large score collection: 14.5 percent of their materials circulated
more than ten times, and 54 percent had circulated between one and ten times, statistics
had never circulated. Non-use of one-third of a collection may be an accepted figure for
purchasing risk in academic libraries, but it is still a figure that represents misallocation
of resources. To this researcher’s knowledge, no published study has attempted to
Methodology
This study uses Ochola’s methods to determine relative usage of subsections
within LC subclasses of the UNC-CH Music Library. The study also compares this usage
with interlibrary loan requests by UNC-CH students and faculty to determine if lack of
circulation use indicates under-collecting or simply user uninterest.
Circulation is defined as having been checked out by the library to a library
account. Unfortunately, a small percentage of circulations are for internal processing and
do not reflect patron use. Holding numbers and circulation statistics were pulled from the
UNC-CH collection management system, Millennium, between January 8 and 24, 2014
using the “Make Lists” function and sorting by call number. The statistics gathered were
used to calculate percentage of expected use. The “total checkout” field from which these
circulation statistics are drawn predates the library’s adoption of Millennium in 2005,
having been carried over from previous systems. According to library staff, the total
checkout field contains information dating back to 1993 for materials at the UNC-CH
Music Library. Interlibrary loan statistics were pulled from the ILL office’s monthly
reports, which list LC call numbers when those are provided by OCLC. Data from ILL
monthly reports goes back nine years to 2005. Unfortunately, classification numbers are
not always provided in these ILL reports, and sometimes classification conventions differ
from library to library. For the majority of entries, however, full and transferable
Percentage of expected use (PEU) is calculated by 1) dividing the circulation
percentage of a subgroup by the percentage of total holding percentage for that subset and
2) multiplying this number by 100 to achieve a percentage (Ochola 2002, p.5). A number
higher than 100 indicates above average use in comparison to the total collection, and a
number below 100 indicates below average use. Ratio of borrowings to holdings (RBH)
is calculated by dividing the percentage of interlibrary loans on a given subject by the
percentage of holdings in each area (Mortimore, 2005, p.29). Because both percentage of
expected use and ratio of borrowings to holdings are based on percentage of holdings in
an expected area, these two figures can be directly compared.
While Ochola treated all LC materials the same in his study, this study will divide
up books and musical scores because of their differing characteristics. The first difference
is use—books are used mainly for scholarly research, while musical scores are used for
both research and performance. Secondly, the two resource types differ significantly in
cost. According to a survey of scores and books reviewed in the Music Library
Association journal Notes, music monographs cost around 45 dollars on average, while
scores (excluding historical and monumental editions, M1–3) cost between 20 and 35
dollars (Baunach, 2012). Because of this lower cost and short print runs, a just-in-case
model for score collection makes sense. Music monographs are on average more
expensive, but they also stay in print longer than scores. Another important difference
between the use of books and score is language—while scores for the most part can be
used regardless of language, language is very important for book use.
Because of these major differences between book and score use, this study will
scores to scores), calculating their percentage of expected use and ratio of borrowings to
holdings separately. After these comparisons, the study will compare overall book to
overall score usage. For the purpose of this study, scores will be defined as anything with
an LC or Dewey class beginning with M, and books as anything with a class of ML or
MT, even though a small minority MT books are technically classified as scores.
Subsections of scores analyzed for both percentage of expected use and ratio of
borrowings to holdings include keyboard music (M6–39.6), chamber music (M200–990),
orchestral music (M1000–M1268), secular vocal music (M1495–1998), and sacred vocal
music (M1999-2199). Additional analysis on only percentage of expected use (as these
designations are decided differently at the various libraries and so are not included in
interlibrary loan reports) will include the following subsections: LC folio scores, LC
miniature scores, LC regular scores, Dewey-classed scores, scores with parts, and scores
acquired within the last 3 years, 4–6 years ago, and 7–9 years ago. Dewey-classed scores
will not be included in these subsections, as the library has not classified using Dewey in
the recent past, and ILLs are not requested with Dewey classifications. Scores classed
with the Dewey system only continue at the library because it is prohibitively expensive
to reclass all of them at this time.
Subsections of books analyzed for both percentage of expected use and ratio of
borrowings to holdings will be ML410 (biographies of composers), ML416–429
(biographies of performers and other key figures), ML3505–3518 (Jazz), ML3520–3556
(Blues and Rock), and MT (music theory and instruction), several categories of foreign
languages, and a larger subset of all languages other than English. Additional analysis on
books at the offsite storage location, and books acquired within the last 3 years, 4–6 years
ago, and 7–9 years ago.
For those categories for which both percentage of expected use and ratio of
borrowings to holdings can be calculated, Mortimore (interpreting Ochola) sorts each
subsection into one of four categories by calculating each subsection’s deviation from the
mean. These four categories are shown in table 1. Positive deviation of percentage of
expected use from the mean and positive deviation of ratio of borrowings to holdings
from the mean would indicate that a larger percentage of the budget could be spent on
that category, while the opposite would suggest that a smaller percentage of the budget
should be spent on these areas. On the other hand, negative deviation of percentage of
expected use from mean and positive deviation of ratio of borrowings to holdings from
the mean might suggest that a section needs much more development to bring the
collection in line with patron use.
Table 1: Measuring Subject Area Use Characteristics, from Mortimore (2005, p.30)
The computation of a Subject Area Use Statistics table for this study turned out to
be more complicated than for Ochola’s study. While Ochola and Mortimore were
studying all of the LC sections, for the purpose of this study, only certain sections of the
LC classification were picked, while others were left out. Also, the categories were not
distinct, sometimes cutting across each other—for example, ML410s (composer
there are problems in calculating the mean and standard deviations of percentage of
expected use. For example, all of the LC book subsections selected had higher than
average circulation, meaning that even though several categories were obviously
circulating well above average, using Ochola’s methods, one of these categories would
deviate negatively from the mean. The opposite is true of the book language categories
collected—all but one language category (books in English) has lower than average
circulation. According to Ochola’s method, many of these foreign language categories
would still show “high” circulation despite this discrepancy. Assigning a mean to the
ratio of borrowings to holdings has a similar problem. Another shortcoming of Ochola’s
method is that there are only four categories, created by two binary distinctions. This
approach did not allow for a middle ground, which seems problematic in this type of
study, especially for the comparatively small sample size used here.
To create a more nuanced and accurate approach, instead of using a mean, this
study used the middle points of 100 percent PEU (or the same circulation as the
collection at large) and an RBH of 1. The study also adopted distinctions in groups of
three: positive, about equal, and negative. The cut-off points for these three categories
were chosen somewhat arbitrarily, based on the data collected, but reflected a middle
Study Limitations
While studying percentage of expected use and ratio of borrowings to holdings
could provide some general use feedback, there are numerous limitations to studying
circulation data in this way. First, the study does not take into account e-book usage.
Martell argues that library users are increasingly substituting virtual library use for
in-person use (Martell, 2008, p.406). For the most part, however, virtual use does not apply
to academic music monographs and scores because of the small number available at the
time of this study. Still, it will be unclear from this study if these books receive any or
higher than average usage in electronic form. Second, this system ignores multiple
checkouts; if a book has been checked out once, it receives just as much weight as a book
that has circulated fifty times. Also, recently acquired books are less likely to have
circulated. Third, this method deals expressly in relations and generalities and does not
suggest a way to increase overall music circulation. While this study could indicate what
type of books need more or less development, it does not indicate the specific books a
library should purchase to raise circulation rates. Fourth, circulation statistics do not take
into account books that receive use but are not checked out. This is especially important
with reference books and score monuments (M1–3), which cannot be checked out but
account for a sizable percentage of the collections development budget. Other books or
scores may just be copied for specific chapters or songs instead of being checked out. The
result is a significant percentage of books that will only artificially lower percentages of
usefulness to a patron; a title could be checked out but deemed unworthy for research
(Adams and Noel, 2008, p.72). Sixth, this method cannot directly estimate the costs
associated with purchasing items, though cost can be estimated by number of items.
Seventh, this study does not map subject demand over time, instead offering a monolithic
Results and Discussion
The first step in determining the relative checkout rate of library subsections is to
determine a baseline: the percentage of each larger section that has been checked out at
least once (see table 2, p.18). Although the circulation percentages for the UNC-CH
Music Library are lower than Cheug and Chung’s study of a liberal arts university, which
found that 64 percent of monographs had circulated in fifteen years (2011, p.424), table 2
does not tell the entire picture. Scores classed M1–3, which are in included in this count,
cannot be checked out, and a small selection of books are designated as reference books,
which also cannot be checked out. There are also a few non-circulating classed
periodicals classes with the books. The percentage of circulated scores is much lower
than Illinois’s 69 percent. UNC-CH’s lower percentage could be a reflection of Illinois’s
comparatively larger performance program, and also the shorter timespan of twenty
years, instead of the score’s entire shelf life. The librarians at the UNC-CH Music Library
think that total percentage of LC books that have circulated in the past twenty years (54
percent) is acceptable. The disparity between the circulation percentages of books and
scores is not surprising given the collection’s main use as a scholarly resource for the
Musicology Ph.D. program. The percentage of circulated LC books in foreign languages
given here was not used to calculate percentage of expected use, but simply for
comparison—although lower than the total book circulation, the reported 42 percent
Table 2: Circulation for Scores and Books in the UNC-CH Music Library
Category % circulated at least once, 1993-‐2013
% of ILL requests of scores and books, 2005-‐2013
All LC Scores 40 41
All LC Books 54 59
LC Books in foreign
languages 42 19
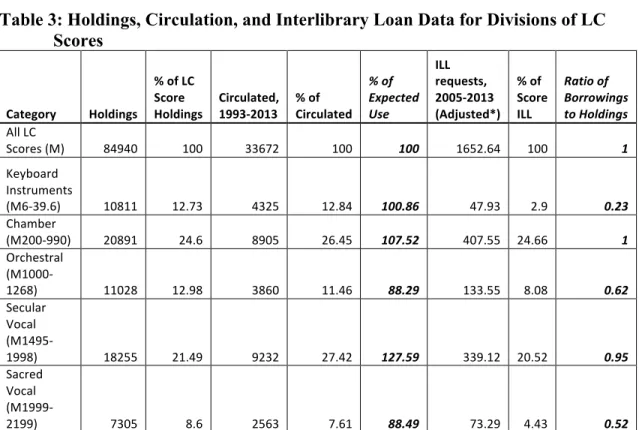
Table 3: Holdings, Circulation, and Interlibrary Loan Data for Divisions of LC Scores
Category Holdings
% of LC Score Holdings
Circulated, 1993-‐2013
% of Circulated
% of Expected Use
ILL requests, 2005-‐2013 (Adjusted*)
% of Score ILL
Ratio of Borrowings to Holdings
All LC
Scores (M) 84940 100 33672 100 100 1652.64 100 1
Keyboard Instruments
(M6-‐39.6) 10811 12.73 4325 12.84 100.86 47.93 2.9 0.23
Chamber
(M200-‐990) 20891 24.6 8905 26.45 107.52 407.55 24.66 1
Orchestral (M1000-‐
1268) 11028 12.98 3860 11.46 88.29 133.55 8.08 0.62
Secular Vocal (M1495-‐
1998) 18255 21.49 9232 27.42 127.59 339.12 20.52 0.95
Sacred Vocal (M1999-‐
2199) 7305 8.6 2563 7.61 88.49 73.29 4.43 0.52
*Audio and visual requests were not distinguished during 2005-‐2010; these numbers are estimated by subtracting estimated audio/visual requested, based on the percentages requested 2011-‐2013. See table 4.
Table 4: Percentage of Interlibrary Loan Requests in LC Class M of Audiovisual Formant, 2011-2013
Category
% of ILL materials requested in audiovisual format, LC class M, 2011-‐ 2013
All LC Scores (M) 22
Keyboard Instruments (M6-‐39.6) 32
Chamber (M200-‐990) 2.5
Orchestral (M1000-‐1268) 22.8
Secular Vocal (M1495-‐1998) 64
Also listed in table 2 (p.18) are requested materials as a percentage of all books
and scores requested through ILL. As expected, books are requested at a higher rate than
scores. Again, the foreign language books requested are not used for any calculations.
The figure 19 percent seen in table 2 is a subsection of the “All LC books” category; in
other words, foreign language materials account for a third of all ILL book requests.
Table 3 (p.18) lists the subsections of LC scores chosen for this study. These five
subcategories make up 80 percent of the all the LC scores in the music library and 72
percent of all scores. Two of the subsections studied (keyboard instruments and chamber
music) have PEUs close to the baseline, two subsections (orchestral and sacred vocal)
circulated lower than the baseline, and one section (secular vocal) circulated higher than
the baseline. These results are slightly different than expected, as chamber music
outperforms both keyboard music and orchestral music in circulation, and keyboard
music is in line with expected use instead of over-performing.
One important caveat about the sacred vocal section illustrates how circulation
statistics do not necessarily convey a collection’s worth. The UNC-CH Music Library has
a very large hymnbook collection that makes up a large portion of the sacred vocal
subsection. While this subsection is underperforming in circulation compared to all LC
scores, the collection is valuable in its own right and may be of use to future and visiting
scholars. Also, the layout of a hymnbook (a collection of separate pieces) may mean that
users are more likely to copy the one hymn they need, and the book will not circulate as a
result.
The second half of table 3 presents the estimated interlibrary loan requests for
as only in the past three years have the formats of the requested items been collected. For
those years, 2011–2013, the percentage of audiovisual materials was calculated for each
section. While the percentage ranges from 3 to 32 percent for four of the sections, 64
percent of requests in one section, secular vocal, were audiovisual materials (see table 4,
p.18). Assuming that 2005–2010 had a similar ratio of audiovisual materials, an estimate
of physical scores requested was calculated by multiplying each subsection total by the
percentage of non-audiovisual materials requested in 2011–2013. The same adjustments
were not made for books, as only a very small percentage of the items requested classed
ML and MT from 2011–2013 were audiovisual.
The adjusted ILL statistics show that while chamber music and secular vocal
music are requested in proportion to the libraries holdings, keyboard, sacred music, and
orchestral music are requested at a lower rate. While for keyboard music this could
suggest that the keyboard players are finding everything they need in the collection,
orchestral and sacred vocal music are perhaps not as popular with music library users as
other subsections. That all five subsection listed here have a ratio of borrowings to
holdings less than or equal to one might suggest that those subsections that were not
counted for the study (M40–199) account for relatively more requests than these.
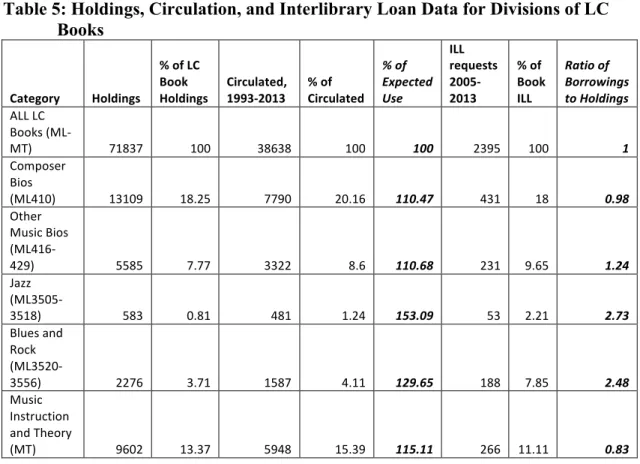
Table 5 (p.21) lists the subsections of LC books that were surveyed. All of the
subsections selected for study over-performed compared to the average book circulation.
The five subsections chosen for study here make up only 43 percent of the total LC book
holdings, however. Because these five subsections all have percentages of expected use
higher than 100 percent, it is probable that most of the other sections would have lower
Table 5: Holdings, Circulation, and Interlibrary Loan Data for Divisions of LC Books
Category Holdings
% of LC Book
Holdings Circulated, 1993-‐2013 % of Circulated
% of Expected Use
ILL requests 2005-‐ 2013
% of Book ILL
Ratio of Borrowings to Holdings
ALL LC Books (ML-‐
MT) 71837 100 38638 100 100 2395 100 1
Composer Bios
(ML410) 13109 18.25 7790 20.16 110.47 431 18 0.98
Other Music Bios (ML416-‐
429) 5585 7.77 3322 8.6 110.68 231 9.65 1.24
Jazz (ML3505-‐
3518) 583 0.81 481 1.24 153.09 53 2.21 2.73
Blues and Rock (ML3520-‐
3556) 2276 3.71 1587 4.11 129.65 188 7.85 2.48
Music Instruction and Theory
(MT) 9602 13.37 5948 15.39 115.11 266 11.11 0.83
Table 6: Holdings, Circulation, and Interlibrary Loan Data for Languages of LC Books
Category Holdings
% of LC Book
Holdings Circulated, 1993-‐2013 % of Circulated
% of Expected Use
ILL requests, 2005-‐ 2013
% of Book ILL
Ratio of Borrowings to Holdings
ALL LC Books (ML-‐
MT) 71837 100 38638 100 100 2395 100 1
English 42703 59.44 26290 68.04 114.47 1607 67.1 1.13
Not English 29134 40.56 12348 31.96 78.8 788 32.9 0.81
German 12523 17.43 4803 12.43 71.31 305 12.73 0.73
French 3594 5 1432 3.71 74.2 165 6.89 1.38
Italian 2890 4.02 1094 2.83 70.4 76 3.17 0.79
Spanish 1606 2.24 642 1.66 74.11 96 4.01 1.79
Russian 1496 2.08 467 1.21 58.17 16 0.67 0.32
Chinese 468 0.65 110 0.28 43.08 1 0.04 0.06
Multi-‐
The second half of table 5 shows the ILL requests for LC-classed books.
Although technically classed ML, requests classed ML1 and ML5 were excluded from
these ILL numbers, as the music library does not usually class periodicals (though there
are some exceptions, mostly for international periodicals) and would not have analogous
data in the circulation numbers. The high ratio of borrowings to holdings here shows that
library users not only check out these subsections of books, they often request similarly
classed materials, indicating that all subsections should be developed. Jazz, blues, and
rock materials, though relatively small subsections of the LC books, were especially
highly requested in comparison to library book holdings. Music theory and instruction
books, though highly circulated by library users, are not requested as often, suggesting
that most users are finding what they need in the library’s collections.
Table 6 (p.21) lists the breakdown of languages in the LC books in the music
library. While English language books over-perform foreign language materials by a
significant margin, foreign language books circulate at a rate similar to scores (see table
2, p.18). Foreign language materials account for 40 percent of the library’s holdings of
LC books. Unsurprisingly for music scholarship, German accounts for the largest
percentage of foreign language books circulated and requested. German, French, Italian,
and Spanish books together make up 71 percent of the foreign language books in the
UNC-CH Music Library. Yet, strangely, the percentage of expected use is higher for all
foreign language materials than for any of these four languages. While there is
uncertainty about the exact cause for this discrepancy, the reason could be procedural—
the current procedure for many foreign language books, especially those from
the books. This would result in higher-than-expected circulation, because these books all
arrive in the library with one checkout. This procedure may account for how one-fourth
of the Russian and Chinese books have been checked out, while these two languages are
hardly ever requested. Despite the few low statistics for these two languages, however,
this study is unlikely to change collection development practices for Russian and Chinese
books, as subject scholars in the main library purchase most of the materials in these
languages, without delving into the music library’s collection development funds.
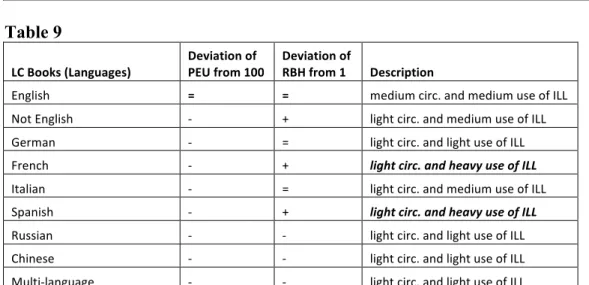
Analyzing the interlibrary loan data in second half of table 6 (p.21), more than
twice as many English books were requested as books not in English. French and Spanish
books, however, were requested at a higher rate than would be indicated by their use,
suggesting that these are languages that could use more development. It is important to
understand the limits of ratio of borrowings to holdings: although the ratio of borrowings
to holdings was much higher for Spanish and French than for German, music library
users requested more German books than French and Spanish combined.
The languages listed here account for most of the foreign language books
requested. There were 126 books requested that were not in any of the languages listed in
table 6 (p.21), though a third of these (47) are actually scores classed as MTs with no
language designation. Other languages requested but not listed here include Japanese,
Latin, Arabic, Dutch, and Czech. While English is by far the predominant language
requested, music library users require a variety of languages. With such small numbers of
language materials requested, however, a librarian may decide that interlibrary loan,
Tables 7–9: Deviation from the Norm and Interpretive Description of Use for LC Score and Book Subsections and LC Book Languages (with Key)
Key for tables 7–9
+ Greater than 115 (PEU) or 1.25 (RBH) = 85-‐115 (PEU) or 0.75-‐1.25 (RBH) -‐ Less than 85 (PEU or 0.75 (RBH)
Table 7
LC Scores Deviation of PEU from 100 Deviation of RBH from 1 Description
Keyboard Instruments (M6-‐39.6) = -‐ medium circ. and light use of ILL Chamber (M200-‐990) = = medium circ. and medium use of ILL Orchestral (M1000-‐1268) = -‐ medium circ. and light use of ILL Secular Vocal (M1495-‐1998) + = heavy circ. and medium use of ILL
Sacred Vocal (M1999-‐2199) = -‐ medium circ. and light use of ILL
Table 8
LC Books (Subsections)
Deviation of PEU from 100
Deviation of
RBH from 1 Description
Composer Bios (ML410) = = medium circ. and medium use of ILL Other Music Bios (ML416-‐429) = = medium circ. and medium use of ILL Jazz (ML3505-‐3518) + + heavy circ. and heavy use of ILL
Blues and Rock (ML3520-‐3556) + + heavy circ. and heavy use of ILL
Music Instruction and Theory (MT) + -‐ heavy circ. and medium use of ILL
Table 9
LC Books (Languages) Deviation of PEU from 100 Deviation of RBH from 1 Description
English = = medium circ. and medium use of ILL
Not English -‐ + light circ. and medium use of ILL German -‐ = light circ. and light use of ILL French -‐ + light circ. and heavy use of ILL
Italian -‐ = light circ. and medium use of ILL Spanish -‐ + light circ. and heavy use of ILL
Table 10: Holdings and Circulation for Score Categories without Interlibrary Loan Data
Category Holdings
% of LC Score
Holdings Circulated, 1993-‐2013 % of Circulated
% of Expected Use
All LC Scores 84940 100 33672 100 100
LC Folio Scores 2587 3.05 553 1.64 53.77
LC Miniature
Scores 4830 5.69 1685 5 87.87
LC Regular Scores 72242 85.05 29412 87.35 102.7
Scores with Parts 15623 18.39 7611 22.6 122.89
LC Scores Added
2011-‐2013 7627 8.98 1157 3.44 38.31
LC Scores Added
2008-‐2010 6214 7.32 1787 5.31 72.54
LC Scores Added
2005-‐2007 8879 10.45 2536 7.53 72.06
Table 11: Holdings and Circulation for Dewey-Classed Scores
Category Holdings
% of score
holdings Circulated, 1993-‐2013 % of Circulated
% of Expected Use
All LC and
Dewey Scores 95440 100 35749 100 100
Dewey Scores 10500 11 2077 5.81 52.82
Table 12: Holdings and Circulation for Book Categories without Interlibrary Loan Data
Category Holdings
% of LC Book
Holdings Circulated, 1993-‐2013 % of Circulated
% of Expected Use
ALL LC Books
(M) 71837 100 38638 100 100
LC Folio Books 1262 1.76 511 1.32 75
LC Books at LSC 1955 2.72 453 1.17 43.01
LC Books Added
2011-‐2013 6086 8.47 2384 6.17 72.85
LC Books Added
2008-‐2010 7062 9.83 4176 10.81 109.97
LC Books Added
Tables 7 through 9 (p.24) show a summary of the percentage of expected use
(PEU) and ratio of borrowings to holdings (RBH) findings, including a key displaying
cut-off points for category divisions. As the RBH values were somewhat more varied
than the PEU values, with smaller numbers and therefore more margin for error, the
middle range distribution is wider. The subsections mentioned above that could receive
additional attention are highlighted: secular vocal scores; jazz, rock, and blues
monographs; and French and Spanish monographs. Certainly the original hypothesis that
chamber music scores were underperforming was disproved, and while foreign language
materials are underperforming compared to English-language books, they still have
higher circulation than expected.
Tables 10 through 12 (p.25) present circulation data for those subsections for
which circulation was collected but corresponding ILL data was not available. These
statistics were collected because the use of these subsections was important to the
librarians at the music library. Of the score subsections examined here, the only one with
higher than average percentage of expected use was scores with parts, meaning scores
that had additional, separated pages for performance by multiple instruments. As the
UNC-CH Music Library does not collect parts for orchestral music, scores with parts are
almost entirely located within the chamber music classification (M200–M990). However,
the higher percentage of expected use for scores with parts than for the larger chamber
music subsection might suggest that chamber music that can be used for performance is
more in demand than study scores that do not contain parts.
With regard to percentage of circulation according to date acquired, while
cataloged fields have not. Because of this, to determine the circulation rates of recent
materials, the study was limited to the previous nine years. In tables 10 and 12 (p.25), the
nine-year range has been divided up into three three-year segments.
It is not surprising that books and scores purchased in the last three years have a
fairly low percentage of expected use—studies of medical monographs show that peak
circulation comes between three and seven years after acquisition, and there may be a
similar trend for music materials (Eldridge, 1998, p.499 and Blecic, 2000, p.145). Also,
circulation has been decreasing in all libraries in recent years. What is surprising is that
books acquired in 2008–2010 are already over-performing, suggesting that currency is
important in music monograph selection. The scores acquired in those same years, on the
other hand, are still underperforming, In fact, scores purchased in the older subsection,
2005–2007 are also significantly underperforming compared the baseline score
circulation, suggesting that most of the scores that have circulated in the past 20 years
were acquired before 2005. Perhaps brand new music is not a priority for study or
performance, though of course many of the “new” scores acquired are actually new
editions of older works.
While LC scores have been the focus of this study, the library does retain a
collection of Dewey-classed scores, materials that for the most part are not duplicated in
the LC collection. As the library does not collect new Dewey scores, table 11 (p.25) was
generated for internal use only. The circulation figures in table 11 show that while Dewey
scores do get some use, their use is comparatively low.
According to table 10 (p.25), LC folio scores circulate almost as rarely as the
going to be oversized. Somewhat surprisingly, the miniature scores are also
underperforming, though not by as large a margin as the LC folio or Dewey scores. It is
possible that these lower percentages of expected use are a result of locating these
subsections of scores away from the regular scores, which may make these specialized
sizes more difficult to find for library users.
Regarding table 12 (p.25), folio books share a low percentage of expected use
similar to folio scores, though not quite as low. The lowest percentage of expected use for
a subsection in table 12 is for books at the Library Service Center (LSC), which is the
offsite storage facility at UNC-CH. The music library started to send books to the LSC in
2001. Books are sent to the LSC if they are expected to have low use, and this study
confirms that these books circulate at a lower percentage than the rest of the collection.
Statistics for scores at the LSC were not collected because the library does not normally
Conclusion and Future Studies
This study has demonstrated that the relative circulations of subsections of an
academic library can be studied to determine what materials are being utilized and
requested. At the UNC-CH Music Library, the overall recorded circulation percentages of
books and scores were unsurprising, with books circulating at a higher percentage than
music scores. Foreign language books, though circulating at a lower percentage than
English language books, circulated somewhat unexpectedly at about the same rate as
scores. Several categories of materials may warrant consideration for increased collection
development in the music library: secular vocal scores, jazz and popular music books,
and French- and Spanish-language books. Chamber music scores and scores with parts,
though expected to have relatively low circulation, in fact had slightly higher relative
circulation. While books acquired over three years ago had already exceeded the baseline
circulation percentage, scores acquired up to nine years ago still had not yet risen to the
baseline circulation percentage.
This study also highlighted some of the limitations of using circulation data to
assess collection development needs for budget purposes. First, the value of a collection
may not rest on entirely its circulation. Second, the collection development of some of a
library’s materials may be independent of its own budget, as in the case of foreign
language materials purchased by area specialists. Third, subject demand changes over
time, change that is difficult to track with circulation numbers. For example, the
students in this program are pursuing popular music topics at the moment, the next wave
of faculty and students may have other interests. For these reasons, it is important to
balance librarian-selected just-in-case and patron-driven just-in-time models for
collection development decisions.
The limitations and shortcomings of this study suggest possible future studies of
relative circulation for collection development in branch libraries. For similar studies, it is
recommended to divide up sections comprehensively, instead of simply picking
subsections of interest to the librarians as done in this study. While limiting was
important in this study due to time restrictions, this study may have missed some possibly
surprising results, for example, in the 57 percent of music books that were not studied as
subsections. The means and deviations from the mean of percentage of expected use and
ratio of borrowings to holdings are reliably calculated from a full LC range. The addition
of e-book usage would also add dimension to the findings. Another category not studied
was books and scores received as gifts—unfortunately, the way gifts are designated had
not been standardized in cataloging practice until recently, and so it proved impossible to
get accurate numbers over more than a few years. Another possible future study
combines this relative circulation methodology with one that examines multiple
checkouts. This type of study would separate well-used books with those that have only
been used once, such as the foreign press books that have only been checked out for
preservation purposes and not for research.
While the results of this study may not be surprising enough to warrant drastic
change in collection development practices at the UNC-CH Music Library, the study did
was beneficial in itself. As there are very few studies regarding the circulation of music
materials specifically, other music libraries can also compare the circulation of
subsections of their collections with the statistical models provided here. Other academic
branch libraries interested in analyzing the relative circulation of subsections of their
collection could also benefit from using the methodology laid out in this study, dividing
up sections as best fits their collections. The study’s methodology of comparing
circulation to an overall library baseline allows librarians to compare to their own
specifications, instead of having imposed circulation goals, and tailor their collection
development priorities to recent broad patron needs without relying solely on individual
Bibliography
Adams, B. and Noel, B. (2008). Circulation statistics in the evaluation of collection
development. Collection Building 27(2): 71–73.
Baunach, K.S. (2012). Prices of music monographs and scores as reflected in Notes,
2006–2011. Notes 69(2): 260–267.
Blecic, D. D. (2000). Monograph use at an academic health sciences library: the first
three years of shelf life. Bulletin of the Medical Library Association, 88(2): 145–
151.
Britten, W. (1990). A use statistic for collection management: the 80/20 rule revisited.
Library Acquisitions: Practice and Theory 14(2): 183–189.
Comer, A. and Lorenzen, E. (2005). Biz of acq–is purchase-on-demand a worthy model?
Do Patrons Really Know What They Want? Against The Grain 17(1): 75–78.
Cheung, S., et al. (2011). Monograph circulation over 15 years in a liberal arts university.
Library Management 32(6): 419–434.
Dinkins, D. (2003). Circulation as assessment: collection development policies evaluated
in terms of circulation at a small academic library. College & Research Libraries
64(1): 46–53.
Eldredge, J.D. (1998). The vital few meet the trivial many: unexpected use patterns in a
monograph collection. Bulletin of the Medical Library Association 86(4): 496–
503.
Galvin, T.J., and Kent, A. (1977). Use of a university library collection: a progress report
on a Pittsburgh study. Library Journal 102(20): 2317–2320.
Gillie, E. and Teper, T. (2005) Assessing the University of Illinois at
Urbana-Champaign’s score collection. Notes 61(4): 939–957.
Knievel, J.E., Wicht, H., & Connaway, L.S. (2006). Use of circulation statistics and
interlibrary loan data in collection management. College & Research Libraries
Martell, C. (2008). The absent user: physical use of academic library collections and
services continues to decline 1995-2006. The Journal of Academic Librarianship
34(5): 400–407.
Mortimore, J.M. (2005). Access-informed collection development and the academic
library. Collection Management 30(3): 21–37.
Ochola, J.N. (2002). Use of circulation statistics and interlibrary loan data in collection
management. Collection Management 27(1): 1–13.
Regazzi, J.J. (2012). Constrained? An analysis of U.S. academic library shifts in
spending, staffing, and utilization, 1998–2008. College & Research Libraries
73(5): 449–468.
Rose-Wiles, L.M. (2013). Are print books dead? An investigation of book circulation at a
mid-sized academic library. Technical Services Quarterly 30(2): 129–152.
Sandor, D. (2008). Improving availability of print collections: a case study at the
College-Conservatory of Music Library. MLA Forum 6 (2008).
Tyler, D.C., Falci, C., Melvin, J.C., Epp, M., and Kreps, A. (2012). Patron-Driven Acquisition and Circulation at an Academic Library: Interaction Effects and Circulation Performance of Print Books Acquired via Librarians’ Orders,
Approval Plans, and Patrons’ Interlibrary Loan Requests. Collection Management