Sharif University of Technology
Scientia IranicaTransactions B: Mechanical Engineering www.scientiairanica.com
The application of suction and blowing in performance
improvement of transonic airfoils with shock control
bump
K. Mazaheri, A. Nejati
and K. Chaharlang Kiani
Center of Excellence in Aerospace Systems, Sharif University of Technology, Tehran, Iran. Received 26 July 2015; received in revised form 30 January 2016; accepted 7 March 2016
KEYWORDS Transonic airfoil; Shock wave; Drag reduction; Shock control bump; Suction;
Blowing;
Adjoint optimization; Hybrid ow control tools.
Abstract. Shock Control Bump (SCB) reduces the wave drag in transonic ight. To control the boundary layer separation and to reduce the wave drag for two transonic airfoils, RAE-2822 and NACA-64A010, we investigate the application of two ow control methods, i.e. suction and blowing, to add them to the SCB. An adjoint gradient-based optimization algorithm is used to nd the optimum shape and location of SCB. The performance of both Hybrid Suction/SCB (HSS) and Hybrid Blowing/SCB (HBS) is a function of the sucked or injected mass ow rate and their position. A parametric study is performed to nd the near optimum values of the aerodynamic coecients and eciency. A RANS solver is validated and used for this ow analysis. Using HSS method, the aerodynamic eciencies of these two airfoils are increased by, respectively, 8.6% and 3.9%, in comparison to the airfoils with optimized bumps. For HBS conguration, improvements are respectively 13.5% and 9.0%. The best non-dimensional mass ow rate for suction is found to be around 0.003 for both airfoils, and for blowing this is about 0.0025 for RAE-2822 airfoil and about 0.002 for NACA-64A010. The best locations for suction and blowing are found to be, respectively, right before and after the SCB.
© 2017 Sharif University of Technology. All rights reserved.
1. Introduction
Occurrence of dierent physical phenomena including shock waves, Shock Wave/Boundary Layer Interaction (SWBLI), bueting, and shock oscillations make air-craft design in transonic ight regime one of the most challenging issues in aerodynamics. The concept of adaptive aerodynamic surfaces is proposed to achieve higher lift and lower drag coecients, bueting de-lay [1,2], and improved ight maneuverability. Many dierent ow control methods, e.g. boundary layer suction/blowing, vortex generators, geometrical
adap-*. Corresponding author. Tel.: +98 21 66164631 E-mail addresses: [email protected] (K. Mazaheri); a [email protected] (A. Nejati); [email protected] (K. Chaharlang Kiani)
tation, cavities, and porous surfaces, have been widely studied to control the eects of shock waves in the transonic ight [3]. In 1999, Ashill and Fulker [4] introduced the idea of local wing deformation in the vicinity of the shock wave to reduce the strength of the shock wave. This was called a Shock Control Bump (SCB). Since then, this idea has been studied and developed by many researchers [5-10].
To increase applicability of SCBs in the transonic ight, two recent studies show that using optimized shape of the SCB after the drag divergence Mach number may signicantly improve the aerodynamic performance of the transonic airfoils in o-design ight conditions [5,6]. It is veried that the SCB is more eective than many other ow control methods (e.g., the blowing, cavity, and the suction methods) [7]. Another study has shown that an SCB is more eective
than the surface cooling or warming [8]. In [9], the performance of SCBs in many dierent ow conditions is investigated. Recently, many people have considered its hybrid performance in combination with other ow control schemes, such as blowing and suction. In [3], the use of suction upstream of the shock wave and in front of the SCB is studied. Recently, combination of suction with blowing has also been investigated [10].
This article studies the eects of suction and blow-ing on the physics of strong shock waves over SCBs, and improves their performance. The main factor aecting performance of an SCB in the transonic regime is the generation of vortical separated ow stimulated by tall SCBs. Here, we focus on improving SCB perfor-mance by boundary layer separation control. Shock Wave/Boundary Layer Interaction (SWBLI) usually results in rapid boundary layer separation. When the shock wave is strong enough, separation occurs right after the shock wave. Most recent optimization inves-tigations focus on low transonic Mach numbers with a relatively weak shock wave, which do not stimulate a rapid boundary layer separation. Researchers usually only study the overall aerodynamic coecients and eciency, and neglect concern regarding the separated regions over the control devices. In this article, we also investigate boundary layer growth and separation after shock waves induced by the transonic ow with dierent Mach numbers. This brings a new insight to the physics of SCB and how and when it is practically eective. We show that this boundary layer analysis will signicantly help us to design more eective hybrid ow control methods. The hybrid schemes are much more eective than simple ow control methods, since not only they improve the aerodynamic coecients, but also they prevent formation of large separated ow regions, which is a serious concern for controlling the surface design.
Many elements of this research are new contribu-tions to the subject of SCB design, including the appli-cation of suction/blowing for the vortical ow control, the physical analysis of the boundary layer structure around the suction/blowing region, and geometrical modeling of the suction/blowing channel (instead of the usual modeling based on simulated boundary condi-tions [11], which is certainly inappropriate for accurate simulation of boundary layer interactions). These are all applied to two benchmark transonic airfoils (i.e., NACA-64A010 and RAE-2822). We itemize contributions of this research as the following:
Comparison of suction and blowing eects on the separated boundary layer induced by the SCB;
Numerical modeling of the suction/blowing channel;
A parametric study on the eect of the suc-tion/blowing \location", the non-dimensional \mass ow", and \momentum" on the separated region;
Quasi-optimization of HSS and HBS using a para-metric study.
2. Shock control bump
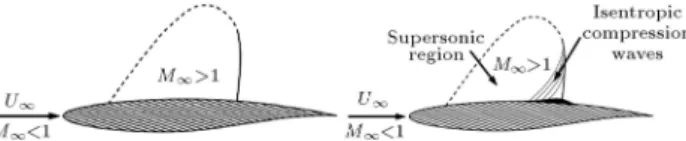
Shock control bumps are used to reduce undesirable eects of strong shock waves over aerodynamic surfaces in transonic conditions. The bump geometry and its position are designed so that some isentropic compres-sion waves are formed when ow moves upward the bump (Figure 1). Passing through these isentropic compression waves, the ow velocity is gradually re-duced and the pressure is gradually increased (instead of sudden changes). Downhill the bump, we have some expansion waves and then, the ow adjacent to the wall passes through a weakened shock wave. The generated wave drag in this process is less than that induced by the original normal shock.
The performance of the bumped airfoil is very sensitive to shape and location of the bump. Extensive studies are devoted to the design of its shape and location [12]. This, of course, is a function of airfoil shape and ight conditions. These studies may be divided into two dierent categories: (a) parametric studies, e.g. [12]; and, (b) performance improvements, e.g. [13]. The idea of SCB is also extended to 3D wing applications, e.g., Wong et al. [14] have studied the drag reduction of a transonic plane via an SCB. However, since most SWBLI interactions are visible in a 2D analysis, for simplicity, we restrict ourselves to two-dimensional analysis here.
3. Suction and blowing on an airfoil surface The ow suction or blowing over an airfoil surface is used to give energy or remove stagnant uid in the boundary layer, to overcome the adverse pressure gradient eects, and to prevent boundary layer growth and detachment after the shock wave. Suction and blowing have been used for a long time to control the boundary layer separation. The main purpose for using suction is to remove the low-energy boundary layer;
while using blowing, we energize the boundary layer and change the velocity prole. This will enhance the velocity prole and delay the occurrence of an inection point and separation from the wall.
Suction has a signicant eect on the aerody-namic performance. Basically, appropriate ow suction can control (decrease) the growth of boundary layer thickness, and may result in total drag reduction by reducing drag due to viscous eects. In ONERA, Le Balleur et al. [15] showed that the ow suction before the shock wave could reduce the total drag of RAE-5225 airfoil by 5.1%; but, if located after the shock, it would not reduce the wave drag. Another example of the drag reduction using ow suction upstream of the shock wave is the experimental research performed at Karlsruhe University [3] on DRA-2303 airfoil. A comprehensive study was performed on the location of the suction region as well as the eects of dierent suction mass ow rates. The main nding of this study was that the total drag reduction might vary from 2.5% up to 4.9%, based on values of ow and location parameters.
In 2006, Vadillo et al. [11] numerically investi-gated the reduction of shock wave strength and other undesirable eects of SWBLI in transonic ow regimes through usage of the boundary layer suction. They showed that by variations of amplitude, frequency, mass ow, and location, one can improve the aero-dynamic coecients including lift, drag, and bending moment.
In [16], Pehlivanoglu et al. used suction and blowing to improve the aerodynamic performance of transonic airfoils. It is observed that the aerodynamic performance increases by over 20% as a result of opti-mizing the location, angle, and mass ow coecient of the suction and blowing control ports on the airfoil sur-face at transonic speeds. Pehlivanoglu and Yagiz [17] used the active and passive ow control methods to improve the aerodynamic performance of transonic airfoils. In this research, they optimized the suction and blowing parameters with genetic algorithm.
4. Hybrid ow control methods
One expects that simultaneous usage of two or more ow control methods (e.g., shock control bump with suction or blowing), shown schematically in Figure 2, would result in a better aerodynamic performance. The advantage of using SCBs with suction is that
suction upstream of the shock wave gives momentum to the boundary layer and makes it thinner, thereby preventing ow separation and reducing losses due to viscous eects initiated by tall bumps and SWBLI. By importing momentum to the boundary layer, the blowing after the shock wave can also prevent the boundary layer thickening and separation after the bump and, consequently, reduce the drag coecient.
Birkemeyer [18] equipped the swept ADIF wing with SCB and ow suction upstream of the shock wave, and investigated the aerodynamic performance of the wing with dierent angles of attack. Results showed that SCB alone reduced the total drag only 8%, but along with moderate suction resulted in 12% reduction in the total drag, while by strong suction reduced it by 22%.
In 2000, Qin et al. [19] released results of some of their parametric studies on ow control methods in transonic speeds. Three dierent control schemes, i.e. suction, blowing, and SCB, were investigated on an RAE-5243 airfoil to understand their eects on SWBLI. They showed that suction and SCB might increase the aerodynamic eciency independently. Blowing around the shock wave location may reduce the shock strength, but it may improve the aerodynamic performance only when applied near the trailing edge. This study was extended in 2004 by Qin et al. [7]. They did not report details of their parametric study and only showed the best combination. They also did not discuss eects of independent parameters (they only provided a partial discussion on the height and position of SCB).
Yagiz et al. [10] have also extensively investigated eects of ow control schemes to improve the perfor-mance of RAE-5243. Using the gradient optimization algorithms, they have been able to decrease the drag coecient by 3.94% and increase the lift coecient by 5.04%. They used an ecient gradient-based optimization technique to optimize the 2D bump parameters including length, maximum height, bump position via shock location, and crest position via bump and also the jet actuation parameters such as the mass ow coecient, suction/blowing angle, and the actuation location over the upper surface of the airfoil. Their results indicate that the enhancement in the lift, the decrement in the total drag, and the mitigation of the shock strength can be obtained by using a 2D contour bump. At the same time, the surface suction decreases the drag with an increment in lift value.
5. Problem denition
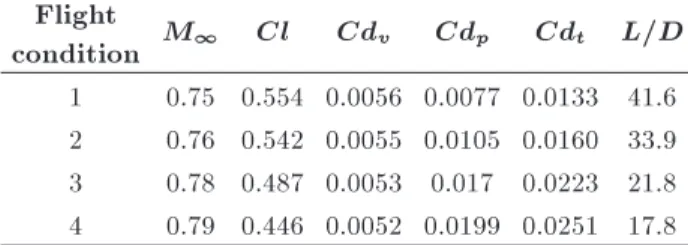
Here, we investigate the simultaneous usage of SCBs with two other ow control schemes. First, we use an optimization algorithm to minimize the drag coecient by optimization of the bump geometry parameters for two benchmark supercritical airfoils in o-design conditions, i.e. RAE-2822 and NACA-64A010 airfoils. Then, we add suction or blowing to enhance the SCB performance when the ow is separated because of relatively larger bumps. For comparison purposes, the original aerodynamic coecients for several dierent o-design ow conditions are shown in Tables 1 and 2. Throughout this article, we use these ight conditions as the basis for our comparisons. Here, Cd and Cdp
denote the friction and the pressure drags, respectively. Figure 3 shows the drag divergence diagram for RAE-2822.
In the case of suction and blowing, mass is removed from or injected to the ow around the airfoil. From the conservation of momentum, or Newton's second law, there will be a force acting on the aerofoil in addition to the pressure and skin-friction forces acting on the external surfaces of the aerofoil. In these cases, the present studies are limited only to isolated eects of suction and blowing on the forces acting on the aerofoil. Therefore, there is no contribution to the lift and drag forces from the sucked or injected mass ow.
6. Modeling the bump geometry
In this research, the Sine-function with minor improve-ment with respect to [12] is used to model the bump geometry. Hicks-Henne (Eq. (1)) is a sine-function that is able to create bumps with dierent heights, slopes, asymmetries, and lengths. One of the features of this function is that the slope of the curve is equal to zero
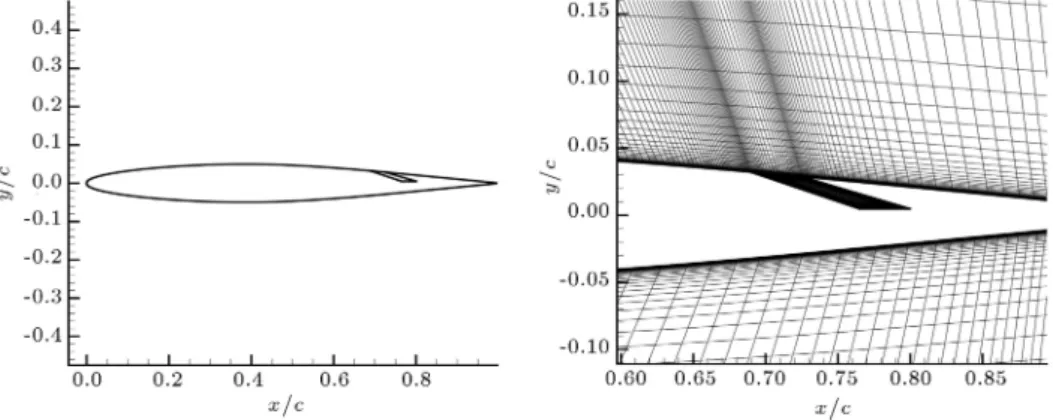
Table 1. Four ight conditions for optimization; RAE-2822, Re1= 7:6 106, and = 1:5.
Flight
condition M1 Cl Cdv Cdp Cdt L=D 1 0.75 0.554 0.0056 0.0077 0.0133 41.6 2 0.76 0.542 0.0055 0.0105 0.0160 33.9 3 0.78 0.487 0.0053 0.017 0.0223 21.8 4 0.79 0.446 0.0052 0.0199 0.0251 17.8 Table 2. Three ight conditions for optimization; NACA-64A010, Re1= 7:6 106, and = 2:0.
Flight
condition M1 Cl Cdv Cdp Cdt L=D 1 0.77 0.394 0.0055 0.0069 0.0124 31.8 2 0.786 0.379 0.0054 0.0106 0.0160 23.8 3 0.81 0.345 0.0052 0.0181 0.0233 14.8
at both ends (f0(0) = f0(1) = 0). This prevents
formation of any discontinuity between the airfoil and the bump. Eq. (1) describes the Hicks-Henne function. In this equation, hB is the maximum bump height, t
represents the slope parameter, and x represents the non-dimensional length parameter with respect to the bump length (lB). All the geometrical details are
shown in Figure 4.
f(x) = hB(sin(xm))t; 0 x 1: (1)
In Eq. (1), the parameter m, dened by Eq. (2), is used to create asymmetric bumps. Here, CB=lB represents
the degree of asymmetry and is in the range of (0,1), see Figure 4. CB=lB = 0:5 represents a symmetric bump.
m = ln(cln(0:5)
B=lB): (2)
The other important parameter is x0, the beginning
of the bump on the airfoil surface (Figure 4). The range of variations in the bump geometry parameters in this article is given below (all the variables are non-dimensional with respect to the airfoil chord length).
8 > > > > > > < > > > > > > :
0 hB 0:01c
0:3 x0=lB 0:55
0:4 cB=lB 0:85
0:5 t 2 0:15 lB 0:3
(3)
Figure 3. The drag divergence diagram for RAE-2822 at = 1:5.
Figure 4. The geometrical design parameters for shock control bump.
Limits of dierent design variables are selected by considering various references such as [12,13]. In the optimization process, in order to reach a more realistic design, 15% of the airfoil trailing part is devoted to the ap; thus, the bump should be located ahead of this region.
7. Governing equations of the ow
The integral form of the governing equations for each computational cell is introduced in Eq. (4). Here, w, fc, and fv stand for the conservative variable vector,
the convection ux vector, and the viscous ux vector, respectively. In Eq. (5), the conservative variable vector in 2-D space is shown. Here, is density, u and v are velocity components, E is total energy, H is total enthalpy, V (contra-variant velocity) is the velocity normal to each cell face, and is tensor of shear stress. @ @t Z ! Ud + I @ !f
c !f
ds = 0; (4)
!U = 2 6 6 4 u v E 3 7 7
5 ; !fc =
2 6 6 4
V uV + nxp
vV + nyp
HV 3 7 7 5 ; ! fv =
2 6 6 4
0 nxxx+ nyxy
nxyx+ nyyy
nxx+ nyy
3 7 7
5 : (5)
V , x, and y are dened in Eqs. (6) and (7) while nx
and nyare components of the unit vector perpendicular
to the cell faces.
V = nxu + nyv; (6)
x= uxx+ vxy+ k@T@x;
y = uyx+ vyy+ k@T@y: (7)
Here, a nite volume method is used for ow eld discretization. The ux across each cell face is approx-imated using Roe ux dierence splitting method. fc
(convection ux vector) is computed for each cell face by: ~fc I+1=2= 1 2 h ~fc ~UR +~fc ~UL
ARoeI+1=2
~UR ~UL
i
: (8) Here, jARoejI+1=2 is the Jacobean of the convection
ux vector and is computed as follows:
eARoe I+1=2
~UR ~UL
=~f1+~f2;3:4+~f5 ;
(9)
~f1 = ~V ~c
p ~~cV 2~c2 26 6 4 1 ~u ~cnx
~v ~cny
~ H ~c~V
3 7 7
5 ; (10)
~f5 = ~V + ~c
p + ~~cV 2~c2
26 6 4
1 ~u + ~cnx
~v + ~cny
~ H + ~c~V
3 7 7
5 ; (11)
~f2;3;4 = ~V
p~c2 26 6 4 1 ~u ~v ~ q2 2 3 7 7 5
+ ~ ~V 2 6 6 4
0 u V nx
v V ny
~uu + ~vu V V~ 3 7 7
5 : (12)
Here, the () operator is dened as () = ()R
()L, where R and L denote the right and the left sides
of each cell face, respectively. For more details about the Roe averaged variables, please see [20]. The second order of accuracy is achieved by MUSCL scheme [20]:
UR= UI+1 12R;
UL= UI+12L; (13)
= a(b2a+ ") + b(a2+ b2+ 2"2+ ");
aR= +UI+1; bR= UI+1;
aL=+UI; bL= UI; (14)
+UI = UI+1 UI;
UI = UI UI 1: (15)
Here, I denotes the cell number, while R and L subscripts denote the properties exactly over the right and left sides of each cell face. In Eqs. (13), (14), and (15), U can be any ow variable. The equations for k ! turbulence modeling in the ow eld are based on Eqs. (16) and (17) [21].
@
@t(K) + @
@xi(Kui) =
@ @xj
+t
k
@K @xj
+ Gk Yk+ Sk; (16)
@ @t(!) +
@
@xi(!ui) =
@ @xj
+t
!
@! @xj
+ G! Y!+ S!: (17)
Here, subscripts k and ! denote variables associated with the turbulence energy and the specic dissipation rate.
8. Boundary conditions
The free stream conditions are applied as the far eld boundary conditions. A no-slip condition is used on the airfoil surface and the channel walls (see Figure 5). Over the suction or blowing regions, the average veloc-ity of the inlet/outlet velocveloc-ity proles is dened as:
Uave= m
P
Lsuction
sbs; (18)
where subscript sb denotes the channel inlet, and the non-dimensional mass ow is dened as:
CQ= m
1U1c: (19)
In the above, c is the chord. For suction, CQ is
negative and it is positive for blowing. In the exit of channel, pressure outlet or inlet boundary condition is implemented.
9. Validation of the ow solver
Here, a 2D nite volume Navier-stokes RANS solver, which is developed at CEAS (Center of Excellence in Aerospace Systems, Sharif University of Technology), is used as ow solver [22]. To validate the ow solver, transonic ow around a supercritical airfoil RAE-2822 is simulated on 43:4 GHz CPUs. The ow conditions are Mach number (M1= 0:75), the Reynolds number
(Re1= 6:2106), and the angle of attack ( = 3:03).
The generated C-type mesh is shown in Figure 6. Using grid independency study shown in Table 3, an acceptable grid is chosen that includes 300 nodes on the airfoil surface, 100 nodes in the wake region, and 75 nodes in the vertical direction (see Table 3). The aerodynamic coecients, distribution of the surface pressure coecient, and the skin friction coecient, compared with the experimental results in [23] are respectively presented in Table 3 and Figure 7.
Figure 5. The suction channel over airfoil NACA-64A010 at x=c = 0:69.
Table 3. The validation data for RAE-2822 airfoil. Coarse
grid-1
Coarse grid-2
Coarse grid-3
Fine grid-1
Fine grid-2
Exp. results [23]
Num. results [23]
Number of cells 23800 26200 30700 35200 37500 | 16384
Cl 0.744 0.743 0.743 0.744 0.743 0.742 0.743
Cd 0.0277 0.0269 0.0262 0.0253 0.0251 0.0242 0.0255
Figure 7. The pressure and the skin friction coecient distribution for RAE-2822 airfoil.
10. Modeling suction/blowing on the airfoil surface
To model suction or blowing, a channel is used over the airfoil surface, as shown in Figure 5, and, using a pressure dierence between its inlet and outlet, the ow is sucked in or blown out of the airfoil. The channel geometry includes three main parameters: xs=b, Ls=b,
and s=b. xs=b denotes the distance between the
suction/blowing initial point and the leading edge. Ls=b is the width of the entrance channel (these two
parameters are non-dimensionalized with the airfoil chord). s=b is the suction/blowing inclination angle.
As an example, the NACA-64A010 airfoil with suction parameters xs=b = 0:69c and Ls=b = 0:025c
is shown in Figure 5. The suction ow angle, s=b,
is -20 with respect to the chord line. A multi-block
grid is used; the rst block consists of the ow around the airfoil and the second block includes the region inside the channel. After the grid independency study, comparison of the lift and the drag coecients (Mach number: M1 = 0:78, Reynolds number: Re1 =
2:9 106, and angle of attack: = 0:5) with the
numerical and the experimental results given in [7] is shown in Table 4. The non-dimensional mass ow equals CQ= 0:00225 [7].
11. The optimization results
In the transonic ow, the pressure coecient distri-bution on the upper surface is highly sensitive to the surface shape changes and this sensitivity makes the optimization scheme very eective. Thus, we use a very precise optimization algorithm for optimizing the shape of the wall (bump) and a much simpler optimization algorithm for suction and blowing in the next section. In this research, the gradient-based steepest de-scent algorithm is used to nd the optimum point. Therefore, minus of the gradient vector shows the opti-mization direction. The optiopti-mization process begins by a guess of the initial values of design variables. Then, in a repetitive process, we proceed through the maximum descent direction of the cost function to reach the optimum point (for details on the steepest descent method, see [5]). To apply geometrical constraints to our design parameters, we have used external
Table 4. The validation data for NACA-64A010 airfoil including suction. Coarse
grid-1
Coarse grid-2
Coarse grid-3
Fine grid-1
Fine grid-2
Exp. results [7]
Num. results [7]
Number of grid cells 24500 26500 29500 40200 42500 | 12285
Cl 0.281 0.28 0.281 0.282 0.282 0.24 0.279
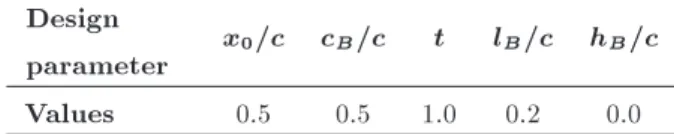
Table 5. The initial values for design parameters. Design
parameter x0=c cB=c t lB=c hB=c
Values 0.5 0.5 1.0 0.2 0.0
Table 6. The bump optimization results for RAE-2822. Flow
condition x0=c cB=c t lB=c hB=c 1 0.503 0.536 1.289 0.261 0.00439 2 0.523 0.522 1.244 0.303 0.00847 3 0.541 0.544 1.223 0.299 0.00991 4 0.530 0.532 1.238 0.308 0.0101 Table 7. The bump optimization results for
NACA-64A010. Flow
condition x0=c cB=c t lB=c hB=c 1 0.375 0.567 0.983 0.296 0.00632 2 0.444 0.622 0.789 0.298 0.00998 3 0.471 0.578 0.587 0.298 0.0104
penalty function scheme based on [5]. Validation of the optimization algorithm is straightforward [5] and not repeated here. One needs to use an inverse design problem. The common practice is to use a conven-tional airfoil, modeling its surface with a few design parameters. Then, the model is perturbed and given the correct pressure distribution of the original airfoil; the algorithm should nd the airfoil shape in a few optimization cycles.
For each ight condition stated in Tables 1 and 2, we use an adjoint gradient based optimization algorithm (based on [24]) to nd optimum values for the bump parameters towards the least drag coecient. Table 5 shows the initial values of the selected ve design parameters. The angle of attack is xed and the initial bump has zero height. The optimization results are given in Tables 6 to 9. As expected, increase in the free stream Mach number results in increasing bump height.
Respective comparison of Tables 8 and 9 with
Tables 1 and 2 shows that the SCB reduces the drag coecient and increases the aerodynamic eciency in all ight conditions. Based on these tables, one observes that for both airfoils, the maximum aero-dynamic eciency improvement happens in the ight condition 2. For the RAE-2822 airfoil in conditions 3 and 4 and for NACA-64A010 airfoil in the third condition, despite the expected decrease in the drag coecient, due to the ow separation after the bump, the lift coecient is not increased signicantly. Com-parison of two airfoils shows that the relative eect of the bump is higher for the thinner airfoil (NACA-64A010).
Figure 8 shows the pressure contours along with the ow streamlines around RAE-2822 airfoil with SCB for all ight conditions. One observes that for ight conditions 3 and 4, the greater height of the bump encourages geometrical ow separation right over the bump and this increases the pressure above the airfoil and decreases the lift coecient and SCB performance. We see the same phenomenon for NACA-64A010 airfoil in Figure 9. As the free stream Mach number increases, the SCB performance decreases due to the formation of a large vortical separated region after the bump. In the next sections, we use ow suction/blowing to minimize or eliminate the vortical separated region after the bump to improve the performance of the SCB for RAE-2822 airfoil in the ight condition 4 and for NACA-64A010 airfoil in the ight condition 3. For this study, we use the optimized shape of the SCB for these ight conditions. Please note that the SCB has been \optimized" for a single o-design condition and its shape is frozen in the next sections to nd near optimum values of suction/blowing in the ight condition 4 for RAE-2822 and in the ight condition 3 for NACA-64A010 airfoil. Studying the performance of the SCB-only case in other o-design conditions or in on-design conditions is out of scope of this article and they are studied in other articles [5,6].
12. The application of suction/blowing for RAE-2822
After optimizing the SCB geometry on RAE-2822 in the previous section, suction/blowing is added to improve the bump performance for the ight
condi-Table 8. The performance optimization results for RAE-2822 with the optimized bump. Flight
condition M Cl Cdv Cdp Cdt L=D %Cl %Cd %L=D
1 0.75 0.575 0.0057 0.0064 0.0120 47.8 3.79 9.77 14.9 2 0.76 0.576 0.0056 0.0081 0.0137 42.1 6.27 14.4 24.4 3 0.78 0.496 0.0054 0.0134 0.0187 26.5 1.85 15.8 21.5 4 0.79 0.438 0.0053 0.016 0.0212 20.7 -1.79 15.5 16.3
Table 9. The performance optimization results for NACA-64A010 with the optimized bump. Flight
condition M Cl Cdv Cdp Cdt L=D %Cl %Cd %L=D
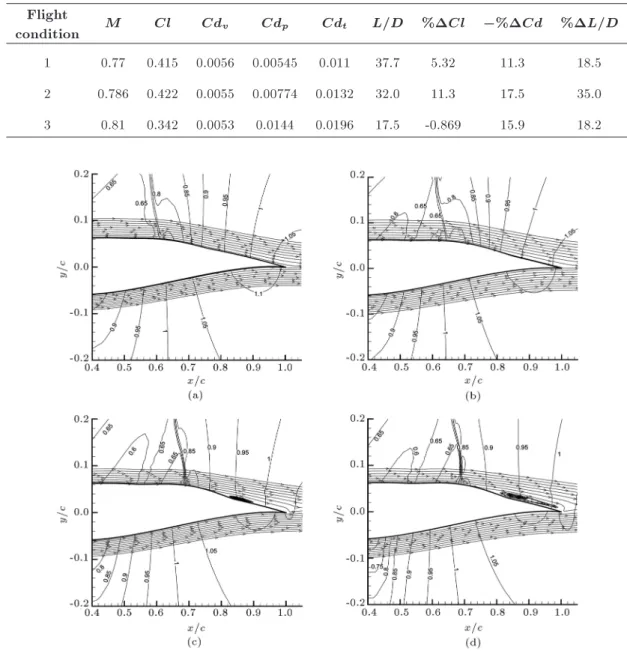
1 0.77 0.415 0.0056 0.00545 0.011 37.7 5.32 11.3 18.5 2 0.786 0.422 0.0055 0.00774 0.0132 32.0 11.3 17.5 35.0 3 0.81 0.342 0.0053 0.0144 0.0196 17.5 -0.869 15.9 18.2
Figure 8. The ow streamlines and the pressure contours around RAE-2822 with optimized SCB: (a) M1= 0:75, (b)
M1= 0:76, (c) M1= 0:78, and (d) M1= 0:79.
Figure 9. The ow streamlines and the pressure contours around NACA-64A010 with an optimized SCB: (a) M1= 0:77,
tion 4 according to Table 1. We use a parametric study to nd near optimum values of suction and blowing parameters. In this section, we will study the eect of three suction/blowing design parameters, i.e. mass ow, location, and the specic momentum, on the airfoil performance, and on the structure of the boundary layer and the vortical separated ow region. First, we study the eect of the suction mass ow parameter on the aerodynamic coecients of RAE-2822 airfoil with the optimized SCB. The suction inlet width is Ls=b = 0:02c, its location is xs=b = 0:5c
(located before the bump), and s=b = 20 relative
to the chord line. Despite the last section, here, we are not trying to nd the optimum values for suction. In fact, we are using a parametric study just to understand how suction aects dierent per-formance criteria, and to nd the desirable values of the design parameters. Figure 10 shows variations of the aerodynamic coecients and the eciency with respect to the non-dimensional suction mass ow. The maximum lift and drag coecients are achieved near CQ 0:0018 and CQ 0:0014, respectively, after
which more suction results in decrease in both of them, while the aerodynamic eciency increases as the non-dimensional mass ow increases. According
to these results, the mass ow parameters in the range of 0:003 CQ 0:0035 are the most desirable
and after that, the lift coecient loss is not practically acceptable.
In fact, the pressure variations in the suction region, although considered in the computation of the aerodynamic coecients, are not important for us. Figure 11 shows pressure contours and streamlines for this case. Comparison of Figure 11(a) and (b) shows that the ow suction has not succeeded to eliminate the separation region behind the bump, despite reduction in the drag coecient and increase in the eciency.
Next, we will study addition of blowing after the SCB on RAE-2822 airfoil. This time, s=b = 0
(parallel to the chord line), its starting point is at xs=b = 0:85c (located after the bump location), and
the blowing width is Ls=b = 0:02c. Results are shown
in Figure 12. The maximum aerodynamic eciency occurs around CQ 0:0015 and the minimum drag
and the maximum lift coecient occur around CQ
0:0011. According to these results, the most desirable range for the mass ow parameter in blowing in this location is 0:0013 CQ 0:0015.
Again, the pressure distribution around the blow-ing region is not important for us. Figure 13 also shows
Figure 10. The aerodynamic coecients and eciency variations with respect to the non-dimensional suction mass ow at xs=b= 0:5c for RAE-2822 with an optimized SCB at ight condition 4.
Figure 11. The ow streamlines with the pressure contours around RAE-2822 with an optimized SCB in ow condition 4: (a) Without suction, and (b) with suction at xs=b= 0:5c.
Figure 12. The aerodynamic eciency and coecient changes with respect to the non-dimensional blowing mass ow at xs=b= 0:85c for RAE-2822 with an optimized SCB in ow condition 4.
Figure 13. The ow streamlines with pressure contours around RAE-2822 with an optimized SCB in the ow condition 4: (a) Without blowing, and (b) with blowing at xs=b= 0:85c.
pressure contours and streamlines for this case. The blowing ow has pushed the separated vortical ow towards the trailing edge, but has not still succeeded to remove it completely. Comparing Figures 11 and 13, one may observe that blowing is more eective in reducing the separated area behind the bump than a behind a suction.
We now study the eect of suction location on the aerodynamic coecients and size of the separated region for RAE-2822, again at the ight condition 4.
The non-dimensional mass ow is constant and is set to CQ = 0:0018. The suction width is Ls=b =
0:02c and its angle is s=b = 14 relative to the
chord line. The suction region is located before the shock wave. Figure 14 shows the variations of the aerodynamic eciency and coecients with respect to the suction location. It is illustrated that suction always results in increase of the lift coecient. The maximum reduction in drag coecient and increase in aerodynamic eciency occur at xs=b= 0:5c.
Figure 14. The RAE-2822 aerodynamic eciency and variations of coecients with respect to the suction location with CQ= 0:0018.
Figure 15. The RAE-2822 aerodynamic eciency and variations of coecients with respect to the blowing location with CQ= 0:0011.
Figure 16. The ow streamlines around airfoil RAE-2822 with an optimized SCB in the ow condition 4 with blowing at two dierent locations: (a) xs=b= 0:75c and b) xs=b= 0:8c.
Next, we study how blowing location may aect the results for RAE-2822 in the ight condition 4 in Table 1. The mass ow parameter is set to CQ =
0:0011. The blowing outlet width is Ls=b = 0:02c,
its angle is s=b = 0 relative to the chord line, and
it is located after the shock wave. Figure 15 shows the aerodynamic coecients and eciency variation with respect to the blowing position. The maximum eciency improvement and the drag reduction occur at xs=b = 0:8c and xs=b = 0:75c, respectively. Figure 16
shows the streamlines around RAE-2822 in the pres-ence of bump and blowing in two dierent positions. The size of the vortical separated ow after the bump is reduced as the blowing position moves forward.
One may examine the boundary layer velocity prole, to better understand how suction or blowing changes the structure of the boundary layer and aects the interactions of the boundary layer and the shock wave. Figure 17 compares the boundary layer proles over RAE-2822 at ight condition 4 for three dierent ow control schemes: the optimized SCB-only, the SCB with ow suction located at xs=b= 0:5c, and the SCB
with ow blowing at xs=b = 0:8c. Proles are shown
in four stations before and inside the separated region, i.e. at 70, 75, 80, and 85 percent of the chord length. This gure shows that the suction has resulted in a
little thicker boundary layer, but the blowing makes the boundary layer thinner (in comparison with the RAE-2822 with SCB-only). Also, note that the separated region is still present for both cases.
Another studied parameter is the ow specic momentum, or velocity. The suction mass ow pa-rameter is set to CQ = 0:001, and the ow angle
is s=b = 20 and it is located at xs=b = 0:5c.
Figure 18 shows variations of aerodynamic coecients with respect to the non-dimensional average velocity in the suction inlet. The maximum lift and drag coecient and aerodynamic eciency occur around Uave=U1 1:4.
Similar studies were performed for blowing down-stream of the SCB for RAE-2822 at ight condition 4. The mass ow parameter is set to CQ = 0:001. The
angle is s=b = 0 relative to the chord line and its
location is xs=b = 0:8c. Figure 19 shows variations of
the aerodynamic eciency and coecients with respect to the non-dimensional average velocity of the outlet prole. One can see that increase in the outlet specic momentum results in the reduction of the aerodynamic eciency and increase in the aerodynamic coecients. A desirable value for this parameter is about 0.2 with respect to the aerodynamic eciency values.
Figure 17. The velocity proles over RAE-2822 + SCB with/without suction and blowing at the ight condition 4 at four dierent stations: (a) x=c = 0:7, (b) x=c = 0:75, (c) x=c = 0:8, and (d) x=c = 0:85.
Figure 18. Aerodynamic eciency and variations of coecients with respect to the non-dimensional average velocity in the suction inlet for RAE-2822 with optimized SCB at ight condition 4 with CQ= 0:001.
Figure 19. Aerodynamic eciency and variations of coecients with respect to the non-dimensional average velocity in the blowing outlet for RAE-2822 with optimized SCB at ight condition 4 with CQ= 0:001.
reduce the size of the vortical separated region after the SCB. This may be favorable for many reasons, including the possibility of having control surfaces in the downstream part of the airfoil. The above results show that blowing is more eective than suction to remove (or to reduce) the separated region. Hence, it is feasible to remove the separated region by blowing after the shock wave. Obviously, decreasing the blowing angle results in a more eective jet and will energize the boundary layer stagnant ow more eectively. However, many practical issues remain to be examined later. To investigate this in more detail, we study eect of the mass ow parameter on the size and the structure of the separated ow region.
For RAE-2822 airfoil at ight condition 4, we set the blowing angle at s=b = 0 relative to the
chord line, and the location at xs=b = 0:75c with
a channel width of Ls=b = 0:02c. Table 10 shows
that the maximum aerodynamic eciency occurs at CQ = 0:0025 and this value is the maximum value
achieved by blowing for the aerodynamic eciency in this research. Figure 20 shows the resulting ow pattern, and conrms that by increasing the mass ow parameter, the vortical region becomes smaller and it eventually disappears. Higher aerodynamic eciency
Table 10. Eect of the mass ow variation on the aerodynamic coecients for RAE-2822 in ight condition 4.
CQ L=D Cd Cl
0.0 20.8 0.0206 0.429 0.0012 22.3 0.0184 0.410 0.0019 22.9 0.0181 0.415 0.0022 23.5 0.0181 0.423 0.0025 23.6 0.0184 0.434 0.0029 23.5 0.0191 0.449
and smaller separated region are two independent criteria for a wing designer. However, they usually correlate. It depends on the designer to select one of them or to use both.
13. The suction/blowing for NACA-64A010 airfoil
To generalize the results of the previous section for RAE-2822 to other airfoils, the suction and blowing mechanisms are also examined on NACA-64A010 air-foil for ight condition 3 in Table 2. The location of the suction region is considered before the bump at
Figure 20. The ow streamlines around RAE-2822 with an optimized SCB in the ow condition 4 with blowing at xs=b= 0:75c with various mass ow rates: (a) CQ= 0:0012, (b) CQ= 0:0019, (c) CQ= 0:0022, and (d) CQ= 0:0029.
xs=b = 0:45c; a similar channel width of Ls=b = 0:02c
is selected; and the angle is set to s=b = 20
relative to the chord line. For suction, we make changes in the mass ow parameter by varying the suction channel outlet pressure. Figure 21 shows that the maximum lift and drag coecient are achieved near CQ 0:0014, after which more suction results
in lowering of both of them, while the aerodynamic eciency increases as the non-dimensional mass ow increases. According to these results, similar to RAE-2822, mass ow parameters in the range of 0:003 CQ 0:0035 are the most desirable, and after that,
the lift coecient loss is not practically acceptable. Again, details of the ow in the inlet of the suction channel are not important for us and we are only interested in hydrodynamic eects of this suction on the boundary layer structure over the whole airfoil surface. Figure 22 shows the pressure contours and the streamlines for this condition. One observes that despite the drag reduction and eciency increase, suction has not completely eliminated the separated ow behind the bump, but has resulted in a smaller separated vortical ow behind the bump.
A similar study to consider eects of the blowing
after the shock wave region on the boundary layer pattern for NACA-64A010 with SCB is also performed. This time, the angle is s=b = 0 relative to the
chord line, its location is xs=b = 0:7c, and Ls=b =
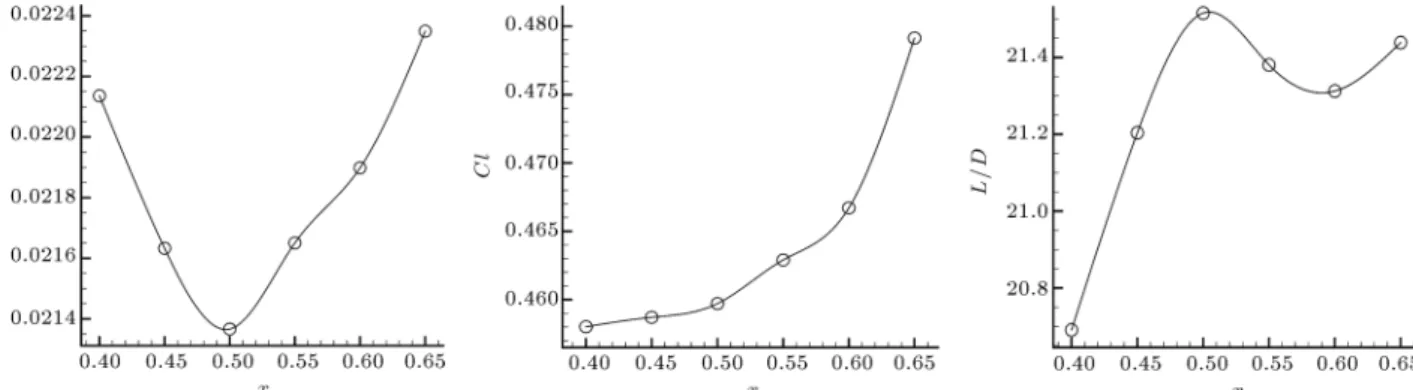
0:02c. The mass ow parameter varies by changing the blowing channel inlet pressure. Table 11 shows the results. Figure 23 shows that the lift coecient increases as the mass ow parameter increases and the maximum aerodynamic eciency happens around
Table 11. Eect of the mass ow variation on the aerodynamic coecients for NACA-64A010 in ight condition 3.
CQ L=D Cd Cl
0.0 17.6 0.0189 0.333 0.0003 17.9 0.0188 0.339 0.0007 18.0 0.0183 0.329 0.0012 18.6 0.0176 0.327 0.0016 19.1 0.0176 0.335 0.0018 19.1 0.0178 0.339 0.002 19.2 0.0179 0.344 0.0022 19.1 0.0183 0.35
Figure 21. The aerodynamic eciency and variations of coecients with respect to the non-dimensional suction mass ow at xs=b= 0:45c for NACA-64A010 at ight condition 3.
Figure 22. The ow streamlines with pressure contours around NACA-64A010 with an SCB in ow condition 3: (a) Without suction, and (b) with suction at xs=b= 0:45c.
Figure 23. The aerodynamic eciency and variations of coecients with respect to the blowing mass ow parameter at xs=b= 0:7c for NACA-64A010 at ight condition 3.
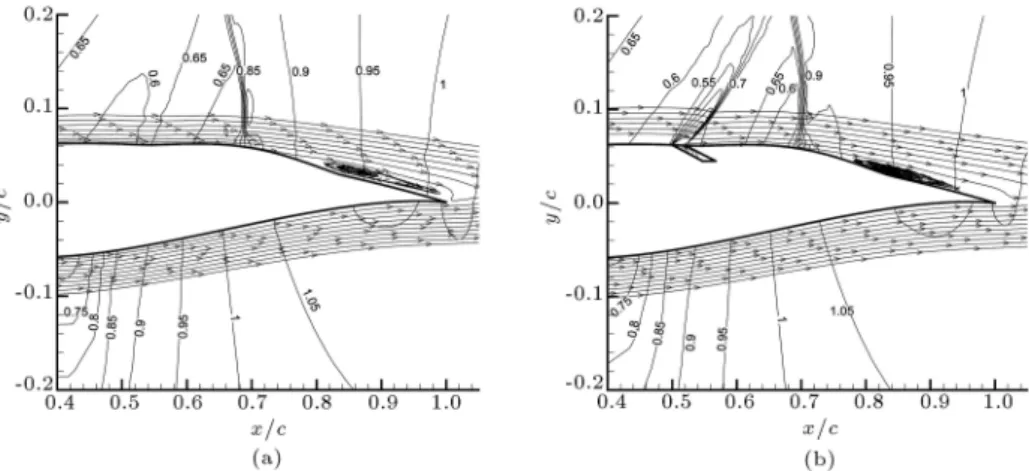
Figure 24. The ow streamlines around NACA-64A010 with an optimized SCB in the ow condition 3 with blowing at xs=b= 0:7c with dierent mass ow rates: (a) CQ= 0:0003, (b) CQ= 0:0007, (c) CQ= 0:0012, and (d) CQ= 0:0016.
CQ 0:002 and the minimum drag coecient happens
around CQ 0:0012 in this location. One observes
that the blowing after the SCB in NACA-64A010 airfoil is also more eective than the suction (see Figure 24). Increasing the mass ow again results in a smaller separated vortical ow behind the bump and, nally, this region is completely removed. The main result here is that all physical phenomena re-alized in this article for RAE-2822 airfoil are again observed for NACA-64A010 airfoil. This means that
we may qualitatively generalize results in this article to all transonic airfoils in the region of o-design Mach numbers slightly after the drag divergence Mach number.
14. Conclusions
Many researchers have shown the eectiveness of SCBs to improve the aerodynamic performance of transonic wings. The optimization procedure may
be used to nd the optimized shape and location of SCB, which has resulted in improvement of average aerodynamic eciency by 23.6% for NACA-64A010 and 19.2% for RAE-2822 in their o-design condi-tions. However, these modications result in large regions of separated ow, which may be unacceptable for design of the aerodynamic control devices. For stronger shock waves (higher Mach number ights), this nonlinear SWBLI results in larger separated re-gions with drastically deteriorating aerodynamic per-formance.
Here, we have added suction and blowing and have used a parametric study to control generation of large separated regions. For the RAE-2822 airfoil, we showed 8.6% improvement in the aerodynamic eciency by the addition of suction upstream of the SCB, and another 13.5% improvement for application of blowing downstream of the SCB for ight condition 4. For NACA-64A010 airfoil, the improvement for suction is 3.9% and it is 9.0% for blowing in the free stream condition 3.
These results show that blowing is more eective than suction for aerodynamic eciency improvements (including both drag reductions and lift additions). In other words, most ndings of this article and trends of results are generally applicable for most transonic airfoils. It was also shown that the best non-dimensional mass ow for suction is about -0.003 for both airfoils. The best non-dimensional mass ows for the blowing are about 0.0025 and 0.002 for RAE-2822 and NACA-64A010, respectively.
Nomenclature
Abbreviations
SCB Shock Control Bump
SWBLI Shock Wave/Boundary Layer Interaction
HSS Hybrid Suction/SCB HBS Hybrid Blowing/SCB List of symbols
AT Jacobean of convective ux
c Speed of sound
CB=lB Bump degree of symmetry
Cdp Pressure drag coecient
Cdt Airfoil drag coecient
Cdv Viscous drag coecient
Cf Skin friction coecient
Cl Airfoil lift coecient Cp Pressure coecient
CQ Non-dimensional mass ow
ds Surface element
E Total energy per unit mass f Hicks-Henne sine-function finv Inviscid ux vector
fvis Viscous ux vector
H Total enthalpy
hB Maximum bump height
K Turbulent kinetic energy lB Bump length
L=D Aerodynamic eciency M1 Free stream Mach number
nx; ny Component of the unit normal vector
p Static pressure P0 Total pressure
P1 Free stream pressure
qk Heat ux
Re1 Free stream Reynolds number
S The control volume surface Sw The airfoil surface
t Bump slope parameter T Static temperature U1 Free stream velocity
U Vector of ow variable u; v Cartesian velocity component V Contra variant velocity x; y Cartesian coordinate system x0 Beginning of bump
Y+ Non-dimensional wall coordinate
Airfoil angle of attack (AoA) (deg) Ratio of specic heat coecient Second viscosity coecient Dynamic viscosity coecient t Turbulent viscosity coecient
Shear stress across the control volume surface
km Component of viscous stress tensor
Density
! Turbulent specic dissipation rate
References
1. Milholen II, W.E. and Lewis L.R. \On the application of contour bumps for transonic drag reduction", In AIAA 43rd Aerospace Sciences Meeting and Exhibit, AIAA- 2005-0462, Reno (2005).
2. Patzold, M., Lutz., T.H., Kramer, E. and Wagner, S. \Numerical optimization of nite shock control bumps", In AIAA 44th Aerospace Sciences Meeting and Exhibit, pp. 9-12 Reno (2006).
3. Stanewsky, E., Delery, J., Fulker, J. and de Matteis, P. (Editors) \Drag reduction by shock and boundary layer control", Results of Project EUROSHOCK II Supported by the European Union 1996-1999, Springer, Heidelberg (2002).
4. Ashill P.R. and Fulker, J.L. \A review of ow control research at dera", Fluid Mechanics and Its Applica-tions, 53, pp. 43-56 (1999).
5. Mazaheri, K., Nejati, A., Kiani, K.C. and Taheri, R. \The application of the gradient-based adjoint multi-point optimization of single and double shock control bumps for transonic airfoils", International Journal on Shock Waves Detonations and Explosions, 42, pp. 196-208 (2015). http://dx.doi.org/10.1007/s00193-015-0591-2
6. Mazaheri, K., Kiani, K.C., Nejati, A., Zeinalpour, M. and Taheri, R. \Optimization and analysis of shock wave/boundary layer interaction for drag reduction by shock control bump", Journal of Aerospace Science and Technology, 42, pp. 196-208, http://dx.doi.org/10.1016/j.ast.2015.01.007 (2015).
7. Qin, N., Zhu, Y. and Shaw, T.H. \Numerical study of active shock control for transonic aerodynamics", International Journal of Numerical Methods for Heat & Fluid Flow, 14(4), pp. 444-466 (2004).
8. Bhattacharjee, S., Ahsan, M., Saha, M. and Moham-mad, M. \Numerical analysis of shock and bound-ary layer control over NACA0012 by contour bump, surface cooling and heating", Proceedings of the In-ternational Conference on Mechanical Engineering (ICME2007), Dhaka, Bangladesh (29-31 December, 2007).
9. Lee, D.S. et al. \Robust active shock control bump design using hyper parallel MOGA", Journal of Com-putational & Fluids, 80, pp. 214-224 (2012).
10. Yagiz, B., Kandil, O. and Pehlivanoglu, Y.V. \Drag minimization using active and passive ow control techniques", International Journal of Aerospace Sci-ence and Technology, 17, pp. 21-31 (2012).
11. Vadillo, J.L., Agarwal, R.K. and Hassan, A.A. \Active control of shock/boundary layer interaction in tran-sonic ow over airfoils", AIAA Paper 01-2975 (2001).
12. Tian, Y., Liu, P. and Feng, P. \Shock control bump parametric research on supercritical airfoil", Science China, 54(11:2935-2944), pp. 2935-2944 (November 2011).
13. Sommerer, A., Lutz, T. and Wagner, S. \Numerical op-timization of adaptive transonic airfoils with variable camber", ICAS Congress (2000).
14. Wong, W.S., Le Moeing, A. and Qin, N. \Parallel adjoint-based optimization of a blended wing body aircraft with shock control bumps", The Aeronautical Journal, 111(1117), pp. 165-174 (March 2006).
15. Le Balleur, J.C., Girodroux-Lavigne, P. and Gassot, H. \Prediction of transonic airfoil/wing ow with control using a time-accurate viscous-inviscid interac-tion approach", Results of Project EUROSHOCK II Supported by the European Union 1996-1999, Third Annual Report (April 1999).
16. Pehlivanoglu, Y.V., Yagiz, B., Kandil, O. and Baysal, O. \Particle swarm optimization of suction and blow-ing on airfoils at transonic speeds", Journal of Aircraft, 47(6), pp. 1955-1965 (2010).
17. Pehlivanoglu, Y.V. and Yagiz, B. \Optimization of active/passive ow control parameters on airfoils at transonic speeds", Journal of Aircraft, 48(1), pp. 212-219 (2011).
18. Birkemeyer, J. \Drag minimization on a transonic wing by ventilation and adaptive contour bump", DLR Research Report 1999-28, Ph.D. Thesis University Hannover (July 1999).
19. Qin, N., Zhu, Y. and Ashill, Pr., CFD Study of Shock Control at Craneld, ICAS CONGRESS (2000).
20. Blazek J. \Computational uid dynamics: Principles and applications", Elsevier, Computational Fluids & Solid Mechanics, Printed in Netherlands, pp. 106-108 (2001).
21. Wilcox D.C., Turbulence Modeling for CFD, DCW
Industries, Inc., La Canada, California (1998).
22. Ramezani, A. and Mazaheri, K. \Multi-grid conver-gence acceleration for implicit and explicit solution of Euler equations on unstructured grids", International Journal for Numerical Methods in Fluids, Inter Science Wiley Publication, 62(9), pp. 994-1012 (2009).
23. Lien, F.S. and Kalitzin, G. \Computations of transonic ow with 2 f turbulence model", Elsevier, Journal of Heat and Fluid Flow, 22, pp. 53-61 (2001).
24. Jameson, A., Leoviriyakit, K. and Shankaran, S. \Multi-point aero-structural optimization of wings including planform variations", In 45th Aerospace Sciences Meeting and Exhibit, AIAA-2007-764, Reno (2007).
Biographies
Karim Mazaheri is a Professor in the Faculty of Aerospace Engineering at Sharif University of Technol-ogy. He received his BSc degree at Sharif University of Technology in 1987, and his MSc and PhD degrees at the University of Michigan, in 1989 and 1992, respectively. His research interests are mainly in the area of CFD and aerodynamics, gas turbine system, propulsion, system engineering, and aviation strategic management.
Ashkan Nejati received his PhD degree in Aerospace Engineering from Sharif University of Technology in 2015. His research interests are mainly in the area of aerodynamic shape optimization, with special
focus on optimization of compressor cascade; air-foils and wings; and, more recently, optimization of shock and boundary layer interaction control meth-ods.
Kiarash Chaharlang Kiani received his MSc degree
in Aerospace Engineering from Sharif University of Technology in 2012. He is currently a PhD student in Aerospace Engineering at Sharif University of Technology. His research interests are mainly in the area of lm cooling, with special focus on application of lm cooling in the cascade of turbine.