Using Binary Particle Swarm
Optimization for Minimization Analysis
of Large-Scale Network Attack Graphs
M. Abadi
1and S. Jalili
1;The aim of the minimization analysis of network attack graphs (NAGs) is to nd a minimum critical set of exploits so that by preventing them an intruder cannot reach his goal using any attack scenario. This problem is, in fact, a constrained optimization problem. In this paper, a binary particle swarm optimization algorithm, called SwarmNAG, is presented for the minimization analysis of large-scale network attack graphs. A penalty function method with a time-varying penalty coecient is used to convert the constrained optimization problem into an unconstrained problem. Also, a time-varying velocity clamping, a greedy mutation operator and a local search heuristic are used to improve the overall performance of the algorithm. The performance of the SwarmNAG is compared with that of an approximation algorithm for the minimization analysis of several large-scale network attack graphs. The results of the experiments show that the SwarmNAG outperforms the approximation algorithm and nds a critical set of exploits with less cardinality.
Keywords: Particle swarm optimization; Constrained optimization; Penalty function method; Local search; Network attack graph.
INTRODUCTION
When evaluating the security of a network, it is rarely enough to consider the presence or absence of isolated vulnerabilities. This is because intruders often combine exploits against multiple vulnerabilities in order to reach their goals [1]. For example, an intruder might exploit the vulnerability of a particular version of FTP to overwrite the .rhosts le on a victim host. Next, the intruder could remotely login to the victim and, subsequently, the intruder could use the victim host as a base from which to launch another exploit on a new victim and so on.
Phillips and Swiler [2] proposed the concept of attack graphs, where each node represents a possible attack state. Edges represent a change of state caused by a single action taken by the intruder.
1. Department of Computer Engineering, Tarbiat Modares University, P.O. Box 14115-143, Tehran, Iran.
*. To whom correspondence should be addressed. E-mail: [email protected]
Sheyner et al. [3] and Jha et al. [4,5] used a modied version of the model checker NuSMV [6] to produce attack graphs. Ammann et al. [7] introduced a monotonicity assumption and applied it to develop a polynomial algorithm to encode all of the edges in an attack graph without actually computing the graph itself. These attack graphs are essentially similar to [2], where any path in the graph, from an initial node to a goal node, shows a sequence of exploits that an intruder can launch in order to reach his goal.
Noel et al. [8] presented a number of techniques for managing attack graph complexity through visual-ization.
Mehta et al. [9] presented a ranking scheme for the nodes of an attack graph. The rank of a node shows its importance, based on factors like the probability of an intruder reaching that node. Given a ranked attack graph, the system administrator can concentrate on relevant subgraphs to gure out how to start deploying security measures.
The aim of the minimization analysis of attack graphs is to nd a minimum critical set of exploits
that completely disconnect the initial nodes and the goal nodes of the graph. Sheyner et al. [3] and Jha et al. [4,5] showed that this problem is, in fact, NP -hard. They proposed an approximation algorithm that can nd an approximately-optimal set of exploits that must be prevented to thwart an intruder. While it is currently possible to generate very large and complex network attack graphs, relatively little work has been done regarding their analysis.
Particle swarm optimization (PSO) is a swarm intelligence method that models social behaviour to guide swarms of particles towards the most promising regions of the search space [10,11] and has proved to be ecient at solving engineering problems [12-15].
The problem of the minimization analysis of network attack graphs is, in fact, a constrained opti-mization problem, in which the objective is to nd a solution with minimum cardinality, and the constraint is that the solution must be critical (i.e., it must hit all attack scenarios). The most common approach in solving constrained optimization problems is the use of a penalty function method, which adds a penalty to the objective function in order to discourage infeasible areas of the search space being searched [16].
In this paper, a binary PSO algorithm, called SwarmNAG, is presented for the minimization analysis of large-scale network attack graphs (NAGs). The per-formance of the SwarmNAG is also compared with that of the approximation algorithm proposed by Sheyner et al. [3] and Jha et al. [4,5], in order to analyze several large-scale network attack graphs.
The remainder of this paper is organized as follows: First, an overview of PSO is provided, then, the network security model is introduced followed by a description of network attack graphs. There is a presentation of the SwarmNAG followed by a description of the dierent measures used to evaluate its performance. Finally, the experimental results are reported, followed by some conclusions.
PARTICLE SWARM OPTIMIZATION
Particle swarm optimization (PSO) is a population based stochastic optimization algorithm developed by Kennedy and Eberhart [10]. It was inspired by the social behavior of ocks of birds when searching for food. In PSO, the potential solutions, called parti-cles, y through the problem space looking for better regions. The position of a particle is inuenced by its best visited position and the position of the best particle in its neighborhood. When the neighborhood of a particle is the entire swarm, the best position in the neighborhood is referred to as the global best particle and the resulting algorithm is referred to as a gbest PSO. When smaller neighborhoods are used, the algorithm is generally referred to as a lbest PSO.
The performance of each particle is measured by a predened tness function, which is related to the problem to be solved. Each particle in the swarm has a current position, xi, a velocity (rate of position
change), vi, and a personal best position, yi. The
personal best position of particle i shows the best tness reached by that particle at a given time. Let f be the objective function to be maximized, then, the personal best position of a particle at iteration or time step t is updated as follows:
yi(t) =
(
yi(t 1) if f(xi(t)) f(yi(t 1))
xi(t) if f(xi(t)) > f(yi(t 1)) (1)
For the gbest model, the global best position is de-termined from the entire swarm by selecting the best personal best position. This position is denoted by ^y.
The equation that manipulates the velocity is called the velocity update equation and is stated as follows:
vij(t + 1) = vij(t) + c1r1j(t)(yij(t) xij(t))
+ c2r2j(t)(^yj(t) xij(t)); (2)
where vij(t + 1) is the velocity updated for the jth
di-mension, j = 1; 2; ; d. c1and c2are the acceleration
constants, where the rst moderates the maximum step size towards the personal best position of the particle, while the second moderates the maximum step size towards the global best position in just one iteration. r1j(t) and r2j(t) are two random values in the range
[0; 1] which give the PSO algorithm a stochastic search property.
The velocity update equation consists of the following three components:
The inertia component, which serves as a memory of the previous ight direction, i.e. movement in the immediate past;
The cognitive component, which quanties the per-formance of particle i relative to past perper-formances. In a sense, the cognitive component resembles indi-vidual memory of the position that was best for the particle;
The social component, which quanties the perfor-mance of particle i relative to a group of particles. The eect of the social component is that each particle is also drawn towards the best position found by the particle's neighbourhood.
Velocity updates on each dimension can be clamped with a user dened maximum velocity, Vmax,
which would prevent them from exploding, thereby causing premature convergence [17,18].
Each particle updates its position using the fol-lowing equation:
xi(t + 1) = xi(t) + vi(t + 1): (3)
In swarm terminology, particle i is ying to its new position, xi(t + 1). After the new position is calculated
for each particle, the iteration counter increases and the new particle positions are evaluated. This process is repeated until some convergence criteria are satised. Binary Particle Swarm Optimization
Kennedy and Eberhart [19] have adapted the PSO to search in binary spaces. For the binary PSO, the elements of xi, yi and ^y can only take the values 0
and 1. The velocity, vi, is interpreted as a probability
to change a bit from 0 to 1, or from 1 to 0, when updating the position of particles. Therefore, the velocity vector remains continuous-valued. Since each vij is a real value, a mapping needs to be dened from
vij to a probability in the range [0; 1]. This is done
using a sigmoid function to squash velocities into the [0; 1] range. The sigmoid function is dened as follows:
sig(v) = 1 + e1 v: (4)
The equation for updating positions is then replaced by the following probabilistic update equation:
xij(t + 1) =
(
0 if r3j(t) sig(vij(t + 1))
1 if r3j(t) < sig(vij(t + 1)) (5)
where r3j(t) is a random value in the range [0; 1].
In binary PSO, the meaning and behavior of velocity clamping dier substantially from the real-valued PSO [16]. With the velocity interpreted as a probability of change, velocity clamping sets the minimal probability for a bit to change its value from
0 to 1, or from 1 to 0. For example, if Vmax = 4
and vij is clamped with Vmax, then sig(vij) = 0:982
is the probability of xij to change to 1, and 0.018
the probability to change to 0. Velocity clamping, therefore, has a meaning very similar to the mutation rate in genetic algorithms [16].
In this paper, the gbest model of binary PSO is used for the minimization analysis of network attack graphs.
NETWORK SECURITY MODEL
The network security model is a tuple (S, H, C, T , E, R, IDS), where S is a set of services, H is a set of hosts connected to the network, C is a relation expressing connectivities among hosts, T is a relation expressing trust between hosts, E is a set of individual known exploits that an intruder can use to construct attack scenarios, R is a model of an intruder and IDS is a model of the intrusion detection system.
Services
Each service s 2 S is a pair, (svn; p), where svn is the service name and p is the port on which the service is listening.
Hosts
Each host h 2 H is a tuple, (id; svcs; plvl; vuls), where id is a unique host identier, svcs is a set of services running on the host, plvl is the level of privilege that the intruder has on the host and vuls is a set of host-specic vulnerable components. For simplicity, only three privilege levels are considered: None, user and root.
Network Connectivities
Network connectivities are expressed as a relation, C H H P , where P is a set of port numbers. Each network connectivity c 2 C is a triple, (hs,ht,p),
where hsis the source host, htis the target host and p
is the target port number. Note that the connectivity relation incorporates the network elements, such as rewalls, that restrict the ability of one host to connect to another.
Trust Relationships
Trust relationships are modeled as a relation T H H, where T (ht; hs) indicates that a user may log in
from host hs to host htwithout authentication.
Exploits
Each exploit e 2 E is a tuple, (pre, hs, ht, post),
where pre is a list of conditions that must hold before launching the exploit, hs is the host from which the
exploit is launched, ht is the host targeted by the
exploit and post species the eects of the exploit on the network.
An exploit e 2 E is inevitable if its prevention is not feasible or incurs high cost. The set of inevitable exploits is denoted by I.
Intruder
The intruder has some information about the target network, such as known vulnerabilities, user passwords and information gathered with port scans, etc. Intrusion Detection System
Exploits are classied as being detectable or unde-tectable, with respect to the intrusion detection system (IDS). If an exploit is detectable, it will trigger an alarm
when executed on a host or network segment monitored by the IDS.
NETWORK ATTACK GRAPHS
Let E be the set of exploits. A network attack graph is a tuple, G = (V; A; V0; Vf; L), where V is the set of
nodes, A is the set of directed edges, V0 V is the
set of initial nodes, Vf V is the set of goal nodes
and L : A ! E is a labelling function, where L(a) = e if, and only if, an edge a = (v; v0) corresponds to an
exploit, e. A path, , in G is a sequence of nodes, v1; v2; ; vm, such that vi 2 V and (vi; vi+1) 2 A,
where 1 i < m. The label of path is a subset of the set of exploits E. Each attack scenario corresponds to a complete path that starts from an initial node and ends in a goal node.
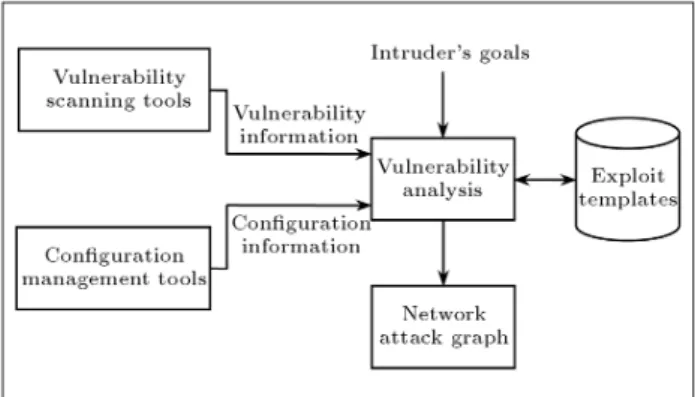
A typical process for generating a network attack
graph is shown in Figure 1. First, vulnerability
scanning tools, such as Nessus [20], determine the vul-nerabilities of individual hosts. Using this vulnerability information, along with exploit templates, intruder goals and other information about the network, such as connectivity between hosts, a network attack graph is generated. In this directed graph, each complete path, from an initial node to a goal node, corresponds to an attack scenario.
Let E = fe1; e2; ; eng be the set of
ex-ploits, I be the set of inevitable exploits and S = fS1; S2; ; Slg be the set of attack scenarios,
repre-sented by the network attack graph, G. The attack scenario, Sk 2 S, is hit by the exploit, ej 2 E, if
ej2 Sk.
For each exploit, ej 2 E, the total hit value,
hvt(ej), is dened as being the number of attack
scenarios that are hit by ej.
hvt(ej) = jfSk 2 Sjej 2 Skgj : (6)
Let U E be a subset of exploits and hs(U) be the
Figure 1. The process of generating a network attack graph.
set of attack scenarios hit by the exploits in U. hs(U) = fSk 2 Sjej 2 Sk for some ej 2 Ug: (7)
An exploit, ej, is redundant, with respect to U, if
hs(Unfejg) = hs(U).
For each exploit, ej =2 U, the partial hit value,
hvp(ej; U), is dened as being the number of attack
scenarios that are hit by ej, but that are not hit by
any exploit in U.
hvp(ej; U) = jfSk2 Sjej 2 Sk^ Sk =2 hs(U)gj : (8)
A subset of exploits, CR EnI, is critical if, and only if, the intruder cannot reach his goal when the exploits in CR are removed from his arsenal. Equivalently, CR is critical if, and only if, every complete path from an initial node to a goal node of the network attack graph has at least one edge labeled with an exploit, ej2 CR.
A critical set of exploits is minimal if it contains no redundant exploit.
A critical set of exploits, CR, is minimum if there is no critical set of exploits, CR0, such that jCR0j <
jCRj.
The aim of the minimization analysis of a network attack graph is to nd a minimum critical set of exploits that must be prevented to guarantee no possible attack scenario. To prevent an exploit, the security analyst may change the rewall conguration or patch the vulnerabilities that made this exploit possible.
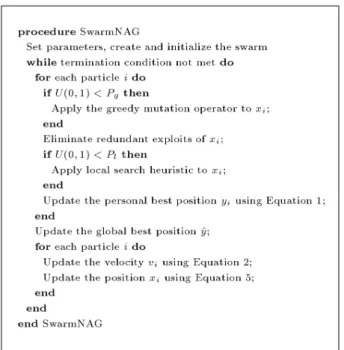
SWARMNAG
In this section, SwarmNAG, a binary PSO algorithm for the minimization analysis of large-scale network at-tack graphs, is presented. The aim of the minimization analysis of a network attack graph is to nd a minimum critical set of exploits. Any solution must be a critical set and its cardinality must be minimal.
Figure 2 shows the pseudo-code of the Swarm-NAG algorithm. The rst step is to initialize the swarm and control parameters, then, repeated iterations of the algorithm are executed until some termination condition is met (e.g., a maximum number of iterations is reached). Within each iteration, if each particle's current position, xi, does not represent a critical set
of exploits, a greedy mutation operator is applied to it with probability Pg. Then, redundant exploits of
xi are eliminated. After that, with probability Pl,
a local search heuristic is applied to xi, in order to
improve it. Then, the particle's personal best position, yi, is updated. The global best position, ^y, is then
determined from the entire swarm by selecting the best personal best position. Finally, the velocity and the position of each particle are updated, using Equations 2 and 5.
It should be mentioned that, in Figure 2, U(0; 1) is a uniform random number between 0 and 1.
Figure 2. The SwarmNAG algorithm.
Problem Representation
Let E = fe1; e2; ; eng be the set of preventable
exploits. Each particle position, xi, corresponds to an
n-bit vector, (xi1; xi2; ; xin), and represents a subset
of exploits, Ei E, in which the exploit ej 2 Eiif, and
only if, the element xij = 1.
Ei= fej 2 Ejxij = 1g: (9)
Let S = fS1; S2; ; Slg be the set of attack
scenarios represented by the network attack graph. The attack scenario Sk 2 S is hit by the particle
position xi, if Sk\ Ei6= ;. The set of attack scenarios
hit by xi is denoted by Ai.
Ai= fSk2 SjSk\ Ei6= ;g: (10)
The particle position xirepresents a critical set of
exploits if all attack scenarios are hit by it.
The aim of the minimization analysis of a network attack graph is to nd a minimum critical set of exploits. This problem is a constrained optimization problem, in which the objective is to nd a solution with minimum cardinality, and the constraint is that the solution must be critical (i.e., it must hit all attack scenarios). Hence, the SwarmNAG uses the following objective function to evaluate the tness of each particle position xi:
f(xi) = z(xi) + :h(xi); (11)
where z(xi) is the number of elements, xij, in particle
position xi, which are zero. The higher the value of
z(xi), the smaller the cardinality of the set of exploits
represented by xi:
z(xi) = jEj jEij : (12)
h(xi) is the number of attack scenarios hit by particle
position xi:
h(xi) = jAij ; (13)
and is the penalty coecient. If is too small, not enough emphasis is placed on preventing violation of the constraint. Hence, non-critical solutions may then be found. On the other hand, if is too large, the algorithm may get trapped in local optima.
Accordingly, a time-varying penalty coecient is used, where an initially small penalty coecient is linearly increased to a large value:
(t) = (0) + ((tmax) (0))t t
max; (14)
where tmax is the maximum number of iterations for
which the algorithm is executed, (0) is the initial penalty coecient, (tmax) is the nal penalty
coef-cient and (t) is the penalty coecoef-cient at iteration t. Note that (0) < (tmax). Typically, the penalty
coecient is set to 0:1 1:9.
Time-Varying Velocity Clamping (TVVC) In binary PSO, the velocity is interpreted as a proba-bility of change. Hence, the velocity clamping sets the minimal probability for a bit to change its value [16].
If Vmax is a small value, it provides a bigger
chance for a bit to change its value (i.e., exploring the search space), while, if Vmax is large, it allows particles
to converge on a solution (i.e., exploiting the search space). Accordingly, a time-varying velocity clamping is used:
Vmax(t)=Vmax(0)+(Vmax(tmax) Vmax(0))t t max;(15)
where tmax is the maximum number of iterations,
Vmax(0) is the initial velocity clamping, Vmax(tmax) is
the nal velocity clamping and Vmax(t) is the velocity
clamping at iteration t.
In following sections, the eect of time-varying ve-locity clamping on the performance of the SwarmNAG will be shown.
Greedy Mutation
At each iteration, if each particle's current position, xi,
does not represent a critical set of exploits, a greedy mutation operator is applied to it with probability Pg.
Figure 3. The greedy mutation operator.
As shown in Figure 3, the greedy mutation rst chooses an exploit, ek =2 Ei, that has the maximum
partial hit value, hvp(ek; Ei), then adds it to Ei and
changes the value of its corresponding element, xik of
xi, to 1.
The greedy mutation uses heuristic information and helps the algorithm to choose exploits that have more hits with attack scenarios.
Elimination of Redundant Exploits
The set of exploits represented by particle position
xi may contain redundant exploits, which must be
eliminated.
Let Ei be the set of exploits represented by xi
and Ai be the set of attack scenarios hit by xi. For
each exploit, ej, the exclusive hit value, hvx(ej; Ei; Ai),
is dened as being the number of attack scenarios, Sk2 Ai, that are hit by ej, but that are not hit by any
exploit in Einfejg. The exploit, ej, is called candidate
redundant, with respect to Ei, if hvx(ej; Ei; Ai) =
0. The set of candidate redundant exploits of Ei is
denoted by Ri.
Ri= fej 2 Eijhvx(ej; Ei; Ai) = 0g : (16)
The exclusive hit value is used to dene the selection value, sv(ej; Ei), of a candidate redundant
exploit, ej 2 Ri.
sv(ej; Ei) =
X
ek2Einfejg
hvx(ek; Einfejg; Ai): (17)
The selection value is used to evaluate the candi-date redundant exploits of a set of exploits, in order to choose a candidate redundant exploit for removal from it.
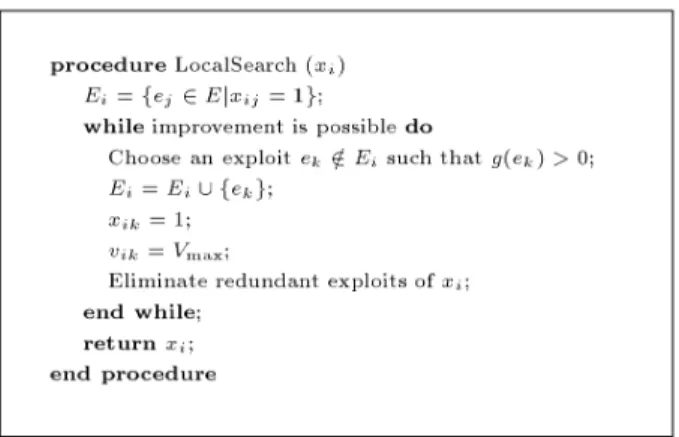
In Figure 4, an algorithm is presented, which can be used to eliminate redundant exploits of xi.
The algorithm is based on the idea that it is good to remove an exploit, ek, from Ei, if ek is a candidate
redundant exploit and hits attack scenarios that are hit by too many other exploits in Ei. Hence, the algorithm
removes at each step a candidate redundant exploit
Figure 4. The procedure of eliminating redundant exploits.
that has the minimum selection value. This is repeated until a set of exploits without redundant exploits is obtained.
Local Search Heuristic
It has been shown in many empirical studies that global optimization algorithms lack exploitation abilities in later stages of the optimization process. This is also true for the basic PSO, as shown in [21-23]. How-ever, it provides mechanisms to balance exploration and exploitation through proper setting of the inertia weight, acceleration coecients and velocity clamping. Many variations of the basic PSO have been proposed to address this problem [16]. Most of them rst allow the algorithm to explore new regions and, when a good region is located, allow the algorithm to exploit the search space to rene solutions. This is a sequential approach to balancing exploration and exploitation.
Another approach is to embed a local optimizer in between iterations of the global search heuristics. By doing this, exploration and exploitation occur in parallel [16]. Such hybrids of local and global search heuristics have been studied extensively in the evolu-tionary computation paradigm [24] and are generally referred to as memetic algorithms [25].
Al-Kazemi and Mohan [26] implemented a basic hill-climbing heuristic in their multi-phase PSO. Parti-cle positions are only updated if the new position im-proves on the tness of the previous position. Yin [27] used a basic hill-climbing heuristic within a discrete PSO to nd the optimal set of polygons to approximate digital curves. In this approach, each vertex of the polygons is adjusted sequentially to see if a better tness is obtained.
In the SwarmNAG, a local search heuristic is probabilistically applied to the current position of each particle to improve them, before their personal best
Figure 5. The local search heuristic procedure.
positions are updated. The probability of a local search heuristic is denoted by Pl.
The local search heuristic is based on the following idea: Given a particle position, xi, and its
correspond-ing subset of exploits, Ei, suppose there is an exploit,
ek =2 Ei, such that Ei [ fekg contains at least two
exploits other than ek, say ej1; ; ejl, with l 2 that
are redundant. Then, (Einfej1; ; ejlg) [ fekg is a
better subset of exploits than Ei. The gain of exploit
ek, with respect to Ei, is g(ek) = l 1. In this case, ek
is called a candidate dominant exploit.
As shown in Figure 5, the local search heuristic
rst chooses a candidate dominant exploit ek and
changes its corresponding element, xik, to 1. It then
eliminates the redundant exploits of the new position, using the algorithm already presented for eliminating redundant exploits. This process is repeated until no further improvement is possible.
PERFORMANCE MEASURES
This section presents two dierent measures used to evaluate the performance of the SwarmNAG.
Accuracy
Accuracy refers to the quality of the solution obtained, which is represented by the global best solution. The accuracy of the swarm at iteration t is simply the tness of the global best position,
accuracy(t) = f(^y(t)); (18)
where ^y(t) is the global best position at iteration t. Diversity
Diversity is an important measure that may be used to describe the amount of exploration a PSO algorithm still performs and to detect stagnation situations. Large diversity implies that a large area of the search space can be explored. In simple terms, diversity can
be dened as the degree of dispersion of particles. A diversity measure is dened based on the Hamming distance between particle positions in the swarm,
diversity(t) =n 2
s(ns 1) ns
X
i=1 ns
X
j=i+1
H(xi(t); xj(t));
(19) where ns is the swarm size and H(xi(t); xj(t)) is the
number of dierent bits between the particle positions, xi and xj, at iteration t.
EXPERIMENTS
In order to evaluate the performance of the Swarm-NAG, the experiments were performed over a sample network attack graph and several randomly generated large-scale network attack graphs.
Sample Network Attack Graph
Consider the network shown in Figure 6. There
are three target hosts, called RedHat, Windows and Fedora, on an internal network and a host, called PublicServer, on an isolated demilitarized zone (DMZ) network. One rewall separates the internal network from the DMZ and another rewall separates the DMZ from the rest of the Internet.
A number of services are running on each of the hosts of RedHat, Windows, Fedora and Public-Server. Also, each of the above hosts has a number of vulnerabilities. Vulnerability scanning tools, such as Nessus [20], can be used to nd the vulnerabilities of each host.
In Table A1 of Appendix A, dierent types of services and vulnerabilities available on the network hosts are introduced.
The RedHat host on the internal network is running FTP and SSH services. The Fedora host is running several services: LICQ chat software, Squid web proxy, FTP and a database. The LICQ client lets Linux users exchange text messages over the Internet and the Squid web proxy is a full-featured
web proxy cache that stores requested Internet objects on a system closer to the requesting site than to the source. Web browsers can then use the local Squid cache as a proxy server, reducing access time, as well as bandwidth consumption. The PublicServer host on the DMZ network is running IIS and Exchange services. The connectivity information among the network hosts is shown in Table 1. In this table, each entry corresponds to a pair of (hs, ht), in which hs is the
source host and ht is the target host. Every entry has
ve Boolean values. These values are `T', if host hscan
connect to host ht on the ports of http, licq, ftp, ssh
and smtp, respectively.
The intruder launches his attack starting from a single host, Intruder, which lies on the outside network. His goal is to disrupt the database service on the host Fedora and, to achieve this goal, the intruder should gain the root privilege on this host.
There are wdir, fshell and sshd bof vulnerabilities on the RedHat host, scripting vulnerability on the Windows host, wdir, fshell, squid conf and licq ivv vulnerabilities on the Fedora host and iis bof and exchange ivv on the PublicServer host. Also, at and xterm programs on the RedHat and Fedora are vulner-able to buer overow.
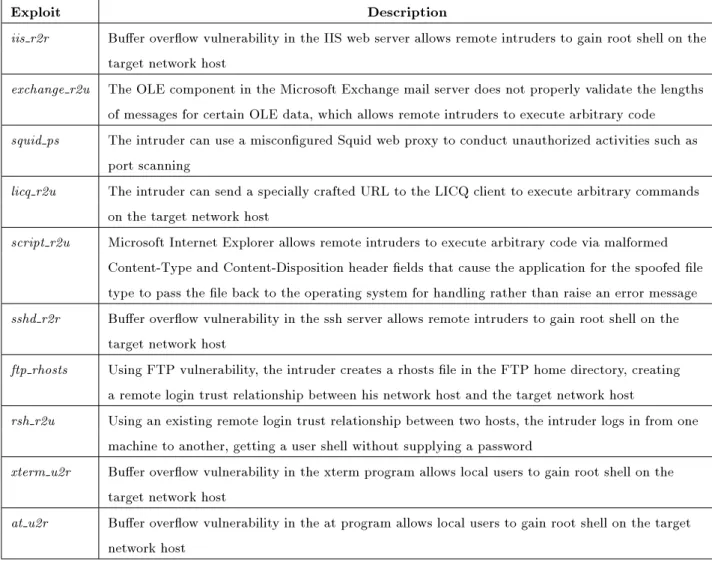
The intruder can use ten generic exploits. In Appendix B, the description of each generic exploit is given in Table B1, and in Table B2 each generic exploit is represented by its preconditions and postconditions. More information about each of the exploits is available in [28]. Before an exploit can be used, its preconditions must be met. Each exploit will increase the network vulnerability if it is successful.
Among the ten generic exploits shown in Ta-ble B2, the rst eight generic exploits require a pair of hosts and the last two generic exploits require only one host. Therefore, there are 854+24 = 168 exploits in total, which the intruder can try. Each attack scenario for the above network consists of a subset of these 168 exploits. For example, consider the following attack scenario:
1. iis r2r(Intruder, PublicServer); 2. squid ps(PublicServer, Fedora); 3. licq r2u(PublicServer, Fedora); 4. xterm u2r(Fedora, Fedora).
The intruder rst launches the iis r2r exploit to gain root privilege on the PublicServer host. Then, he uses the PublicServer host to launch a port scan via the vulnerable Squid web proxy running on the Fedora host. The scan discovers that it is possible to gain user privilege on the Fedora host by launching the licq r2u exploit. After that, a simple local buer overow gives the intruder root privilege on the Fedora host.
The attack graph for the above network consists of 164 attack scenarios. Each attack scenario consists of between 4 to 9 exploits.
Experimental Results
The SwarmNAG was applied for the minimization anal-ysis of the above network attack graph. To evaluate the performance of the algorithm, several experiments were performed. In the rst experiment, it was assumed that all exploits are preventable. Therefore, the aim was to nd a minimum critical set of exploits among 168 exploits. Using the SwarmNAG, the following minimum critical set of exploits was found:
CR = fiis r2r(Intruder,PublicServer),
exchange r2u(Intruder, PublicServer)g: In the second experiment, it was assumed that the generic exploits, iis r2r, exchange r2u and xterm u2r, are inevitable, i.e., the prevention of them is not feasi-ble or incurs high cost. Therefore, the aim was to nd a minimum critical set of exploits among 124 exploits. Using the SwarmNAG, the following minimum critical set of exploits was found:
CR = flicq r2u(PublicServer, Fedora), licq r2u(RedHat, Fedora),
script r2u(PublicServer, Windows), ftp rhosts(PublicServer, Fedora), ftp rhosts(RedHat, Fedora)g:
It should be mentioned that the exact cardinality of the minimum critical set of exploits for this network
Table 1. Network connectivity information.
Host Intruder PublicServer RedHat Windows Fedora Intruder F,F,F,F,F T,F,F,F,T F,F,F,F,F F,F,F,F,F F,F,F,F,F PublicServer F,F,F,F,F T,F,F,F,T F,F,T,T,F F,F,F,F,F T,T,T,F,F RedHat F,F,F,F,F T,F,F,F,T F,F,T,T,F F,F,F,F,F T,T,T,F,F Windows F,F,F,F,F T,F,F,F,T F,F,T,T,F F,F,F,F,F T,T,T,F,F Fedora F,F,F,F,F T,F,F,F,T F,F,T,T,F F,F,F,F,F T,T,T,F,F
attack graph is 5, so, the above critical set of exploits found by the SwarmNAG is minimum. While using the approximation algorithm proposed by Sheyner et al. [3] and Jha et al. [4,5], the following minimum critical set of exploits was found:
CR = fscript r2u(PublicServer, Windows); at u2r(Fedora, Fedora);
sshd r2u(PublicServer, RedHat); ftp rhosts(PublicServer, RedHat); squid ps(PublicServer, Fedora); ftp rhosts(PublicServer, Fedora)g:
The second experiment shows that SwarmNAG can nd a critical set of exploits with less cardinality.
In the experiments, the parameters were set to c1= 2 and c2= 2, which are values commonly used in
the binary PSO literature. The swarm size was set to m = 15 and the maximum number of iterations was set to 150. The penalty coecient was set to 0:1 1:9 and the velocity clamping was set to 2 Vmax 4:5.
The probability of greedy mutation and the probability of local search were set to Pg = 0:90 and Pl = 0:90,
respectively.
Large-Scale Network Attack Graphs
A large computer network builds upon multiple plat-forms, runs dierent software packages and supports several modes of connectivity. Despite the best eorts of software architects and developers, each network host inevitably contains a number of vulnerabilities.
Several factors can make network attack graphs larger, so that nding a minimum critical set of exploits becomes more dicult. An obvious factor is the size of the network under analysis. Society has become increasingly dependent on computer networks and the trend towards larger networks will continue. For example, there are enterprises today consisting of tens of thousands of network hosts. Also, less secure networks clearly have larger network attack graphs. Each network host might have several exploitable vul-nerabilities. When considered across a large enterprise, network attack graphs become potentially large [29].
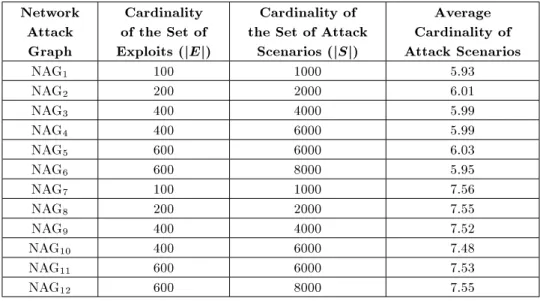
In order to further evaluate the performance of the SwarmNAG, 12 large-scale network attack graphs, denoted by NAG1; NAG2; ; NAG12, were generated.
For each network attack graph, dierent values for the cardinalities of E and S were considered, where E is the set of known exploits and S is the set of attack scenarios represented by the network attack graph. In NAG1; ; NAG6, attack scenarios consist
of between 3 to 9 exploits, while in NAG7; ; NAG12,
attack scenarios consist of between 3 to 12 exploits. Table 2 shows the cardinality of the set of known exploits, the cardinality of the set of attack scenarios and the average cardinality of attack scenarios for each generated large-scale network attack graph.
Experimental Results
The SwarmNAG was applied for the minimization anal-ysis of the above large-scale network attack graphs. 10 runs of each algorithm were performed, with dierent random seeds, and the best cardinality and the average cardinality of the critical sets of exploits obtained from these 10 runs were reported. The approximation algorithm proposed by Sheyner et al. [3] and Jha et
Table 2. Large-scale network attack graphs. Network
Attack Graph
Cardinality of the Set of Exploits (jEj)
Cardinality of the Set of Attack
Scenarios (jSj)
Average Cardinality of Attack Scenarios
NAG1 100 1000 5.93
NAG2 200 2000 6.01
NAG3 400 4000 5.99
NAG4 400 6000 5.99
NAG5 600 6000 6.03
NAG6 600 8000 5.95
NAG7 100 1000 7.56
NAG8 200 2000 7.55
NAG9 400 4000 7.52
NAG10 400 6000 7.48
NAG11 600 6000 7.53
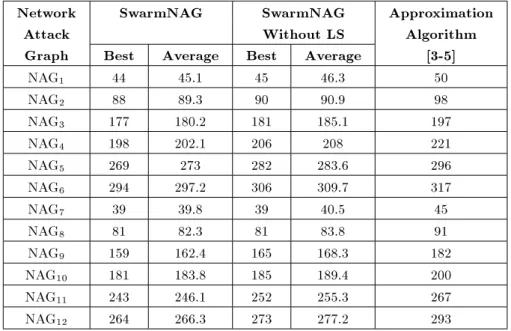
Table 3. The cardinality of critical set of exploits.
Network SwarmNAG SwarmNAG Approximation Attack Without LS Algorithm Graph Best Average Best Average [3-5]
NAG1 44 45.1 45 46.3 50
NAG2 88 89.3 90 90.9 98
NAG3 177 180.2 181 185.1 197
NAG4 198 202.1 206 208 221
NAG5 269 273 282 283.6 296
NAG6 294 297.2 306 309.7 317
NAG7 39 39.8 39 40.5 45
NAG8 81 82.3 81 83.8 91
NAG9 159 162.4 165 168.3 182
NAG10 181 183.8 185 189.4 200
NAG11 243 246.1 252 255.3 267
NAG12 264 266.3 273 277.2 293
al. [4,5] was also applied to analyze the above network attack graphs. Table 3 shows the results.
As shown in Table 3, the SwarmNAG outperforms the approximation algorithm and nds a critical set of exploits with less cardinality. Also, the SwarmNAG performs better than the SwarmNAG without the local search heuristic.
In the experiments, the parameters were set to
c1 = 2 and c2 = 2, which are values commonly
used in binary PSO literature. The swarm size was set to m = 15, the penalty coecient was set to 0:1 1:9 and the velocity clamping was set to
2 Vmax 4:5. The probability of greedy mutation
and the probability of local search were set to Pg= 0:90
and Pl = 0:90, respectively. Also, the maximum
number of iterations was set to 150 for the minimization analysis of NAG1and NAG7, 300 for the minimization
analysis of NAG2and NAG8, 600 for the minimizatoin
analysis of NAG3, NAG4, NAG9 and NAG10, and 900
for the minimizatoin analysis of NAG5, NAG6, NAG11
and NAG12.
Figures 7 and 8 show the progress of the number of attack scenarios hit by the global best position of the best run and the number of exploits corresponding to that position in the experiments for the minimizatoin
analysis of NAG4 and NAG11, respectively. The
number of attack scenarios hit by the global best position is expected to be as large as possible, while the number of exploits corresponding to that position is expected to be as small as possible.
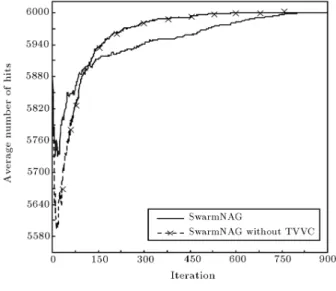
As mentioned before, diversity is an important measure that may be used to describe the amount of exploration a PSO algorithm performs. Large diversity implies that a large area of the search space can be explored.
Figures 9 to 11 show the average diversity of the SwarmNAG and the SwarmNAG without TVVC, obtained from 10 runs of the SwarmNAG and 10 runs of the SwarmNAG without TVVC in the experiments for the minimizatoin analysis of NAG3, NAG8and NAG11,
respectively. For the SwarmNAG without TVVC, the velocity clamping was xed to Vmax= 4.
As Figures 9 to 11 show, the SwarmNAG explores the search space better than the SwarmNAG without TVVC.
Figure 12 shows the progress of the average num-ber of attack scenarios hit by the global best position and the average number of exploits corresponding to that position, obtained from 10 runs of the SwarmNAG and 10 runs of the SwarmNAG without TVVC in the experiment for the minimizatoin analysis of NAG11.
As the above gures show, the SwarmNAG per-forms better than the SwarmNAG without TVVC and nds a critical set of exploits with less cardinality. CONCLUSIONS
Each attack scenario is a sequence of exploits launched by an intruder towards a particular goal. The collection of possible attack scenarios in a computer network can be represented by a directed graph, called a network attack graph (NAG). In this directed graph, each path, from an initial node to a goal node, corresponds to an attack scenario. The aim of the minimization analysis of a network attack graph is to nd a minimum critical set of exploits that completely disconnect the initial nodes and the goal nodes of the graph. This problem is, in fact, a constrained optimization problem, the objective of which is to nd a solution with minimum
Figure 7. Comparison of the performance of the SwarmNAG and the SwarmNAG without local search heuristic for the minimizatoin analysis of NAG4.
cardinality and the constraint is that the solution must be critical.
In this paper, a binary PSO algorithm, called SwarmNAG, was presented, for the minimizatoin anal-ysis of large-scale network attack graphs. A penalty function method with a time-varying penalty coe-cient was used to convert the constrained optimization problem into an unconstrained one. Also, a time-varying velocity clamping, a greedy mutation operator and a local search heuristic were used to improve the overall performance of the algorithm. The results of applying the above algorithms were reported, in order to analyze several large-scale network attack graphs. The approximation algorithm proposed by Sheyner
Figure 8. Comparison of the performance of the SwarmNAG and the SwarmNAG without local search heuristic for the minimization analysis of NAG11.
et al. [3] and Jha et al. [4,5] was also applied, to analyze the above large-scale network attack graphs. On average, the cardinality of critical sets of exploits found by the SwarmNAG was 8.89% less than the cardinality of critical sets of exploits found by the approximation algorithm.
The results of the experiments show that the SwarmNAG can be successfully used for the minimiza-tion analysis of network attack graphs.
ACKNOWLEDGMENTS
Figure 9. Comparison of the average diversity of the SwarmNAG and the SwarmNAG without TVCC in the experiments for the minimization analysis of NAG3.
Figure 10. Comparison of the average diversity of the SwarmNAG and the SwarmNAG without TVCC in the experiments for the minimization analysis of NAG8.
Figure 11. Comparison of the average diversity of the SwarmNAG and the SwarmNAG without TVCC in the experiments for the minimization analysis of NAG11.
Figure 12. Comparison of the performance of the SwarmNAG and the SwarmNAG without TVVC for the minimization analysis of NAG11.
REFERENCES
1. Abadi, M. and Jalili, S. \Automatic discovery of network attack scenarios using SPIN model checker", In Proceedings of the International Symposium on Telecommunications, Shiraz, Iran, pp. 81-86 (2005). 2. Phillips, C. and Swiler, L.P. \A graph-based system
for network-vulnerability analysis", In Proceedings of the 1998 Workshop on New Security Paradigms, Char-lottesville, VA, USA, pp. 71-79 (1998).
3. Sheyner, O., Haines, J., Jha, S., Lippmann, R. and Wing, J.M. \Automated generation and analysis of attack graphs", In Proceedings of the 2002 IEEE
Symposium on Security and Privacy, Berkeley, CA, USA, pp. 273-284 (2002).
4. Jha, S., Sheyner, O. and Wing, J.M. \Minimization and reliability analysis of attack graphs", Technical Report CMU-CS-02-109, School of Computer Science, Carnegie Mellon University (2002).
5. Jha, S., Sheyner, O. and Wing, J.M. \Two formal analyses of attack graphs", In Proceedings of the 15th IEEE Computer Security Foundations Workshop, Cape Breton, Nova Scotia, Canada, pp. 49-63 (2002). 6. NuSMV \NuSMV: A new symbolic model checker",
http://afrodite.itc.it:1024/~nusmv/.
7. Ammann, P., Wijesekera, D. and Kaushik, S. \Scal-able, graph-based network vulnerability analysis", In Proceedings of the 9th ACM Conference on Computer and Communications Security, Washington DC, USA, pp. 217-224 (2002).
8. Noel, S., Jacobs, M., Kalapa, P. and Jajodia, S. \Mul-tiple coordinated views for network attack graphs", In Proceedings of the IEEE Workshop on Visualization for Computer Security (VizSEC 2005), Minneapolis, MN, USA, pp. 99-106 (2005).
9. Mehta, V., Bartzis, C., Zhu, H., Clarke, E.M. and Wing, J.M. \Ranking attack graphs", In Proceedings of the 9th International Symposium on Recent Advances in Intrusion Detection (RAID 2006), Hamburg, Ger-many, pp. 127-144 (2006).
10. Kennedy, J. and Eberhart, R.C. \Particle swarm optimization", In Proceedings of the IEEE Interna-tional Joint Conference on Neural Networks, Perth, Australia, pp. 1942-1948 (1995).
11. Kennedy, J., Eberhart, R.C. and Shi, Y., Swarm Intelligence, Morgan Kaufmann, San Mateo, CA, USA (2001).
12. Parsopoulos, K.E. and Vrahatis, M.N. \Particle swarm optimizer in noisy and continuously changing envi-ronments", Articial Intelligence and Soft Computing, M.H. Hamza, Ed., IASTED/ACTA Press, Anaheim, CA, USA, pp. 289-294 (2001).
13. Vlachogiannis, J.G. and Lee, K.Y. \A comparative study on particle swarm optimization for optimal steady-state performance of power systems", IEEE Transactions on Power Systems, 21(4), pp. 1718-1728 (2006).
14. Vlachogiannis, J.G. \Constricted local-neighborhood particle swarm optimization with passive congregation applied in reactive power and voltage control", Electric Power Components and Systems, 34(5), pp. 509-520 (2006).
15. Hereford, J.M., Siebold, M. and Nichols, S. \Using the particle swarm optimization algorithm for robotic Search applications", In Proceedings of the 2007 IEEE Swarm Intelligence Symposium, Honolulu, HI, USA, pp. 53-59 (2007).
16. Engelbrecht, A.P., Fundamentals of Computational Swarm Intelligence, John Wiley & Sons, Hoboken, NJ, USA (2005).
17. Eberhart, R.C., Simpson, P. and Dobbins, R., Com-putational Intelligence PC Tools, Academic Press, San Diego, CA, USA (1996).
18. Shi, Y. \Particle Swarm Optimization", IEEE Connec-tions, 2(1), pp. 8-13 (2004).
19. Kennedy, J. and Eberhart, R.C. \A discrete binary ver-sion of the particle swarm algorithm", In Proceedings of the 1997 IEEE International Conference on Systems, Man, and Cybernetics, Orlando, FL, USA, pp. 4104-4109 (1997).
20. Deraison, R. \Nessus Vulnerability Scanner", http://www.nessus.org.
21. Shi, Y. and Eberhart, R.C. \Empirical study of particle swarm optimization", In Proceedings of the 1999 IEEE Congress on Evolutionary Computation, Washington DC, USA, pp. 1945-1950 (1999).
22. Hendtlass, T. and Randall, M. \A survey of ant colony and particle swarm meta-heuristics and their applica-tion to discrete optimisaapplica-tion problems", In Proceedings of the Inaugural Workshop on Articial Life, Adelaide, Australia, pp. 15-25 (2001).
23. Braendler, D. and Hendtlass, T. \The suitability of particle swarm optimisation for training neural hard-ware", In Proceedings of the 15th International Con-ference on Industrial and Engineering, Applications of Articial Intelligence and Expert Systems, Cairns, Australia, LNCS 2358, pp. 190-199 (2002).
24. Eiben, A.E. and Smith, J.E., Introduction to Evolu-tionary Computing, Springer-Verlag, Berlin, Germany (2003).
25. Krasnogor, N., Aragon, A. and Pacheco, J. \Memetic Algorithms", Metaheuristic Procedures for Training Neural Networks, E. Alba and R. Mart, Eds., Springer-Verlag, Berlin, Germany, pp. 225-248 (2006). 26. Al-Kazemi, B. and Mohan, C.K. \Multi-phase discrete particle swarm optimization", In Proceedings of the 4th International Workshop on Frontiers in Evolutionary Algorithms, Research Triangle Park, NC, USA, pp. 622-625 (2002).
27. Yin, P.-Y. \A discrete particle swarm algorithm for optimal polygonal approximation of digital curves", Journal of Visual Communication and Image Repre-sentation, 15(2), pp. 241-260 (2004).
28. CVE list; CVE: Common Vulnerabilities and Expo-sures: http://www.cve.mitre.org.
29. Ammann, P., Pamula, J., Ritchey, R. and Street, J. \A host-based approach to network attack chaining analysis", In Proceedings of the 2005 Annual Computer Security Applications Conference (ACSAC 2005), Tuc-son, AZ, USA, pp. 72-84 (2005).
APPENDIX A
Description of Vulnerabilities APPENDIX B
Table A1. Types of services and vulnerabilities running on the network hosts. iis bof(h) IIS web server has buer overow vulnerability on host h exchange ivv(h) Exchange mail server has input validation vulnerability on host h squid conf(h) Squid web proxy is miscongured on host h
licq ivv(h) LICQ client has input validation vulnerability on host h sshd bof(h) SSH server has buer overow vulnerability on host h scripting(h) HTML scripting is enabled on host h
ftp(h) FTP service is running on host h
wdir(h) FTP home directory is writable on host h fshell(h) FTP user has executable shell on host h
xterm bof(h) xterm program has buer overow vulnerability on host h at bof(h) at program has buer overow vulnerability on host h database(h) database service is running on host h
Table B1. Description of generic exploits.
Exploit Description
iis r2r Buer overow vulnerability in the IIS web server allows remote intruders to gain root shell on the target network host
exchange r2u The OLE component in the Microsoft Exchange mail server does not properly validate the lengths of messages for certain OLE data, which allows remote intruders to execute arbitrary code squid ps The intruder can use a miscongured Squid web proxy to conduct unauthorized activities such as
port scanning
licq r2u The intruder can send a specially crafted URL to the LICQ client to execute arbitrary commands on the target network host
script r2u Microsoft Internet Explorer allows remote intruders to execute arbitrary code via malformed Content-Type and Content-Disposition header elds that cause the application for the spoofed le type to pass the le back to the operating system for handling rather than raise an error message sshd r2r Buer overow vulnerability in the ssh server allows remote intruders to gain root shell on the
target network host
ftp rhosts Using FTP vulnerability, the intruder creates a rhosts le in the FTP home directory, creating a remote login trust relationship between his network host and the target network host
rsh r2u Using an existing remote login trust relationship between two hosts, the intruder logs in from one machine to another, getting a user shell without supplying a password
xterm u2r Buer overow vulnerability in the xterm program allows local users to gain root shell on the target network host
at u2r Buer overow vulnerability in the at program allows local users to gain root shell on the target network host
Table B2. Exploit templates.
Exploit Preconditions Postconditions iis bof(ht)
iis r2r(hs, ht) C(hs, ht, http) : iis(ht)
plvl(hs) user plvl(ht) := root
plvl(ht) < root
exchange ivv(ht)
exchange r2u(hs, ht) C(hs, ht, smtp) plvl(ht) := user
plvl(hs) user
plvl(ht) = none
squid conf(ht)
squid ps(hs, ht) : scan scan
C(hs, ht, http)
plvl(hs) user
licq ivv(ht)
scan
licq r2u(hs, ht) C(hs, ht, licq) plvl(ht) := user
plvl(hs) user
plvl(ht) = none
scripting(ht)
script r2u(hs, ht) C(ht, hs, http) plvl(ht) := user
plvl(hs) user
plvl(ht) = none
sshd bof(ht)
sshd r2r(hs, ht) C(hs, ht, ssh) :ssh(ht)
plvl(hs) user plvl(ht) := root
plvl(ht) < root
ftp(ht)
wdir(ht)
ftp rhosts(hs, ht) fshell(ht) T (ht, hs)
:T(ht, hs)
C(hs, ht, ftp)
plvl(hs) user
T(ht, hs)
rsh r2u(hs, ht) plvl(hs) user plvl(ht) := user
plvl(ht) = none
xterm u2r(ht, ht) xterm bof(ht) plvl(ht) := root
plvl(ht) = user
at u2r(ht, ht) at bof(ht) plvl(ht) := root