Waste-Load Allocation Model for Seasonal River
Water Quality Management: Application of
Sequential Dynamic Genetic Algorithms
R. Kerachian
1and M. Karamouz
In this paper, an extension of classical waste-load allocation models for river water quality management is presented to determine the monthly treatment or removal fraction of wastewater to evaporation ponds. The dimensionality of the problem, which is due to a large number of decision variables, is tackled by developing a new GA based optimization model, which is called a Sequential Dynamic Genetic Algorithm (SDGA). This is a deterministic multi-objective optimization model, which is linked to an unsteady water quality simulation model. The model minimizes the total losses incurred during the optimization time horizon, including the treatment or removal fraction costs and the costs associated with the deviation from water quality standards. The proposed model has been used for the water quality management and salinity reduction of the Karoon River in Iran. The results show the proposed model can eectively reduce the computational burden of the seasonal waste-load allocation problem. It is also shown that the seasonal waste-load allocation can signicantly reduce the number and duration of standards violations.
INTRODUCTION
Optimal waste-load allocation in river systems has been given considerable attention in the literature. Waste load allocation models determine the required removal fraction or treatment level at a set of point sources, not only to maintain water quality standards, but also to search the optimal values of other objectives, such as the minimization of the treatment cost and the magnitude or frequency of water quality violations.
Traditional waste-load allocation models have been formulated to minimize the total euent treat-ment cost, while satisfying water quality standards throughout the system (see 1-3] for more details). Most of the classical models incorporate the uncer-tainties of waste-load allocation problems by choosing one set of design conditions that include particular low ow values, such as the seven-day average low ow with a 10-year return period (7Q10) and the maximum observed water temperature. In recent eorts (such
1. Department of Civil Engineering, University of Tehran, Tehran, I.R. Iran.
*. Corresponding Author, Department of Civil and Envi-ronmental Engineering, Amirkabir University of Tech-nology, Tehran, I.R. Iran.
as those developed by Ellis 4], Burn 5] and Fujiwara et al. 6]), some sources of uncertainty, such as decay and reaeration rates have been explicitly considered. In these works, the chance constraint method is used to develop the stochastic waste-load allocation model for low ow conditions. Sasikumar and Mujmadar 7] developed a fuzzy linear optimization formulation for classical waste-load allocation. They incorporated the objective functions of dierent decision-makers as a fuzzy utility function, but their model was linear and deterministic. Takyi and Lence 8] used a multiple realization approach to calculate the trade-o between treatment cost and the reliability of maintaining the river water quality standards. They used a heuristic and a neural network technique to reduce the compu-tational time required to solve multiple realization, but their model was linear and non-seasonal.
In conventional waste-load allocation schemes, static treatment levels are determined at individual point sources that typically involve high capital invest-ment. Variable strategies allow for dierent operations, depending on the season, stream-ow, temperature and current water quality levels 9]. The economic eciency of seasonal waste-load allocation models has been demonstrated by Boner and Furland 10], Herbay et al. 11], Ferrera and Dimino 12], Lence and Takyi 13]
and Takyi and Lence 14]. Because of the dimensional-ity problem of the seasonal waste-load allocation due to large number of decision variables in all previous works, dierent scenarios have been developed to approximate the seasonal treatment levels. Karamouz et al. 15] proposed a GA based optimization model to estimate the long-term average monthly treatment levels. In this study, a new multi-objectives waste-load allocation model is proposed, which can consider the tempo-ral variations of climatic and hydrologic conditions of the system and the qualitative and quantitative characteristics of the point loads. In their model, the monthly treatment or fraction removal policies can be determined.
In this paper, varying assimilative capacity of river systems are also explicitly considered in the development of the removal fraction policies of point sources using an unsteady water quality simulation model.
Genetic algorithms (GAs), which were initially introduced by Holland 16], have been converted to a powerful and attractive optimization approach by many investigators, but there have been limited pieces of literature describing the application of GAs to water quality management problems.
Ritzel et al. 17] developed a multi-objective model using Genetic Algorithms for the groundwater pollution problem. They showed that this search-based optimization method can be eectively used for the operation of complex water resources systems. Burn and Yulianti 18] have shown the capabilities of genetic algorithms for identifying solutions to classical waste-load allocation problems. They showed that GAs provide the robust and non-inferior solutions for deter-ministic waste-load allocation in low ow conditions.
In this study, the model proposed by Burn and Yulianti 18] and Karamouz et al. 15] are extended to provide the monthly removal fraction policies for point loads, using a combination of simulation and a new GA based optimization model. Other optimization methods, such as dynamic programming, cannot be easily used to solve monthly waste-load allocation problems because of the dimensionality problems. In the application of the dynamic programming method in waste-load allocation problems, the decision vari-ables can be the treatment eciency (removal frac-tion) of point loads and the state variables are the concentration of water quality variables across the river. Spatial dynamic programming can be easily used for traditional waste-load allocation in low ow conditions. In such a case, the temporal variation of the quantitative and qualitative characteristics of the system are not considered and there is only one state variable, which is the concentration of water quality variable just upstream or downstream of the point load at each spatial stage of the system. In seasonal
waste-load allocation problems, the state variable is the spatial variation of the concentration of the water quality variable along the river. Therefore, the state of the system, at each time step (stage), can be shown by a set of values for the concentration of the water quality variable at just the upstream or downstream of each point source along the river. In such a case, the computational burden considerably limits the application of DP models.
In this study, the signicant dimensionality prob-lem of the seasonal waste-load allocation is tackled using a proposed Sequential Dynamic Genetic Algo-rithm (SDGA) optimization model. In this new model, the number of decision variables and the length of chromosome (set of decision variables) are sequentially increased and the capability of classical GA models in solving the complex problems is eectively improved. The SDGA can be easily linked to water quality simulation models and can, also, incorporate dierent conicting objectives. The model is used for TDS load allocation in the Karoon River. The results show that the seasonal waste-load allocation can signicantly reduce the number and duration of violating the stan-dards.
MODEL FORMULATION
In this section, formulation of a multi-objective opti-mization model is presented for providing the monthly waste-load allocation policies in a river system. This optimization model determines the optimal removal fraction at point sources to minimize two dierent objectives, namely, the total treatment cost and the loss associated with the positive deviation from water quality standards. When evaporation ponds are used instead of treatment plants, the model formulation is as follows:
MinimizeZ1=NS
X
i=1C(ai) (1)
MinimizeZ2=WE
X
t=1
0 @
NR
X
j=1(Vjt) 2
1
A (2)
Subject to :
cjt=f(xiqiciqucuDsksqscs) 8jts (3)
Vjt=
(
cjt;cstd if (cjt;cstd)>0 0 if (cjt;cstd)0
(4)
Sim+1=Sim+Qimxim;ailim (5)
where:
WE number of weekly time steps (known),
NS number of point sources (known),
C(ai) removal fraction cost of point loadi
during the planning horizon, which is equal to the construction cost of evaporation pondi with an area ofai ($, unknown),
NR number of check points along the river (known),
Vjt the magnitude of the positive water quality
deviation from standards in pointj at time stept (mg/L, unknown),
cjt concentration of the water quality variable
in pointj at time stept(mg/L, unknown),
xi time series of monthly removal fraction
at point sourcei(percent, unknown),
qi time series of the average monthly ow
rate of point loadibefore diversion to evaporation ponds (m3/s, known),
ci time series of the concentration of water
quality variable in point loadi
(mg/L, known),
qu time series of the daily ow rate of the headwater (m3/s, known),
cu time series of the daily concentration of
water quality variable in the headwater (mg/L, known),
ks time series of decay and growth coecients
in reachsof the river for non-conservative constituents (1/day, known),
Ds time series of dispersion coecients in
reachsof the river (m2/s, known),
cstd standard level for the water quality
variable (mg/L, known),
qs time series of the average monthly lateral
ow due to local ows, surface and groundwater interaction or water withdrawal in reachsof the river (m3/s, known),
cs time series of the average monthly quality
ofqs(mg/L, known),
f a non-linear function that is dened using an unsteady water quality simulation model (known),
lim monthly average depth of water loss due to
evaporation and inltration in evaporation pondsi in monthm(m/month, known),
Sim volume of evaporation pond at the end of
monthm(m3),
Qim ow volume of point loadiin monthm
before diversion to evaporation ponds (m3, known),
dmaxi maximum depth of the evaporation pond
i(m, known).
Equation 1 denes the removal fraction cost of
the system, during the planning horizon. Equation 2 denes the sum of the square of the weekly positive violations from the water quality standards during the planning horizon. Equation 3 denes the time series of the concentration of the water quality variable at each point, j, which is evaluated using a one-dimensional unsteady simulation model. In Equation 2, negative violation (i.e., when total dissolved solids (TDS) concentration is less than the TDS standard level) is assumed to be zero (Equation 4). As the evaporation and inltration volumes of each evapora-tion pond are related to its area, the maximum area of each evaporation pond,i, is calculated, using a trial and error process, considering the maximum depth of each pond as (dmaxi).
The results of this optimization-simulation model can be used to derive the monthly treatment or removal policies at each point source, considering the long-term quantitative and qualitative conditions of the river and the point loads.
In this study, a combination of the "-constraint method and a proposed genetic algorithm is used to provide the optimal solution considering dierent objectives. The"-constraint method is one of the most powerful techniques for generating the non-dominated set, when the objective functions and constraints are non-linear. In this method, the basic strategy is to transform a multi-objective problem into a series of single-objective problems that can be solved using single objective optimization methods such as genetic algorithms. The"-constraint method oers the advan-tage of better control over search algorithms for the non-dominated set. This method for a maximization problem with m objectives can be summarized as follows:
Step 1 Solve m individual maximization problems to nd the optimal solution for each of the indi-vidualmobjectives
Step 2 Compute the value of each of the objectives and determine the potential range of values for each of themobjectives
Step 3 Select a single objective (Zh) to be maximized.
Transform the remaining m;1 objectives in the form of:
ZkLk k= 12h;1h+ 1m: (7) Add these newm;1 constraints to the original set of constraints, where Lk represents the
right-hand-side values that will be varied Step 4 For each of the objectives and the associated
range of potential values, select the desired level of resolution and divide the range into the number of intervals determined by this level of resolution in order to ndLk
Step 5 Solve the problem of Step 3 for every combi-nation of right-hand-side values determined in Step 4. These solutions form the approxima-tion for the non-dominated surface. (For more details see 19,20].)
In this study, the non-dominated solution of the " -constraint method are calculated using the proposed SDGA model.
SIMULATION MODEL FORMULATION
The basic equation of the water quality simulation model developed in this study is based on a one-dimensional advection-dispersion mass transport equa-tion, which is numerically integrated over space and time for each water quality constituent. This equation includes the eect of advection, dispersion, dilution, constituent reactions and interactions and the ow sources and sinks. For any constituent concentration,
c, the mass transport can be written as follows:
@M @t = @
;
AxDL @c@x
@x ;
@(Axuc)
@x + (Axdx)dcdt +S(8)
where:
M the pollutant mass in the control volume (M),
x the distance along the river (L),
t time,
c the concentration of the pollutant (ML;3),
Ax the cross sectional area (L2),
DL the dispersion coecient (L2T;1),
u the mean velocity (LT;1),
S the external source or sink (MT;1),
dx the computational element length (L).
Considering M = V c, where V is the incremental volume (V = Axdx) and the steady state condition
of the ow in the stream, namely @Q@t = 0, Equation 8 can be written as follows:
@c @t =@
;
AxDL @c@x
Ax@x ;
@(Axuc)
Ax@x +dcdt+V :S (9)
The terms on the right-hand side of the equation represent dispersion, advection, constituent changes and external sources/sinks, respectively. dc=dt refers only to the constituent changes, such as growth and decay and should not be confused with the term
@c=dt, the local concentration gradient. The term
@c=dtincludes the eect of constituent changes, as well as dispersion, advection, source/sinks and dilutions. Changes that occur to individual constituents or par-ticles independent of advection, dispersion and waste input are dened by the term 21]:
dc=dt=rc+p (10)
wherer is the rst order rate constant (T;1) andpis the internal constituent sources and sinks (ML;3T;1) (e.g., nutrient loss from algal growth, benthos sources, etc.).
For numerical solution of the above equations, an implicit backward nite dierence method, developed by Brown and Barnwell 21], is used in this study.
SEQUENTIAL DYNAMIC GENETIC
ALGORITHM
Genetic algorithms are adaptive methods trying to imitate biological and genetic processes and can be successfully applied to optimization problems. The main eld of application of GAs includes problems with high complexity and non-linear behavior, such as seasonal waste-load allocation. More details of genetic algorithms can be obtained from publications such as 22,23]. Genetic algorithms usually consist of the following steps:
Step 1 Representation or encoding of the decision variables and joining them in a chromosome, which is a string of encoded decision variables, Step 2 Creating an initial population (rst
genera-tion),
Step 3 Determination of the tness of every chromo-some (set of decision variables) in the current population (tness evaluation),
Step 4 Selection of the better chromosomes to mate and perform the crossover operator for shuf-ing the selected chromosomes (genetic opera-tor 1),
Step 5 Performing mutation for selected chromosomes (genetic operator 2),
Step 6 Repeating Steps 3 to 5 to obtain the optimal or near optimal solutions.
In other words, GAs start with a population of chromosomes and combines them through genetic operators to produce better or tter chromosomes. GAs do not guarantee that a new solution will be better than the ones before, but they guarantee that the probability of being better is higher 24].
Simple Genetic Algorithms can be easily used for seasonal waste-load allocation in short term plan-ning 15], but the chromosome length and the di-mensionality problems of the model are considerably increased in a long-term river water quality manage-ment. In this study, a new GA based optimiza-tion algorithm is proposed, based on the sequential game theory. In this new methodology that is called Sequential Dynamic Genetic Algorithm (SDGA), the number of chromosome genes (chromosome length) is sequentially increased to eectively lead the initial
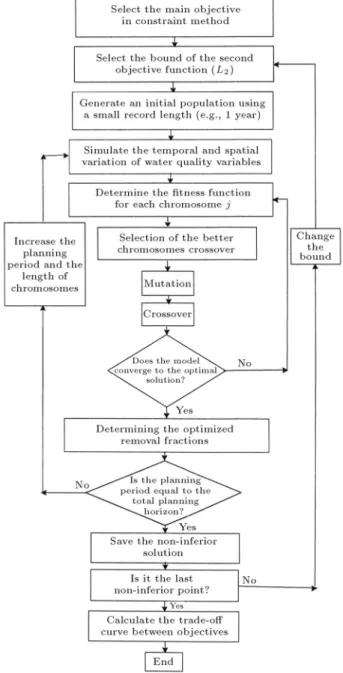
feasible solutions to the global optimal solution. As can be seen in Figure 1, in the rst step, a small record of quantitative and qualitative characteristics of stream-ows and point loads (and, therefore, a small chromosome length) are selected and the optimal levels of the monthly removal fraction for point loads are obtained using the traditional GA-based optimization model. Then, the chromosome length is increased sequentially and the optimum solution of the rst step is placed in the rst part of the new chromosomes. Each step (length of chromosomes) can vary from one month to 1 or 2 years. The step length is determined, based on the convergence characteristics of the GA model. This sequential method eectively reduces the
Figure1. The owchart of multi-objective Sequential
Dynamic Genetic Algorithms (SDGA).
computational burden of GA-based models in the long-term planning and management of water resources. As shown in Figure 1, this proposed SDGA model is used in the "-constraint multi-objective method and each optimal solution of the SDGA model provides one non-dominated point on the trade-o curve of the two objectives.
In this study, dierent components of the SDGA model for waste-load allocation in river systems have been developed with the following characteristics.
Decoding and Creating an Initial Population
The prior requirement for coding a problem is to represent every potential solution by nding a suitable representation of the parameters of the problem and joining them in a string. The common representation method is to use the binary values. An overview of other possible methods is given in 23]. The encoded parameter is referred to a gene and a string of genes (chromosome) represents one possible solution to the problem. A solution vector represents the required pollutant removal level at each point source in dierent months of the planning horizon. Therefore, each chromosome consists ofNSNY12 genes, whereNS is the number of point sources and NY is the number of years in the planning horizon.
Over the last 10 years, various encoding methods have been proposed to provide eective GA models. In this study, binary coding is used to represent treatment levels. In this binary coding, 00, 01, 10, 11 are used to represent 0, 0.25, 0.50 and 0.75 treatment levels, respectively. Burn and Yulianti 18] have used a similar encoding method. In the binary encoding method, the large jumps in variable values between generations, proposed by Goldberg 25], can be limited using gray coding. In this method, which has been used in this study, the binary representation of each variable changes in each sequence with no more than one binary digit. This binary encoding and discretization of deci-sion variables can reduce the computational burden of the seasonal waste-load allocation problem eectively. Details of encoding methods can be obtained in the work of Gen and Cheng 23].
The initial population of chromosomes is selected randomly. These strings are, then decoded to cor-responding nodal removal fractions to calculate the tness value of each chromosome in the population.
Fitness Evaluation and Selection of
Chromosome
The actual evolutionary process consists of several steps. In the rst step, the tness of each chromosome (the goodness of each solution) in the population is de-termined. In the second step (the selection phase), the
better chromosomes for next generations are selected. Mimicking the biological process of the survival of the ttest, as stated by Burn and Yulianti 18], the solution that has higher tness is more likely to be selected. In the next step, the selected chromosomes are shued or recombined using crossover and mutation reproduction operators.
In this study, the tness of each chromosome in the population is calculated using an unsteady water quality simulation model. The simulation model, which will be described in the next section, calculates the daily concentration of dierent water quality variables along the river. The tness of each chromosome is calculated, based on the required removal cost or the loss corresponding to violating water quality standards. One of the important operators that are generally used in the GA-based optimization is the niche oper-ator 25-27]. In the simple GAs, selection drives the evolving population toward a uniform distribution of the copies of the most tted chromosomes that could reduce the diversity of the population and cause a premature convergence. Niching induces restoration pressure to balance the convergence pressure of the selection. Investigators have proposed many dier-ent methods for the niche operator. Goldberg and Richardson 28] have detailed a practical scheme that directly uses the sharing metaphor to induce niche and species. In this method, a sharing function is dened to determine the neighborhood and degree of sharing for each chromosome in the population. The basic idea of the tness sharing method is to restrict the unlimited growth of certain individuals by enforcing each chromosome to share its tness with other nearby chromosomes in the same niche. In the tness sharing method proposed by Goldberg and Richardson 28], the tness of each chromosome in the population is modied according to the following tness sharing scheme:
Modied tness function of choromosome
n= tness function of choromosomenpopP n
j=1Sh(djn)
(11)
where npop is the population size in each generation and Sh() is the sharing function of a measure of distance, (djn), between two chromosomes, j and n.
The measure of distance between two chromosomes,j
andn(djn), is determined as follows:
djn=
s
ngensP
i=1((Pij;Pin)=(Pmax i
;Pmin i))
2
ngens
8j2choromosome population (12)
where:
Pij value of geneiin chromosomej,
Pin value of geneiin chromosomen,
Pmaxi=Pmini maximum/minimum value of genei in all of the chromosomes,
ngens total number of genes in each chromosome.
The sharing function is as follows:
Sh(djn)=
(
1;(djn=Lmin) ifdjn< Lmin
0 otherwise 8jn
(13) whereLminis a constant controlling the size of niches
(see 29] for more details). The chromosomes separated byLmindo not degrade the tness of each other.
Useful selection methods, such as Roulette Wheel, Tournament, Linear Ranking, Exponential Ranking and Truncation Selection and their properties, were discussed by Cantu'-Paz 30]. The more general methods are the Tournament and Roulette Wheel selection. In the rst method, a group of individuals are chosen randomly and the individual with the highest tness is selected for inclusion in the next generation. This process is repeated until appropriate numbers of individuals are selected for the new generation. The Roulette Wheel selection is the simplest method that selects the best chromosome according to the ratio of the tness of each chromosome to the sum of all the tness values related to all chromosomes.
In this paper, the Tournament selection, which is widely used in literature such as 31], is selected for the SDGA model.
Crossover and Mutation
The reproduction operators, known as crossover and mutation, create new chromosomes. Crossover opera-tors randomly take one pair that performs well from the mating pool and by exchanging important building blocks between two chromosomes, a new pair is ob-tained. It is assumed that the good performance of a chromosome is due to good sub-chromosomes, namely, the crossover operator combines the good building blocks (with better tness) of chromosomes, which is likely to provide better solutions. Michalewicz 22] described three crossover methods, namely, one-point, two-point and uniform crossover, but there is no con-sensus among investigators whether there is a generally superior crossover method. Crossover occurs between two selected chromosomes with a specic probability (Pc). In other words, the probability of the crossover
of two selected chromosomes is Pc. The one-point
crossover, which has been selected for this study, randomly chooses a position (gene) in the chromosome,
and new chromosomes are obtained by swapping all genes after that position. In binary encoding, the crossover should occur only at gene boundaries to protect the splitting of genes. Each gene consists of two bits in this study.
Mutation is an important process that can provide diversity and new genetic information to the population and prevents premature convergence to local optimal solutions. The mutation operator changes randomly the bit value (e.g., number one becomes zero and vice-versa) with a probability ofPm23].
CASE STUDY
The Karoon River, being more than 450 km long (between the Gotvand Dam and the Persian Gulf) and with an annual average discharge of 11891 MCM, is the biggest river in Iran, located in the southwestern part of the country. A part of the river that is located downstream of the Gotvand Dam supplies the water demands of more than 700,000 hectares of agricultural networks, eight cities and several industries. The domestic and agricultural waste-loads and agricultural return ows, as well as interaction between the river and aquifer, have severely decreased the water quality of the river. Recent investigations on the river have shown that concentrations of most of the water qual-ity variables, such as Total Dissolved Solids (TDS), Chemical Oxygen Demand (COD), Coliform bacteria, total phosphorus, Cd, and Ni, have deviated adversely from the stream water quality standards and more than 90 percent of industrial euents, agricultural or agro-industrial return ows violate the euent standards. As salinity is the most devastating problem of the sys-tem, TDS concentration is considered as an indicator of the water quality variable 32].
In this study, an important section of the Karoon River, with a length of 190 km, between the Gotvand Dam and the Ahvaz metropolitan area, is considered to evaluate the eectiveness of the seasonal policies developed by the multi-objective GA-based waste-load allocation model for river water quality management. Some important cities, such as Gotvand, Shooshtar, Mollasani, Weis and Ahvaz are located in the study area and their domestic demands are supplied from the river. The river also provides the water demands of two major agro-industries and several strategic steel and petrochemical heavy industries in this region and two important cities, Khoramshahr and Abadan, at the downstream end of the river.
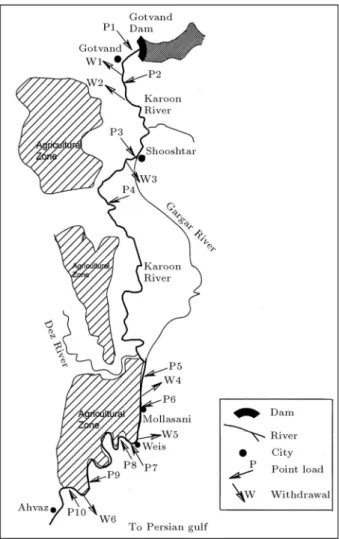
As shown in Figure 2, there are two important tributaries, namely, the Dez and Gargar Rivers. The Gargar is actually a branch of the main river, but is considered as two tributaries for modeling purposes. As water treatment plants in the cities cannot remove the salinity of the water supplied from the river, it
Figure 2. A part of the Karoon River system located in
the study area 15].
has caused many complaints from the people in the study area. Therefore, water pollution control projects, such as the relocation or transfer of agricultural return ows to evaporation ponds, have been proposed and implemented.
The TDS concentration of the groundwater in the study area varies from 1500 to 9000 mg/L and groundwater resources are rarely used for water supply purposes. The high potential of evaporation (more than 3200 mm/year) and considerable cost of TDS removal, justify the diversion of a fraction of the point loads ow rate to the evaporation ponds, as a practical method for the Karoon River pollution reduction.
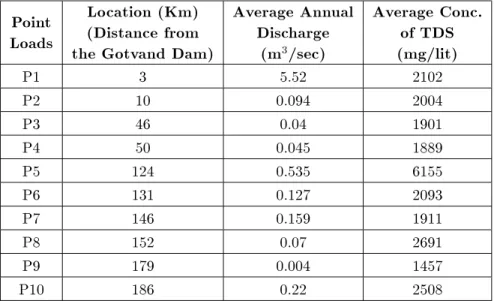
In this study, considering the spatial distribution of discharge points, 10 point loads, including the return ows of agriculture networks and agro-industrial sec-tors, are used for waste-load allocation in the Karoon River. The location and characteristics of these point loads are presented in Figure 2 and Table 1.
The daily data of river ow and the monthly quantitative and qualitative data of the point loads have been used in this study for the period 1992-2001. Even though the available data of the quality and
Table1. The characteristics of point loads of the Karoon River in the study area.
Point
Loads
the Gotvand Dam)
(Distance from
Location (Km)
Average Annual
Discharge
(m
3/sec)
Average Conc.
of TDS
(mg/lit)
P1 3 5.52 2102
P2 10 0.094 2004
P3 46 0.04 1901
P4 50 0.045 1889
P5 124 0.535 6155
P6 131 0.127 2093
P7 146 0.159 1911
P8 152 0.07 2691
P9 179 0.004 1457
P10 186 0.22 2508
quantity of point loads is monthly, the time step of the simulation model is selected to be daily to consider the short-term variations of the quality and quantity of the headwater. Local ows and their quality and the quantitative-qualitative interaction between the river and the aquifer have been estimated using the mass balance of water and total dissolved solids. The water quality simulation model has been developed and calibrated using the observed qualitative and quantita-tive data of the river, point loads and the estimated discharge and quality of the local and return ows. As an example, Figure 3 shows the observed and simulated concentration of TDS along the river in the month of July, which is a critical month, due to less river ow, high volume of withdrawal and return ows. As can be seen in this gure, the simulation model can be used for the evaluation of water quality management policies. The proposed model is applied to the Karoon River to obtain the optimal monthly removal fraction policies at the point sources considering dierent objec-tives, namely, minimization of the construction cost of
Figure3. The observed and simulated concentration of
TDS in month of July, 1999.
evaporation ponds and the loss of violation from water quality standards. In this study, each gene, which shows the removal fraction, has two bits. Therefore, for a 10-year planning horizon, each chromosome has 1200 genes and 2400 bits for 10 point loads. In order to nd a more stable solution, the probability of mutation and crossover were obtained using a trial and error process as 0.009 and 0.8, respectively. As mentioned before, the optimal volume of evaporation ponds is calculated us-ing a search-based optimization model and considerus-ing the time series of removal fractions (corresponding to simulating chromosomes) and monthly evaporation and inltration rates. The maximum water depth of each evaporation pond has been limited to 2 m, suggested as a standard of practice in the region. The construction cost of the evaporation ponds is also considered, based on the ongoing cost in Iran.
RESULT AND DISCUSSION
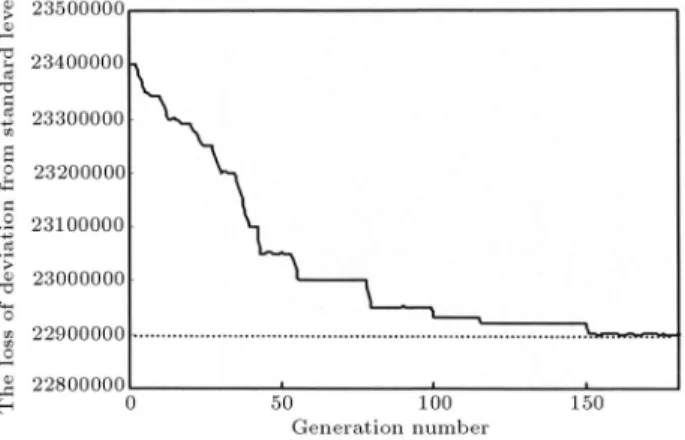
In this study, in the "-constraint multi-objective method, minimization of the deviation of TDS con-centration from water quality standards is considered as the main objective. As the river is supplying the drinking water of the cities and villages located in the study area, the maximum concentration of TDS is considered as 1200 mg/L. In the proposed SDGA model, at each step, the fraction of the planning horizon and the chromosome length is increased as one year or 120 genes, respectively. The number of generations at each step of the SDGA model is considered to be 150.
Figure 4 shows the tness improvement and re-duction of the total loss due to deviations from the wa-ter quality standard in the last step of the calculation of the SDGA model (with full length chromosomes). The
Figure4. Fitness improvement in the last step of SDGA
evolutionary process.
GA-based optimization model has found the optimal, or near optimal, solution after 150 generations.
To control the global optimality of the solution, as mentioned by Gen and Cheng 23], the evolutionary process is evaluated with a high probability of mutation and with a high number of generations. As shown in Figures 4 and 5, increasingPmfrom 0.009 to 0.1 results
in instability of the solutions, but does not provide a solution with a smaller violation loss (a violation loss less than the dashed lines in Figures 4 and 5). It is also demonstrated that by increasing the number of generations, the minimum loss is not improved, therefore, a global, or near to global, minimum has been reached. In this study, the eects of population size and the probability of crossover are also controlled. Having a larger population in each generation does not improve the tness of the optimal solution, but it can reduce the required number of generations to nd the global or near global solutions. Furthermore, decreasing the probability of crossover (Pc) can increase
the required number of generations for nding the optimal solution.
The runtime of the described model is about 5 hours using a Pentium IV (1400 MHz) computer. To evaluate the eectiveness of the SDGA model in
Figure5. Fitness improvement in evolutionary process
with high mutation probability (Pm= 0:1).
reducing computational time, it has been compared with the traditional genetic algorithm optimization model. As mentioned before, the SDGA can provide the optimal solution after 150 iterations in the last step of computations when the chromosomes have their maximum length. As shown in Figure 6, the traditional GAs can provide this solution with 3000 generations and a computational time of about 2.5 times the proposed method. Therefore, the SDGA can eectively reduce the computational time of classical GAs.
The "-constraint method provides the trade-o curve between the selected objectives. As can be seen in Figure 7, the violation from the standard level is unavoidable because of the high TDS concentration in the headwater (in some months in the planning horizon), local ows and interactions between surface and saline groundwater in certain months during the computational time horizon.
In general, frequency, duration and magnitude of the violation of water quality standards are perfor-mance indicators that present the reliability, resiliency and vulnerability of pollution management policies. The reliability indicator describes how likely or
of-Figure 6. Fitness improvement in traditional GA model
(chromosome length = 1200 genes,Pm= 0:009).
Figure 7. Trade-o curve between TDS removal cost
versus the loss associated with violating the standard level of 1200 mg/L.
Figure8. Trade-o curve between construction cost of
evaporation ponds and number of violations (day) during planning horizon.
ten the water quality goals may be achieved, while resiliency and vulnerability indicators represent how quickly the water quality systems recovers from a fail-ure and the severity of the consequences of violations of water quality standards, respectively. As shown in Figure 8, by increasing the construction costs of the evaporation ponds, the number of days, within which the river water quality in the study area violates from the water quality standards, is decreased from 127 to 52 days. In such a case, the average duration of water quality violation, which is an indicator of the resiliency of the system, is decreased from 32 to 15 days (Figure 9). As the maximum violation is not directly considered as an objective function of the model, the maximum violation reduction is equal to 30 mg/L. Figures 7, 8 and 9 could help the decision-makers to select the most favorable solution, based on their own set of priorities.
Table 2 presents the statistical characteristics of
Figure9. Trade-o curve between construction cost of
evaporation ponds and the average duration of violation periods (day).
the monthly removal fraction for dierent point sources. The proposed GA-based waste-load allocation model can provide the optimal value of the monthly removal fractions at each point source and the optimal area and the depth of evaporation ponds. The values of standard deviation present the variations of the monthly removal fractions. High variations of the average monthly removal fraction of each point load and, also, the high values of the standard deviation of the monthly removal fractions show the signicance of considering the seasonal waste-load allocation ap-proach.
The statistical characteristics of the removal frac-tion of point sources in the month of July and the optimal volume of evaporation ponds corresponding to an arbitrary point, A, in Figure 6, are presented in Tables 3 and 4. The high variation of the average monthly removal fractions and, also, the high value of their standard deviations, shows the signicance of Table2. The statistical characteristics of the monthly removal fraction of point source P1, downstream of the Gotvand
Dam, corresponding to the arbitrary point, A, in Figure 7.
Jan. Feb. Mar. Apr. May. Jun. July Aug. Sep. Oct. Nov. Dec.
Average Removal
Fraction (%)
35 40 30 30 35 52 48 52 40 40 43 27Standard Deviation
(%)
26 24 23 26 24 20 32 25 31 31 28 24Table3. Statistical characteristics of the monthly removal fraction of point sources in the month of July, corresponding to
the arbitrary point, A, in Figure 7.
Point Load
P1 P2 P3 P4 P5 P6 P7 P8 P9 P10
Average Removal
Fraction (%)
48 50 35 38 23 33 38 35 23 48Standard Deviation
Table4. The optimal area of evaporation ponds corresponding to the arbitrary point, A, in Figure 7.
Point Load P1 P2 P3 P4 P5 P6 P7 P8 P9 P10
Area (km
2)
9.8 0.18 0.07 0.09 1.28 0.22 0.4 0.18 0.01 0.49 the seasonal waste-load allocation, because, in thecon-ventional waste-load allocation methods, the treatment plants (or, in this case, the evaporation ponds) are designed based on the critical condition of the system. Based on the results of the model, the optimal monthly removal fraction polices have been developed for each point source. Table 5 presents the removal fraction policies derived for arbitrary point source P1, downstream of the Gotvand Dam, corresponding to point A in Figure 7. The equations in Table 5 provide the removal fraction policies at each point source, based on the quantitative and qualitative characteristics of the point load and the river at a section just upstream of the wastewater discharge point. As can be seen in this table, increasing the mass transport rate in the stream ow and the point load will increase the required removal fraction.
SUMMARY AND CONCLUSION
In this paper, the model developed by Burn and Yu-lianti 18] is extended to include the seasonal variations of the quantitative and qualitative characteristics of the river and point sources. It is also demonstrated that
the proposed SDGA optimization model can provide a robust and acceptable solution for a deterministic monthly waste-load allocation problem. This problem would be very dicult to solve using other optimization methods, such as the family of dynamic programming models, due to computational diculties. The pro-posed model uses the long-term qualitative and quanti-tative data of the river and its pollutants to derive the monthly fraction removal of the point sources. The proposed algorithm is applied to the monthly data of the Karoon River system in Iran. The algorithm has been tested using dierent probability for genetic algorithm operators and dierent population sizes, to reach the global or near global optimal solutions.
The approach can readily handle discrete decision variables and can eectively identify the trade-o between objectives, which are the removal cost and the sum of the square of the violations from water quality standards. The trade-o curves that show the variations of reliability, resiliency and vulnerability of the model based on dierent values of construction costs, can be a useful means for decision-makers to select the most favorable treatment levels considering the two objectives.
Table5. The monthly removal fraction policies for point loadP1 downstream of the Gotvand Dam, corresponding to the
arbitrary point, A, in Figure 7.
Month
Policy
R
January
rfJan.= 110 ;5q1Jan.c1Jan.+ 1:110 ;4q
0Jan.c0Jan. 0.8
February
rfFeb.= 3410 ;4q1Feb.c1Feb.+ 110 ;4q
0Feb.c0Feb. 0.85
March
rfMar.= 1310 ;4q1Mar.c1Mar.+ 110 ;4q
0Mar.c0Mar. 0.80
April
rfApr.= 2:610 ;3q1Apr.c1Apr.+ 1:110 ;4q
0Apr.c0Apr. 0.80
May
rfMay= 2210 ;4q1Mayc1May+ 1:210 ;4q
0Mayc0May 0.96
June
rfJun.= 3610 ;4q1Jun.c1Jun.+ 110 ;4q
0Jun.c0Jun. 0.92
July
rfJul.= 1210 ;4q1Jul.c1Jul.+ 210 ;3q
0Jul.c0Jul. 0.86
August
rfAug.= 5310 ;4q1Aug.c1Aug.+ 110 ;4q
0Aug.c0Aug. 0.91
September
rfSep.= 2:810 ;4q1Sep.c1Sep.+ 1:310 ;4q
0Sep.c0Sep. 0.84
October
rfOct.= 3610 ;4q1Oct.c1Oct.+ 1:110 ;4q
0Oct.c0Oct. 0.86
November
rfNov.= 16910 ;4q1Nov.c1Nov.+ 1310 ;5q
0Nov.c0Nov.;2:14 0.81
December
rfDec.= 4510 ;4q1Dec.c1Dec.+ 1010 ;5q
0Dec.c0Dec. 0.84 rft= removal fraction of point source P1 in montht(percent),
q
1t= streamow of point source P1 at month t(m
3/s), q0t= streamow in upstream of point-load P1 at montht(m
3/s), c0t= concentration in upstream of point-load P1 at montht(mg/L), R= correlation coecient.
The proposed model can be easily applied to a problem with more point sources, smaller time steps and a longer time horizon. The results show that the removal of all the point sources will not completely improve the quality of the streamow, due to inter-action between the river and saline groundwater, local ows and the low quality of headwater during some months of the planning horizon. Therefore, waste-load allocation models may not have a considerable eect on the improvement of water quality in the study area. However, the results of this study show that the proposed model can be easily used for water quality management of river systems and can provide optimal monthly operating polices. The results also show the signicant value of using the modied genetic algorithm in reduction of the burden of dimensionality of the seasonal waste-load allocation problems.
This is, perhaps, the rst time that monthly waste-load allocation policies are determined by linking the simulation and optimization models, considering the dynamic characteristics of the system. Another promising area of investigation is the development of monthly fraction removal policies, considering the uncertainties of system parameters and the vagueness of the water quality criteria and standards.
ACKNOWLEDGMENTS
This research is part of the Ph.D. dissertation of Dr. R. Kerachian in Civil and Environmental Engineering of Amirkabir University of Technology. This study was done in conjunction with the study of the Master Plan for Water Pollution Reduction of the Karoon River in Iran. The assistance of the managers and engineers of the Khuzestan Environmental Protection Agency, for providing data and site maps, as well as the technical contributions made by Mr. M. Mahmoodian and Mr. A. Ganji, are hereby acknowledged. The author would also like to acknowledge the reviewers for their insightful and constructive comments.
NOMENCLATURE
Ax cross sectional area (m2)
ai area of evaporation pondi(m2)
cjt concentration of the water quality
variable in point j at time step t
(mg/L)
C(ai) removal fraction cost of point loadi
during the planning horizon, which is equal to the construction cost of evaporation ponds,i, with area of ai
($)
cstd water quality standard level (mg/L)
cs time series of the quality ofqints (mg/L)
ci time series of the concentration of
water quality variable in point loadi
(mg/L)
cu time series of the daily concentration
of the headwater (mg/L)
Ds time series of dispersion coecients in
reachsof the river (m2/day)
DL dispersion coecient (m2/day)
djn measure of distance between two
chromosomes,j andn
di depth of evaporation pond,i(m)
dmaxi maximum depth of the evaporation
pond,i (m)
dx computational element length (m)
f a non-linear function that is dened using an unsteady water quality simulation model
ks time series of decay and growth
coecients in reachs of the river for non-conservative constituents (1/day)
Lk kth right-hand-side value
lim monthly average depth of water loss
due to evaporation and inltration in evaporation ponds,i, in monthm
(m/month, known)
Lmin specic distance criterion
M pollutant mass in the control volume (kg)
m number of objective functions
N number of time steps
NR number of checkpoints along the river
NS number of point sources
ngens number of genes (parameters) in each chromosome
npop population size in each generation
p internal constituent sources and sinks (mg/m3s)
Pc probability of crossover
Pij value of geneiin chromosomej
Pin value of geneiin chromosomen
Pm probability of mutation
Pmaxi maximum values of genei
Pmini minimum values of genei
Qmi ow volume of point load,i, in month
m before diversion to evaporation ponds (m3, known)
qi time series of the ow rate of point load,i, before diversion to evaporation ponds (m3/s)
qs time series of the lateral ow due to local ows, surface and groundwater interaction or water withdrawal in reachsof the river (m3/s)
qu time series of the daily ow rate of the headwater (m3/s)
r rst order rate constant (1/day)
rft removal fraction of point source P1 in
montht(percent)
S external source or sinks (mg/s)
Smi volume of evaporation pond at the end
of monthm(m3)
Sh sharing function
t time (s)
u mean velocity (m/s)
V incremental volume (m3)
Vjt the magnitude of water quality
deviation from standards in pointj at time stept(mg/L)
WE number of weekly time steps
xi time series of monthly removal fraction
at point source,i(percent)
x distance along the river (m)
Zk kth objective function
REFERENCES
1. Liebman, J.C. and Lynn, W.R. \The optimal allo-cation of stream dissolved oxygen", Water Resources Research,2(3), pp 581-591 (1966).
2. Loucks, D.P., ReVelle, C.S. and Lynn, W.R. \Linear programming models for water pollution control",
Mgmt. Sci.,14(4), pp B-166-B-181 (1967).
3. ReVelle, C., Loucks, D.P. and Lynn, W.R. \Linear programming applied to stream dissolved oxygen",
Water Resources Research,4(1), pp 1-9 (1968).
4. Ellis, J.H. \Stochastic water quality optimization using imbedded chance constraint", Water Resources Re-search,23(12), pp 2227-2338 (1987).
5. Burn, D.H. \Water quality management through com-bined simulation-optimization", Journal of Environ-mental Engineering, ASCE, 115(5), pp 1011-1024
(1989).
6. Fujiwara, O., Puangmaha, W. and Hanaki, K. \River basin water quality management in stochastic environ-ment",Journal of Environmental Engineering, ASCE,
114(4), pp 869-877 (1988).
7. Sasikumar, K. and Mujmadar, P.P. \Fuzzy optimiza-tion model for water quality management",Journal of Water Resources Planning and Management, ASCE,
124(2), pp 79-84 (1998).
8. Takyi, A.K. and Lence, B.J. \Surface water quality management using a multiple-realization chance con-straint method",Water Resources Research,35(5), pp
1657-1670 (1999).
9. Cardwell, H. and Ellis, H. \Stochastic dynamic pro-gramming models for water quality management",
Water Resources Research,29(4), pp 803-813 (1993).
10. Boner, M.C. and Furland, L.P. \Seasonal treatment and variable euent quality based on assimilative capacity", Res. J. Water Pollution Control Fed., 54,
pp 1408-1416 (1982).
11. Herbay, J.P., Smeers, Y. and Tyteca, D. \Water quality management with time varying river ow and discharger control",Water Resources Research,19(6),
pp 1481-1487 (1983).
12. Ferrara, R.A. and Dimino, M.A. \A case study analysis for seasonal nitrication: Economic eciency and water quality preservation", Res. J. Water Pollution Control Fed.,57, pp 763-769 (1985).
13. Lence, B.J. and Takyi, A.K. \Data requirements for seasonal discharge programs: An application of a regionalized sensitivity analysis", Water Resources Research,28(7), pp 1781-1789 (1992).
14. Takyi, A.K. and Lence, B.J. \Markov chain model for seasonal water quality management", Journal of Water Resources Planning and Management, ASCE,
121(2), pp 144-157 (1995).
15. Karamouz, M., Kerachian, R. and Mahmoodian, M. \Seasonal waste-load allocation model for river water quality management",Proceedings of 2003 World Wa-ter and Environmental Resources Congress, Philadel-phia, USA (2003).
16. Holland, J.H., Adaptation in Natural and Articial Systems, University of Michigan Press, Ann Arbor, Mich, USA (1975).
17. Ritzel, B.J., Eheart, J.W. and Ranjithan, S. \Using ge-netic algorithms to solve a multiple objective ground-water pollution problem",Water Resources Research,
30(5), pp 1589-1603 (1994).
18. Burn, D.H. and Yulianti, S. \Waste-load allocation using genetic algorithms",Journal of Water Resources Planning and Management, ASCE,127(2), pp 121-129
(2001).
19. Karamouz, M., Szidarovszky, F. and Zahraie, B.,
Water Resources System Analysis- with Emphasis on Conict Resolution, CRC Publishing, Boca Raton, Florida, USA, 33431 (2003).
20. ReVelle, C. and McGarity, A.E. \Design and operation of civil and environmental engineering systems", John Wiley and Sons, New York, NY, USA 10158-0012 (1997).
21. Brown, L.C. and Barnwell, O.,The Enhanced Stream Water Quality Models, QULA2E and QUAL2E-UNCAS: Documentation and User Manual, U.S. En-vironmental Protection Agency Publication (1987).
22. Michalewicz, Z., Genetic Algorithms + Data Struc-tures = Evolutionary Programs, Springer, New York, USA (1992).
23. Gen, M. and Cheng, R.,Genetic Algorithm and Engi-neering Optimization, John Wiley & Sons (2000). 24. Oliveira, R. and Loucks, D.P. \Operating rules for
multi-reservoir systems", Water Resources Research,
33(4), pp 839-851 (1997).
25. Goldberg, D.E., Genetic Algorithms in Search, Op-timization and Machine Learning, Addison-Wesley, Reading, Mass, USA, p 399 (1989).
26. Horn, J. and Nafpliotis, N. \Multi-objective optimiza-tion using the niched pareto genetic algorithm", Pro-ceeding of the First IEEE Conference on Evolutionary Computation,1, pp 82-87 (1993).
27. Mahfoud, S.W. \Niching methods for genetic algo-rithms", Ph.D. Thesis, University of Illinois, IL, USA, p 251 (1995).
28. Goldberg, D.E. and Richardson, J. \Genetic algo-rithms with sharing for multimodal optimization",
Proc. 2nd Int. Conf. on Genetic Algorithms, Cam-bridge, MA, USA, pp 41-49 (1987).
29. Fonseca, C. and Fleming, P. \Genetic algorithms for multiobjective optimization: Formulation, discussion and generalization", Proceedings of the 5th Interna-tional Conference on Genetic Algorithms, San Mateo, California, USA, pp 416-423 (1993).
30. Cantu'-Paz, E. \Order statistics and selection methods of evolutionary algorithms", Information Processing Letters,82, pp 15-22 (2002).
31. Karamouz, M., Khodatalab, N., Araghi Nejad, Sh. and Kerachian, R. \Operation of multi-purpose reservoirs: Application of genetic algorithms", Conference on Water Resources Planning and Management, ASCE, May 19-22, Virginia, USA (2002).
32. Karamouz, M. \A master plan for water resources pollution control in the Karoon River", Report pre-pared for Environmental Protection Agency, Tehran, Iran (2002).