l
Global Research
l
Important disclosures can be found in the Disclosures Appendix
All rights reserved. Standard Chartered Bank 2015 research.standardchartered.com Madhur Jha +44 20 7885 6530
Madhur.Jha@sc.com Economics Research Standard Chartered Bank
Samantha Amerasinghe +44 20 7885 6625 Samantha.Amerasinghe@sc.com
Economics Research Standard Chartered Bank John Calverley +1 905 534 0763 John.Calverley@sc.com Economics Research
Standard Chartered (Canada) Limited
Special Report
Global supply chains: New directions
Highlights
Global supply chains (GSCs) have transformed trade and the world economy in the last 30 years. We argue they will continue to expand, though more slowly than before, and could significantly boost productivity. But patterns will likely change.
Robotics could challenge the low-wage model while 3D printing could bring a shift to customised products, made locally. Offsetting this, better communications such as mobile and the Internet of Things should boost GSCs in both manufacturing and services.
The centre of gravity of low-cost manufacturing looks set to trend west from coastal China, inland and to ASEAN, India and eventually Africa. Improving infrastructure and new trade pacts including the Trans-Pacific Partnership and China’s initiatives may be key drivers.
Services trade is likely to grow fast as digital technology advances. Also, horizontal supply chains – trade between countries at the same wage level, based on firm-level excellence or consumer choice – are likely to grow, and expand among emerging countries.
Contents
Overview
3
Infographic: Three new directions for global supply chains 7
1. Global supply chains today
8
The role of global supply chains 9
Different ways to measure participation 13
Integration into GSCs 17
Conclusion – Maximising GSC participation 22
2. Drivers of change for GSCs
23
Developments in eight areas will shape trends 24
1. Increasing incomes and growing EM labour forces 24
2. Better communications technologies 25
3. New automation technologies 26
4. New trade pacts 27
5. Geopolitical tensions 30
6. The costs of trade 30
7. Sustainability issues 31
8. Relative wage costs 33
Conclusion: We expect supply chains to continue to grow 34
3. Three future GSC trends
35
1. China’s changing role 36
2. Services supply networks will likely grow 40
3. Horizontal trade is set to expand 49
4. Trends in trade finance
51
Innovation, automation and SME needs 52
Three new trends 55
Appendix: Global supply chains by industry 57
Country code 62
Bibliography 63
Special Report: Global supply chains: New directions
27 May 2015 3
O
ve
rvi
ew
Overview
As much as 80% of global trade is now reckoned to be part of global supply chains (GSCs), on one definition (see Part 1). Participation in GSCs has boosted growth and incomes in both developed and especially emerging markets (EM). World trade growth has been weak recently and the expansion of GSCs has lost momentum. Some of this slowdown is likely cyclical, but rising wages in China and new automation technologies are challenging the low-wage model, prompting companies to consider ‘re-shoring, or bringing production home.
Eight drivers of change
We believe eight drivers will shape the evolution of supply chains (see Part 2): 1. Increasing incomes and growing labour forces in emerging markets will
likely continue to support GSC growth. Rising GDP, more urbanisation, expanding middle classes and growing labour forces offering cheap labour should continue to support supply-chain expansion. The supply chain choices of the rising number of multinational companies headquartered in EM, particularly in Asia, should be increasingly important (Figure 1).
2. Better communications technologies should boost both manufacturing and services supply chains. Cheaper broadband, the cloud, smartphones, virtual reality systems, computer translation, the Internet of Things (IoT) and big data will support the growth of supply chains by making collaboration easier for manufacturing chains and enabling more services trade.
3. New automation technologies could be a constraint. Improving automation and robotics will likely compete with some low-skill tasks, making re-shoring easier and potentially unwinding some manufacturing chains. Meanwhile, 3D printing could lead to a big trend towards customised goods, ‘printed’ locally. 4. New trade pacts could be a major boost. There is a good chance that the
Trans-Pacific Partnership (TPP) and China’s Regional Comprehensive Economic Partnership (RCEP) will be agreed this year, with the Transatlantic Trade and Investment Partnership (TTIP) following. These new trade agreements are going ‘behind the border’ to address obstacles to supply chains, with a particular focus on facilitating services trade.
Figure 1: Forces driving global supply chains Positive and negative
More and longer GSCs Fewer and shorter GSCs
Continuing growth and rising urbanisation
Better communications – cheaper broadband, video-conferencing, virtual reality, IoT, etc
New trade pacts
Lower oil prices
New efficient low-wage countries to replace China
More service supply chains
More horizontal GSCs in EMs
Automation - robotics
3D printing - customisation
Geopolitical tensions
Higher oil prices
Sustainability concerns become prominent
O
ve
rvi
ew
5. Geopolitical tensions are a threat, though also are helping to encourage new trade pacts. Rivalries are likely one of the drivers of new trade agreements, but geopolitical tensions are also a potential threat to the growth of GSCs as firms fear that conflicts or sanctions could interrupt supplies.
6. Trade costs are falling, providing a significant boost. In our view improving infrastructure and streamlining customs procedures, as agreed in the recent Bali package, will lower costs significantly and boost GSCs. According to the OECD, every extra day needed to ready goods for export and import could reduce trade flows by up to 4%. The price of oil matters more for trade growth than sometimes realised. But even if oil prices return above USD 100/bbl next year (as we forecast), few now expect prices to march upwards for the foreseeable future, as was widely assumed until a year ago.
7. Sustainability issues are a potential constraint. Concerns about the impact of natural disasters such as Japan’s earthquake or Thailand’s floods have led some companies to think of shortening supply chains or even re-shoring. For most companies the response is to increase supply-chain resiliency by identifying potential risks, diversifying suppliers and holding higher inventories of key components. Longer-term, government and corporate policies around tackling climate change and resource scarcity could limit the growth of manufacturing supply chains, though we believe the impact will be modest. 8. Relative wage costs will likely be crucial. As China’s wage costs rise, new
low-cost centres are stepping up including among ASEAN countries, India and Bangladesh. The re-shoring trend in the US is partly driven by narrowing wage differentials, though higher oil prices and a new focus on the potential costs of separating design from manufacturing have also been factors. So far re-shoring has been fairly limited. But overseas wage costs will increasingly be compared with the price of automation and robotics.
Figure 2: China is the largest player in GSCs
Value of GSC participation USD bn, latest available data
Source: IMF DOTS, OECD (2013), Standard Chartered Research
0 200 400 600 800 1,000 1,200
Special Report: Global supply chains: New directions
27 May 2015 5
O
ve
rvi
ew
Three new directions for global supply chains
In our view the balance of these eight factors means that global supply chains will continue to expand. But the rapid growth of vertical manufacturing supply chains seen in the two decades to 2008 is unlikely to repeat. In those years world trade grew at about twice the pace of GDP as supply chains increased in length and complexity, taking advantage of the opening up of China and Eastern Europe. Recently world trade has grown only slightly faster than GDP. We expect trade growth to pick up gradually and return to nearer the long-term average of about 1.4 times GDP. We see three trends in supply chains that will help create this growth, but also take them in new directions:
1. A shift from China to lower-cost countries. This shift will likely be gradual as China still has lower-wage areas inland which, together with fast-growing productivity – including the rapid adoption of automation and robotics – could keep China competitive. Nevertheless, the centre of gravity for manufacturing will likely trend westward, towards ASEAN and India in particular. The ASEAN Economic Community, starting this year, will be an important support. Meanwhile, we expect China to cement its role as a ‘megatrader’ by leading the expansion of supply chains through international programmes such as the new Silk Road initiative and the RCEP trade agreement covering ASEAN countries, Australia, India, Japan, Korea and New Zealand.
2. Increasing services in supply chains. Measured in value-added terms, services likely already constitute more than half of the value of trade even though direct services trade is only about 20%. New technologies as well as new trade agreements are likely to boost the role of services in goods supply chains as well as direct services trade. New business services such as information and communications technology (ICT), finance and business process outsourcing (BPO) are growing rapidly, though the services supply chain is often more a hub-and-spoke model than a chain.
3. Expanding horizontal trade. Horizontal trade, based on firm-level excellence rather than differing wage costs, is prevalent in developed countries and should get a boost from the TTIP and TPP. Firms in developed countries routinely
Figure 3: Indian firms such as TCS are trying to move up the services GSC Upgrading in the Indian offshore services industry
Source: Fernandez-Stark et.al (2011), Standard Chartered Research
Programming Body shopping App. dev.
& main
IT Coding Packgd SW
support IS consult.
Ntwk infra support
Analytics Call centres IC chip design
R&D
Pkgd SW
Contract prod. dev. Equity analysis
Finance Datamining
Data entry/back office Datamining/
catalog prep
Doc digitisation Analysis
GIS Travel Rev. enhanc. etc.
Insur. Claim eval.
Radiology Transcription Medical/health
Va
lu
e-ad
de
d
Number of employees Types of actvities
O
ve
rvi
ew
source parts from suppliers in other countries, based on quality rather than low-cost production, while consumers choose products based on a range of factors, often blind to country of origin. Such trade is still much less common among emerging countries due to tariffs and other barriers. We believe it has enormous potential for expansion, with the help of new trade pacts and growing incomes.
Trade finance: Regulation, innovation and automation
The growth in global supply chains has led to a shift towards ‘open account’ financing, where the importer pays the exporter on receipt of goods. But bank-intermediated finance still plays a vital role in more than one-third of trade, in providing credit and liquidity as well as helping firms to manage risks. Bank-intermediated trade finance is particularly important in Asia. New know-your-client regulations as well as capital requirements are a challenge for banks, though the Basel III rules have been relaxed for trade finance, compared with the initial proposals. Meanwhile there is a big shift towards automating processes and taking advantage of mobile technology.
Special Report: Global supply chains: New directions
27 May 2015 7
Inf
o
g
raph
ics
Infographic: Three new directions for global supply chains
Source: Standard Chartered Research
Africa
Asia
Latin
America
North
America
Europe
Developed countries trade
to expand further
EM trade to expand
India
China
ASEAN
Africa
Coastal
Inland
1
Low-cost manufacturing will likely head west
Medical diagnostics
Education
Business processes ITC
Special Report: Global supply chains: New directions
27 May 2015 9
G
lob
al
sup
p
ly
chains t
o
d
ay
The role of global supply chains
Has their expansion slowed?
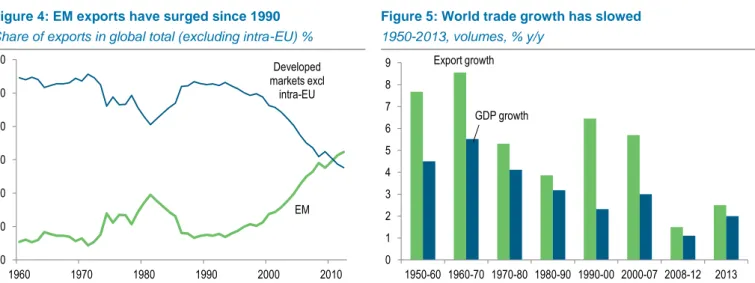
The rapid growth of supply chains across borders has transformed global production and trade over the past 30 years. GSCs, coordinated by transnational companies, now account for nearly 80% of global trade, including trade in intermediate goods and services of about USD 12tn or about 60% of global trade (UNCTAD, 2013). The expansion of vertical chains (where production is unbundled and simpler tasks are handled in low-wage countries) has contributed to rapid economic development in many emerging countries, particularly China, and taken the EM share of world exports to more than 50% (excluding intra-EU trade) (Figure 4). Meanwhile, horizontal chains (trade in similar goods between countries at similar wage levels) have increased enormously, particularly between developed countries, and especially within the EU (see Figure 6 for definitions). Both types of chains enable firms and countries to specialise in ‘tasks’ they do best, lowering costs, increasing choice and furthering development.
There are concerns now that the expansion of vertical supply chains may be over, or at least slowing, restraining overall world trade growth and, potentially, economic growth and development. World trade grew particularly strongly in the 1990-2007 period, about twice as fast as GDP. Since 2007 trade has risen by a compounded average of 1.1% annually, only just beating GDP growth of 1.0% (Figure 5).
Some of this anaemic trade performance is likely cyclical but some is probably structural, related to changes in GSC trends (Constantinescu, 2015). In this report, we look at how GSCs are evolving and their likely impact on global trade as well as how well countries are integrating into GSCs. We focus particularly on the role of China and the growth of services supply chains. Finally, we look at how trade finance is changing under the pressure of evolving GSCs and new banking regulations.
Global supply chains – The foundation of 21st
century trade
The rapid growth of supply chains over the last 30 years reflects a variety of factors, including the establishment of the WTO, lower tariffs, the break-up of the Soviet Union and the opening of large emerging markets such as China and India.
Figure 4: EM exports have surged since 1990 Share of exports in global total (excluding intra-EU) %
Figure 5: World trade growth has slowed 1950-2013, volumes, % y/y
Source: IMF DOTS, Standard Chartered Research Source: WTO, Standard Chartered Research
EM Developed markets excl
intra-EU
20 30 40 50 60 70 80
1960 1970 1980 1990 2000 2010
Export growth
GDP growth
0 1 2 3 4 5 6 7 8 9
1950-60 1960-70 1970-80 1980-90 1990-00 2000-07 2008-12 2013
GSCs now account for nearly 80% of global trade
Slowdown in trade/GDP growth is partly attributed to GSCs
G
lob
al
sup
p
ly
chains t
o
d
ay
Figure 6: What is a global supply chain?
A global supply chain refers to the production and delivery of goods or services produced over several stages and in multiple countries. This involves ‘specialisation in tasks’ in which imports and exports of intermediate goods and services are necessary to produce a final product, which may also be exported.
Vertical and horizontal supply chains
In a vertical chain, some basic production functions such as assembly are off-shored to a low-skill, low-wage developing economy, while the more skill-based functions such as research and development are retained in a more developed, high-skill and high-wage economy. A horizontal supply chain usually involves countries at similar wage levels, where firm-specific advantages and specialisation are the attraction, rather than differences in wages. At the moment, horizontal trade is mainly seen between developed countries.
Special Report: Global supply chains: New directions
27 May 2015 11
G
lob
al
sup
p
ly
chains t
o
d
ay
Transport costs came down with containerisation while the internet made it easier to coordinate complex production processes from a distance.
GSCs have boosted growth and incomes
The benefits from expanding GSCs over the last 30 years have been immense. By opening their economies, liberalising trade and integrating into GSCs, emerging economies have raised GDP growth and per capita income without having to build the entire infrastructure needed for a globally competitive domestic manufacturing or services sector. Countries have benefited from technology transfer, technical know-how and managerial and organisational skills that have accompanied joining supply chains, especially where they received foreign direct investment (FDI) flows from advanced economies. Surging FDI played a huge role in the expansion of both GSCs as well as global trade over the last 30 years (Figures 7 and 8).
Figure 7: Stock of inward FDI for individual countries As % of country’s GDP, 2013
Note: HK (523.6%) and SG (294.2%) are excluded from the chart; Source: UNCTAD, Standard Chartered Research
0 10 20 30 40 50 60 70 80
CL GB ES VN MY NZ TH GH ZA FR AU UG CA EG BR MX US NG SA AE RU ID DE IT TR KR TW PK PH IN CN KE BD JP
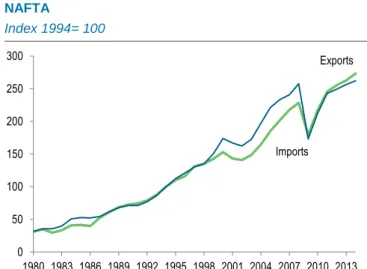
Figure 8: World trade growth has been supported by rising FDI % of world GDP
Source: UNCTAD, Standard Chartered Research
FDI stock/GDP Exports/GDP
0 5 10 15 20 25 30 35 40
1980 1982 1984 1986 1988 1990 1992 1994 1996 1998 2000 2002 2004 2006 2008 2010 2012
Trade-led development on the back of GSC integration is helping EM reduce the income gap with the West
G
lob
al
sup
p
ly
chains t
o
d
ay
This rapid growth has helped narrow the income gap between the rich north and the poor developing south of the global economy. Globalisation, urbanisation and rapid economic growth have helped to halve the number of people living in economic poverty from about 2.0bn in 1981 to 1.1bn in 2010, despite rapid global population growth.
Developed markets (DM) have benefited from access to cheap and abundant labour supply, making a cheaper and wider range of products available. Western populations have enjoyed a higher standard of living, as a result, than would have been possible in the absence of a more integrated global economy. Lower import prices also helped keep inflation down, likely extending economic upswings. On the negative side, globalisation may be partly responsible for widening income inequality within developed countries, though other factors, especially technology, are likely the main cause (Special Report, 16 July 2015, 'Taming the Gini: Inequality in perspective’).
EM and DM gains are captured in increasingly complex and geographically distributed supply chains as can be seen from the Nutella supply-chain example below (Figure 9).
Figure 9: The Nutella global supply chain
Source: OECD (2012), Standard Chartered Research
Poços de Caldas, Brazil Brazil (palm oil)
Ecuador (cocoa) USA (vanillin)
Brantford, Canada
Côte d’Ivoire, Ghana
and Nigeria (cocoa)
Lithgow, Australia Papua New Guinea (palm oil) Malaysia (palm oil)
Europe (vanillin and sugar)
Stadtallendorf, Germany
Belsk, Poland
Vladimir, Russia
Manisa, Turkey Turkey (hazelnut) Alba and Sant’Angelo
dei Lombardi, Italy
Ferrero Group
Alba, Italy
Villers-Ecalles, France
Main international suppliers Factories
Headquarters
Main sales offices
Access to cheaper and a greater variety of goods has raised DM living standards
Special Report: Global supply chains: New directions
27 May 2015 13
G
lob
al
sup
p
ly
chains t
o
d
ay
Different ways to measure participation
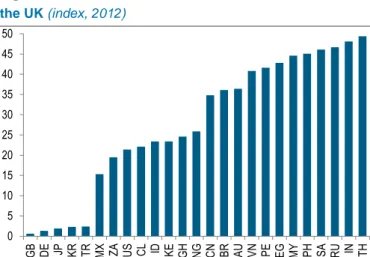
One indicator of the extent of a country’s GSC participation is degree of economic openness, defined as the ratio of exports plus imports to GDP (Figure 10). Usually when this is high, as for many Asian countries, a significant amount of the value of imports is being re-exported after processing. Another measure is the import content of exports, now estimated to be around 40% for countries overall, compared to only 20% in the 1990s according to the WTO (WTO, 2012).
But both measures are limited in assessing countries’ GSC participation. The degree of openness is naturally higher for smaller economies, while the import content of exports measures GSC participation only backwards, not distinguishing whether the country’s exports are final products or inputs to a further link in the supply chain. Figure 10: Almost every country has become more open since 1990 as supply chains expanded
Exports plus imports as % GDP, 1990 and 2012
Note: HK and SG were excluded; Source: IMF DOTS, WEO, Standard Chartered Research
Forward and backward participation
Recently available detailed data on value-added in exports and imports has made it possible to measure participation in supply chains more precisely. The GSC participation index proposed by Koopman and now calculated by the OECD (Koopman 2012 and OECD 2013) has become the standard measure. This index adds together two components – the share of foreign value-added embedded in a country’s exports (backward participation) and the share of exports made of domestic value-added, which is then used in the importing country to produce their exports (forward participation).
For example, if China imports a hard drive made in Taiwan and then, after assembly, exports a laptop to the final consumer in the US, the value-added of the hard drive in Taiwan is counted as China’s backward participation. If, instead of exporting the laptop direct to the US, the Chinese company sends it first to Korea for fitting the screen, then the value-added in China (partial assembly) is counted as forward participation (see Figure 11 for a schematic representation). Note that this definition of GSCs actually understates their role in trade statistics because domestic value-added in final assembly is not included. For example, in the first case (where China imports the hard-drive and fully assembles the laptop before exporting to the US), China’s value-added in assembly is not counted (as it is not re-exported by the US). AU
BD BR
CA CN
TW EG
DE
GH IN
ID
JP
KE
KR
MY
MX NG PK
PH
SA
ZA
TH
TR UK
US
VN
0 20 40 60 80 100 120 140 160
0 20 40 60 80 100 120 140 160 180
Tr
ad
e
op
en
ne
ss
1
99
0
Trade openness 2012 Import content of exports is
estimated at 40% for countries overall
G
lob
al
sup
p
ly
chains t
o
d
ay
Figure 11: Participation in GSCs
Schematic of forward and backward participation
Source: Koopman 2012, Standard Chartered Research
Backward participation is high in Asia, including China
Figures 12-14 show forward, backward and total participation rates for a range of countries in 2009, compared with 1995. As might be expected, backward participation is high for many Asian countries deeply integrated into the manufacturing supply chain, led by Singapore, Korea, the Philippines, Malaysia, Vietnam and Thailand (Figure 12). These import raw materials and intermediate goods and then process them for exports. Backward participation is naturally low for commodity producers such as Saudi Arabia, Russia, Brazil, Australia and Indonesia. It also tends to be low for large countries, such as the US, EU and Japan, reflecting the extended supply chains within those countries that make imports less necessary and their status as final consumers.
Although a large country, China still shows a relatively high reliance on imported raw materials and intermediates to create its exports, reflecting its key position in supply chains, including a large amount of assembly work. China, Korea and India have increased their share of foreign value-added in exports the most since 1995.
Figure 12: GSC backward participation is high in Asia Share of gross exports and change in share since 1995
Source: OECD (2013)
2009
Change since 1995 -20
-10 0 10 20 30 40 50
SG KR PH MY VN TH CN MX HK DE FR IN TR ES IT CA NZ GB ZA JP ID AU EU US BR RU SA
Backward
Forward
Foreign value-added Domestic value-added
Gross exports
Exports absorbed by direct importer AND any foreign value-added passed
through from other countries
Domestic value-added included in exports which is processed again and
exported to other countries
China, Korea and India have increased their backward participation most since 1995
Special Report: Global supply chains: New directions
27 May 2015 15
G
lob
al
sup
p
ly
chains t
o
d
ay
Commodity producers and DM lead on forward participation
Commodity exporters such as Russia, Saudi Arabia, Australia and Indonesia show a high forward participation (Figure 13), as do Japan, the US, Hong Kong, the UK, Korea and Germany, reflecting their key roles in supplying sophisticated components into supply chains. Mexico and China are less inclined to show forward participation, reflecting their central role in assembling and exporting final products. As noted above, this could also be considered part of overall supply-chain activity, and is what leads to the figure of 80% for the overall share of supply-chain trade. Again, most countries have increased their forward participation, with Hong Kong, Malaysia and the Philippines showing the biggest gains.
Figure 13: GSC forward participation is high in commodity exporters and advanced countries Share of gross exports and change in share since 1995
Source: OECD (2013)
Smaller Asian countries lead the overall index
Bringing the two GSC components together creates the overall index (Figure 14). Singapore, Philippines, Malaysia and Korea hold the top four positions. Approximately two-thirds of their exports are part of GSCs on this definition. Hong Kong has slipped to 5th place. The lower end of the distribution features large countries and countries with a mix of commodity and manufacturing exports such as Canada and Brazil. Since 1995 almost all the countries in our data set have increased their participation, with the Philippines, Korea, India and Turkey up the most since 1995. South Africa is the only one of these countries for which participation has fallen, mostly due to decreased forward participation.
2009
Change since 1995 -20
-10 0 10 20 30 40 50
RU SA JP AU ID US PH MY HK BR GB KR DE IT FR ES SG IN TH EU ZA TR NZ CA VN CN MX
Figure 14: Asian countries lead in total GSC participation % of gross exports
The index is calculated as a percentage of gross exports and has two components: the import content of exports and the exports of intermediate inputs (goods and services) used in third countries’ exports; Source: OECD (2013)
2009 backward 2009 forward
Total participation in 1995
0 10 20 30 40 50 60 70 80
SG PH MY KR HK TH RU VN DE JP SA CN FR AU ID GB IN MX IT US TR BR CA NZ ZA EU
Philippines, Korea, India and Turkey have increased their participation rate the most since 1995 Hong Kong, Malaysia and the Philippines show the biggest gains on forward participation
G
lob
al
sup
p
ly
chains t
o
d
ay
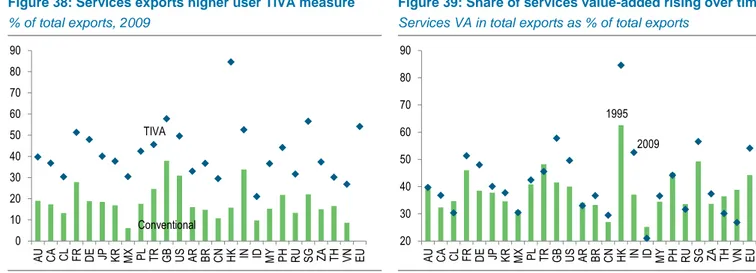
The value-added data also allows us to break the total index into services, manufacturing and primary products for each country (Figure 15). Developed countries are most involved in providing services to GSCs with Hong Kong showing the highest proportion of its exports. A few count ries such as Malaysia and Canada are quite diversified, involved in primary products, manufacturing and services. Many others primarily undertake manufacturing tasks, including Korea, Japan and the Philippines.
Figure 15: Hong Kong, Singapore and the UK lead services GSC participation % of gross exports, 2009
Note: Utilities are included with agriculture and mining in the primary sector; Source: OECD-WTO TiVA Database
China, Germany, the US and Korea have the largest participation in GSCs in absolute terms (Figure 16). The absolute size of China’s global supply chain is USD 1.07tn, compared to the US at USD 646bn and India at USD 134bn.
0 10 20 30 40 50 60 70 80
HK SG GB ES IN PH US KR FR MY EU DE TR AU TH NZ IT JP RU CA BR ZA VN CN ID MX SA
Figure 16: China is the largest GSC player
Value of GSC participation USD bn, latest available data
Source: IMF DOTS, OECD (2013)
0 200 400 600 800 1,000 1,200
Special Report: Global supply chains: New directions
27 May 2015 17
G
lob
al
sup
p
ly
chains t
o
d
ay
In relation to their own GDP, Hong Kong and Singapore are the most dependent on GSCs, reflecting their role as business service centres. The value of their participation is more than 80% of GDP. Other Asian countries are also heavily involved, including Malaysia, Thailand, Vietnam and Korea (Figure 17). The data can also be broken down by industry. We present data for selected industries and countries in the Appendix.
Figure 17: Asian countries are heavily dependent on GSCs GSC value as % of GDP
Source: IMF DOTS, OECD (2013), Standard Chartered Research
Integration into GSCs
While we usually talk of global chains, many supply chains are primarily regional (Baldwin, 2012). There are three main ‘headquarter’ economies in manufacturing: the US, Japan and Germany. Japan’s firms work mainly with Asian firms, Germany’s mainly with European firms, including Eastern European countries for lower-wage tasks, while US companies work particularly with Mexico and Canada. Still, there are often global elements for specific parts. US and European chains often make use of suppliers and assembly services in Asia, especially China. At the end of the chain consumers used to be mainly in the US and Europe, but this is changing rapidly as Asian middle classes grow in importance.
Other developed countries in Europe, including the UK, France and Italy, also headquarter supply chains; Korea is increasingly doing so too. As China’s wages continue to rise, companies there may increasingly outsource tasks to lower-wage countries and China may become a headquarters economy. Particularly when inland wages converge to coastal wage levels, China’s companies will face a choice between automating or finding low-cost options offshore (see below).
Supply-chain growth has radically changed production and trade in East Asia. But many less-developed countries, including most Sub-Saharan African (SSA) countries and some countries in central Asia and Latin America, are still struggling with initial GSC integration.
0 10 20 30 40 50 60 70 80 90 100
SG HK MY VN TH KR SA DE PH RU MX CN IT CA FR ID ZA TR AU NZ JP GB IN US BR
Many less-developed countries are struggling with GSC participation
G
lob
al
sup
p
ly
chains t
o
d
ay
Five obstacles to GSC integration
1. Distance. Countries in SSA, for example, are relatively large distances from any of the three ‘factory’ regions in Europe, Asia and North America, as well as a long distance from consumers in those regions.
2. ‘Dutch disease’. High revenues from commodity exports lift the exchange rate, often making wages high for a given skill level compared to a country with fewer natural resources. This makes it more difficult to join GSCs other than as raw-material exporters, though not impossible as the examples of Australia, Canada and Malaysia demonstrate.
3. Specific trade and investment barriers such as local content requirements or limitations on foreign labour. Political resistance, to protect domestic interests, may make these difficult to change.
4. High transport and logistics costs. See below. 5. A poor business environment. See below.
High transport and logistics costs
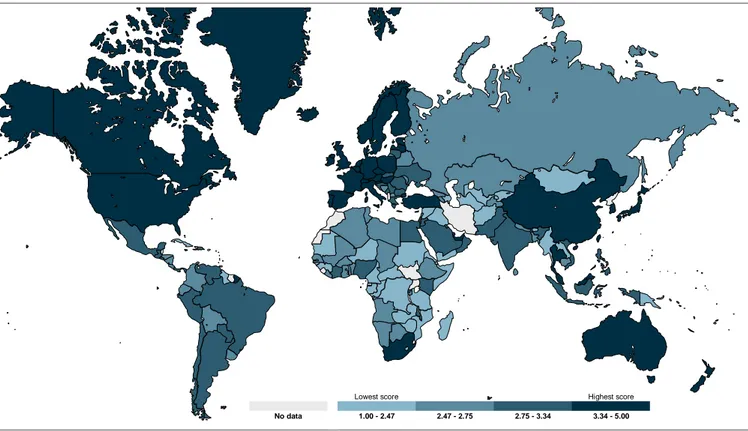
Poor infrastructure development is one of the most important obstacles in many countries, particularly low-income countries. But weak logistics more broadly, including government bureaucracy and delays in customs are also problems. One study found that every extra day needed to ready goods for export and import could reduce trade flows by up to 4% (OECD 2014).
Figure 18: Logistics performance index
Source: World Bank LPI, Standard Chartered Research
Lowest score Highest score
Special Report: Global supply chains: New directions
27 May 2015 19
G
lob
al
sup
p
ly
chains t
o
d
ay
The World Bank’s Logistics Performance Index (LPI) measures the on-the-ground efficiency of trade supply chains or logistics performance across six components – customs, infrastructure (roads, ports and airports), international shipment, logistics quality and competence, tracking and tracing, and timeliness. The LPI covers 160 countries using surveys of logistics professionals. Mostly high-income countries form the top quarter of the rankings, with Germany 1st, the UK 4th, Singapore 5th and the US and Japan taking 9th and 10th place, respectively. The ‘logistics gap’ between high- and low-income countries remains wide.
China and Thailand score relatively well on this measure, ranking 28th and 35th respectively, on par with the Czech Republic and above Israel, both much higher-income economies. Several countries in Africa also place much better than might be expected based on their per-capita income, including Nigeria and Kenya.
Conducive business environment is crucial for GSC participation
Participation in global value chains is more likely as the basic business environment improves. Many elements matter, including a stable macroeconomic environment, a flexible labour market, and good governance – especially the rule of law. One simple indicator is the World Bank’s ‘ease of doing business’ measure. Newly industrialised Asian economies and developed economies do best on this measure (Figure 19). But over the last five years, the China, India, Brazil, Russia Nigeria, Ghana, Mexico the Philippines, Malaysia, Vietnam and Taiwan have made the most progress in improving performance.
A key issue for many firms is lack of protection for intellectual property (IP) rights. This problem is widely cited in China and may be a barrier to growth, especially as China tries to climb up the value chain. IP is a central element in the proposed TPP and TTIP pacts as well as recent bilateral pacts.
International agencies as well as many governments are prioritising improvements to the business environment, recognising the value of attracting international business and enabling local companies to participate in GSCs. While sometimes governments back-track in the face of political pressures, we expect the trend to continue towards greater liberalisation.
Figure 19: Developed countries and Asian markets have the best business environments Ease of doing business – A score of 100 represents best practice on all counts, 2015
Source: World Bank Doing Business 2015, Standard Chartered Research
40 45 50 55 60 65 70 75 80 85 90
SG NZ HK KR US GB AU DE CA MY TW AE TH JP FR ES MX ZA SA TR IT RU GH VN CN PH EG ID BR PK KE IN UG NG BD
The ‘logistics gap’ between high-and low-income countries
remains wide
The business environment is improving: intellectual property has become a key issue
G
lob
al
sup
p
ly
chains t
o
d
ay
Despite the difficulties for low-income countries struggling to overcome these five barriers, there have been success stories. Some low-income countries such as Kenya and Tanzania have sufficiently improved their institutions and capabilities to reach GSC integration. Bangladesh is becoming a major player. And low-income countries in ASEAN, including Vietnam, Laos and Cambodia, are increasingly joining GSCs, helped by the development of the ASEAN Economic Community.
Climbing up the smile curve to higher incomes
The ‘smile curve’ illustrates the value-added at each stage of production (Figure 20). Headquarters companies and countries tend to focus on upstream tasks such as R&D and design, together with downstream tasks such as marketing and distribution, leaving component manufacturing and final assembly to lower-wage countries. The tasks in the headquarters economy tend to require more expensive skills and therefore achieve higher wages and higher value-added.
The smile curve has likely deepened since the 1970s, reflecting the increased ‘commoditisation’ of manufacturing, driven by the rise of China, competition between low-cost locations and increased automation. Getting established in GSCs at the trough of the smile can lift countries rapidly out of low-income status, as China has most recently demonstrated. But moving briskly through the middle-income stage and, especially to the high-income stage requires a move away from simple manufacturing towards more sophisticated products and manufacturing processes as well as moving up one or both sides of the smile curve towards more services-oriented tasks such as R&D, design and marketing.
Figure 20: Smile curve – Value added is higher at both ends of supply chains
Indicative value added
Source: WTO, Standard Chartered Research
R&D, design and marketing are not absent in low- and middle-income countries. But as countries develop through the middle-income stage, more people are involved in these tasks and fewer in less-skilled factory work. This transition requires better education and the acquisition of skills and experience, which take time. These skills can also be imported, both through immigration, as most extensively seen in the development strategy of Dubai and Singapore, or through services imports, made much easier with internet communications. They can also sometimes be copied, a practice observed in all the countries that developed after Britain, from the US, Germany and Japan in the late 19th century to China today.
Present day 1970s
0 1 2 3 4
R&D, design Manufacturing,
assembly distribution, after-Marketing, sales services Value
‘Smile curve’ has likely deepened since the 1970s Low-income countries in ASEAN are increasingly joining GSCs
Special Report: Global supply chains: New directions
27 May 2015 21
G
lob
al
sup
p
ly
chains t
o
d
ay
Figure 21: Value chains versus supply chains
While business literature usually discusses supply chains, academic literature often refers to value chains. In practice both types of chain link the same network of companies and consumers but emphasise a different perspective. The supply chain describes the flow of goods and services from upstream suppliers through downstream assembly to the final product for customers. The focus is on better integration of production stages, reducing costs and waste and improving supply efficiency. The value-chain concept is based on value-added at each stage, whether R&D, parts manufacture, assembly, marketing or distribution. In a sense it looks back up the chain to see which tasks are being done where, and how value is being created (Feller, 2006). In this publication we use the term supply chain.
Comparing supply chains and value chains Schematic
Source: Feller (2006), Standard Chartered Research
Horizontal supply chains are gaining importance in EM
Wage convergence tends to change the nature of trade between converging countries rather than trade itself, according to Baldwin (2012). So, instead of vertical supply chains, where developing economies produce only low value-added goods, trade might shift to horizontal supply-chain integration, where economies trade parts and components of similar products with each other to give buyers more variety and efficiency. This shift can also be seen at final product level when countries at comparable levels of development trade similar final consumption goods.
Horizontal trade is not a new phenomenon. They have been around for several decades now among developed markets. The most famous example is the exports of parts and components of automobile exports between the US and Canada or within Europe. As new trade agreements bring down trade barriers, we expect more horizontal supply chains to appear in emerging markets, reflecting mutual trade gains from greater economic specialisation and efficiency.
Product Value chain Customer requirements
Product requirements Supply chain Customer
Strategic components
Global assembly
Finished products
Successful customer
Nature of trade is shifting towards horizontal supply-chain integration
G
lob
al
sup
p
ly
chains t
o
d
ay
Drawbacks of GSC participation
GSC participation can bring participants significant benefits, but also drawbacks (WTO 2014):
1. Vulnerability to global business cycles. Participation in GSCs can increase a country’s vulnerability to global business cycles. With manufacturing increasingly located in emerging countries, these countries are often hardest hit in a global downturn, as orders and inventories are slashed, as in 2008-09.
2. Relocation risks. Even a small increase in production or transaction costs in a country can lead firms to re-locate to an alternative low-wage country or ‘re-shore’ part of the production to the home country.
3. Higher income inequality. When producers in developed countries send lower-skill tasks offshore, the wage gap between lower- and higher-lower-skilled workers may widen. In the recipient country people taking the new jobs may enjoy much higher pay than many people in the agricultural or informal sectors. In both countries, therefore, off-shoring may worsen the distribution of income even though both countries see overall income gains.
4. ‘Narrow learning’. When the skills involved in the tasks performed in GSCs cannot easily be transferred to other activities or used to upgrade within the same value chain, an economy may become dependent on a few tasks, potentially limiting both economic growth and the opportunity for upgrading. While these drawbacks cannot be denied, they often can be mitigated or overcome. The evidence suggests that GSC expansion has brought large gains to all participating economies and most people. Not surprisingly the one policy recommendation emphasised almost everywhere is improved education and training to prepare the work force for higher-skilled tasks and to retrain people displaced.
Conclusion – Maximising GSC participation
GSC expansion is ultimately driven by firms’ choices. Increasingly, over the last few decades, the route for large companies to stay competitive has been outsourcing simple tasks (both manufacturing and services) to low-wage countries (vertical supply chains) or sourcing the best component or service from centre-of-excellence firms, sometimes rival companies (horizontal supply chains). Cuts in tariffs and reductions in other protectionist measures from the 1960s onwards increasingly left firms with little choice but to follow this route or lose profits and markets.
For emerging countries, participation in vertical supply chains has opened up a new route to economic development. Instead of developing their own broad supply industries, they can plug into the chain. It is only necessary to reach certain threshold levels of quality and efficiency on limited tasks to become attractive off -shoring destinations. But a level of global competitiveness in the activity they perform is required.
Despite some drawbacks, GSCs overall have brought large gains to participating economies Off-shoring lower-skill tasks may widen the distribution of income
Dri
ve
rs of
chan
g
e fo
r G
S
Cs
Developments in eight areas will shape trends
The future of GSCs will broadly be shaped by developments in eight areas: 1. Increasing incomes and growing EM labour forces
2. Better communications technologies 3. New automation technologies 4. New trade pacts
5. Geopolitical tensions 6. The costs of trade 7. Sustainability issues 8. Relative wage costs
1. Increasing incomes and growing EM labour forces
We think the world will see positive economic growth in the next 15 years and that emerging countries will grow faster than developed countries. Even today, with several large emerging countries such as Brazil and Russia struggling, overall EM growth is running at around twice that of developed countries. At market exchange rates, EM accounted for about 20% of the world economy in 1990, 40% in 2010 and are on course to reach 60% around 2030, including 39% in Asia excluding Japan.
Figure 22: Forces driving global supply chains Positive and negative
More and longer GSCs Fewer and shorter GSCs
Continuing growth and rising urbanisation
Better communications – cheaper broadband, video-conferencing, virtual reality, IoT, etc
New trade pacts
Lower oil prices
New efficient low-wage countries to replace China
More service supply chains
More horizontal GSCs in EMs
Automation - robotics
3D printing - customisation
Geopolitical tensions
Higher oil prices
Sustainability concerns become prominent
Source: Standard Chartered Research
Populations will grow fastest in south Asia and Africa, bringing another billion people into working age over the next 40 years. While many will likely be low-skilled, most emerging countries are making significant progress in education (Special Report, 18 September 2013 ‘Measuring sustainable development’). For trade patterns the urban population trend is probably more important, since EM rural populations often participate very little in GSCs, at least on the import side. Sub-Saharan Africa, China, India and other countries in Asia will account for most new urban citizens over the next 15 years (Figure 23). By 2050, the urban population is expected to nearly double to an estimated 6.4 billion (UN, 2008).
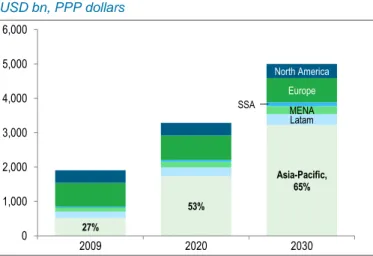
The global middle class is expected to triple to 1.2bn in 2030 from 400mn in 2000 according to World Bank forecasts (Figure 24). A growing middle class should increase demand for consumer durables and for services including tourism, education and financial services. The OECD estimates that the combined purchasing Combined purchasing power of the
global middle classes is expected to more than double by 2030 EM growth is running at around twice the DM growth rate
Special Report: Global supply chains: New directions
27 May 2015 25
Dri
ve
rs of
chan
g
e fo
r G
S
Cs
power of the global middle classes will more than double by 2030 to USD 56tn, with more than 80% of this demand coming from Asia.
A growing number of major global companies are likely to be headquartered in emerging markets. By 2025, according to McKinsey, EM companies will likely comprise more than 45% of the world’s 500 largest companies (McKinsey Global Institute, 2013). The extent to which they expand supply chains internationally, or whether they prefer to produce mainly at home, will be important. We expect that commercial considerations will increasingly encourage them to go global, as we are already seeing in many cases.
These trends underline that while DM governments may continue to play a large role in trade policy and DM firms’ and consumers’ choices will probably still matter, the choices of EM governments, firms and consumers, particularly China and India, will be increasingly important.
Figure 23: Most new urbanites will be in Asia and Africa Rise in urban population 2010-30, %
Figure 24: Asian middle classes will dominate spending USD bn, PPP dollars
Source: UN, Standard Chartered Research Source: OECD, Standard Chartered Research
2. Better communications technologies
Digital technologies will likely affect supply chains in two opposing ways, depending on whether they improve communications or increase automation. Technologies that improve communications, including improved broadband speed and reliability, the spread of smartphones, video and virtual-reality conferencing, computer translation or the internet of things (IoT), make it easier to successfully operate longer and more complex supply chains. Those working in the supply chain will be able to communicate and collaborate with each other better than ever before. Video-conferencing allows people to feel they are in the same room, while virtual reality makes people feel they can move around in the room.
Meanwhile, the falling cost of RFID (radio-frequency identification) technology, as well as other developments in the IoT space, make it cheap and easy to track and monitor components as they move through the supply chain. Supplier companies can be completely integrated in managing the supply chain. Instead of an ordering department sending orders to suppliers, everybody can be linked directly to inventory management systems. Many firms are doing this already, but systems will likely improve and costs fall so that it becomes a standard part of manufacturing for most companies.
21% 19% 19% 16% 9%
8% 4% 2% 2% 1% 0% SS Africa
China Asia ex-CIJ India MENA Latam US ROW EU-27 CIS
Japan 27%
53%
Asia-Pacific, 65%
Latam MENA SSA
Europe North America
0 1,000 2,000 3,000 4,000 5,000 6,000
Special Report: Global supply chains: New directions
Dri
ve
rs of
chan
g
e fo
r G
S
Cs
Another digital technology that could support the expansion of GSCs is big data, (though not exactly a communications technology). Big data allows the huge amount of data generated from sales, inventory and IoT machines to be understood and managed in real time (often automated), again making it easier to coordinate GSCs, finding production efficiencies and anticipating consumer needs across countries. The rise of GSCs in the last 10-20 years has benefitted from the basic internet, but fast broadband and smartphone adoption is relatively new, particularly in EM (Figure 25). We believe that these new communications technologies will advance by leaps and bounds in the next few years, not just in technical capacity but in how widespread they become (Special Report, 19 January 2015, ‘Technology: Reshaping the global economy’). This should support the further growth of manufacturing supply chains and help with expanding services supply chains into new areas. However, digital technology is also bringing rapid advances in automation, particularly robotics but also 3D printing, which could have the opposite effect on supply chains.
3. New automation technologies
Robotics could reduce the advantages of producing in low-labour-cost developing countries, potentially unravelling GSCs that have benefitted many emerging markets. Much will depend on costs. Robots are being developed for the assembly line that can be trained simply by moving their arms, ‘showing’ them what to do, or even with verbal instructions, rather than requiring complex and detailed reprogramming every time a task changes. At first they will likely mainly be used for repetitive, unpleasant or awkward tasks, but their capability could grow. Already available for less than USD 20,000, their costs will likely fall and they could work three shifts a day if necessary. Wages in low-income countries are often still less than USD 2000 annually, so robots are still expensive now relative to their capabilities. Robots struggle with tasks requiring dexterity or where the process is not totally standardised. But in 10-20 years they could transform manufacturing. Firms in middle-income countries such as China are already experimenting with robots to replace people. The challenge for low-income countries wanting to join GSCs will be to find tasks that cannot be done more cheaply by machines. This is not to say that such tasks cannot be found. Production of small batches, or requiring more flexibility or greater pattern recognition Figure 25: Fixed broadband Internet subscriptions have risen over the last decade
Per 100 population, 2014 vs. 2008
Source: WEF GCI
0 5 10 15 20 25 30 35 40
FR KR GB DE CA SE HK JP US SG AU TW RU CN TR MX AE BR MY TH SA VN EG ZA PH ID IN BD PK GH KE UG NG 2014
2008
New communications technologies such as broadband and smartphones could help GSCs expand further
Special Report: Global supply chains: New directions
27 May 2015 27
Dri
ve
rs of
chan
g
e fo
r G
S
Cs
will be done better by people for a long time yet. But at least some of the factory tasks done by Korea in the 1980s and China in the 2000s will probably be done by robots in the 2020s.
3D printing could lead to customised products
3D printing could change GSCs by taking customisation of products to the mass market. In developed countries some people often pay substantially extra for unusual or unique items (designer goods, craft products or small-batch items) while less well-off people rely more on mass-produced items. But if 3D printing brings the prices of customised items closer to standardised items, customisation could go to the mass market. Everybody may want unique items, either to their own design or from a selected design blueprint or with their own name. A GSC could still be involved; for example, the consumer could be in the US, the designer in India, the materials from Africa and the 3D printer manufactured in Korea. But, with the actual manufacturing all in one location, near the consumer, they would likely be shorter than typical supply chains based on mass production.
4. New trade pacts
Anti-globalisation forces are present in most countries, resisting trade agreements or trying to limit their application with restrictions such as government procurement rules or product standards. Backing for this resistance comes from trade unions trying to protect jobs, companies trying to limit competition and environmental or other interest groups trying to maintain environmental or labour-market standards. Sometimes governments seek to restrict GSCs for strategic reasons related to particular industries or what they perceive as the country’s interest.
The growth of ‘big box’ retailers in North America and increasingly in Europe was a driving factor for GSCs in manufacturing over the last 20 years. Firms such as Walmart sought the cheapest products possible and could buy on a huge scale, helping to shape supply chains. In some countries, for example India and Thailand, there is considerable political resistance to both foreign retailers and large retailers as they may entail the demise of small shops and smaller local chains. To the extent that emerging countries move more towards large shops and global retailers, rather than a myriad of small shops, GSCs may grow more.
Governments can embrace GSCs by encouraging foreign companies to enter and supporting domestic companies in participating, or they may instead emphasise creating local champions and developing domestic suppliers. Large countries are more likely to follow the latter course, and in some cases this may make sense. But promoting local production that involves distortions or subsidies may not help economic growth and could slow the GSC expansion.
Baldwin, one of the leading academic experts on supply chains, argues that GSCs have changed the reason for co-operation on trade issues (Baldwin, 2012). In the past, trade negotiation took place to prevent countries from free-riding on other countries’ liberalisation efforts, but with GSCs, where imports and exports are equally important, it is in a country’s best interest to co-operate on all fronts, bringing down import barriers. Such agreements also help small countries and less-developed economies (LDCs) to integrate into the global economy.
3D printing could lead to customised products for the mass market
GSCs encourage cooperation by countries on all fronts
Dri
ve
rs of
chan
g
e fo
r G
S
Cs
Hopes for new trade agreements
The 2008-09 global financial crisis led to an increase in protectionism but less than feared, and the number of new measures seems to be slowing. Meanwhile, there have been numerous bilateral Preferential Trade Agreements (PTAs) over the last 10 years or so, whose effect in many cases is still working through. According to the World Trade Organisation (WTO), the number of PTAs and Bilateral Investment Treaties (BITs) more than tripled between 1990 and 2010. Approximately 300 PTAs are currently in operation and many more under negotiation (World Trade Report, 2013).
The Bali package, which aims to reduce red tape and simplify customs procedures, promises to be the first global trade agreement since 1995. More than 160 members of the WTO could benefit from this package, which covers four broad issues – trade facilitation, agriculture, cotton trade and less-developed country issues. Package implementation was delayed following a few hiccups, especially disagreement between the US and India on India’s food-subsidy programme. In late November 2014, however, an agreement between the two countries has allowed for a renewed push towards implementation.
The Trade Facilitation Agreement (TFA), the first part of the Bali package, needs to be ratified by two-thirds of the 160 countries to come into force and could be adopted by end-2015, with 56 countries already having informed the WTO about which parts of the TFA they will immediately implement once the agreement comes into force. The WTO calculates the benefit of reducing trade costs by 10-15% under the Bali package to be between USD 400bn and USD 1tn.
Meanwhile, the Transatlantic Trade and Investment Partnership (TTIP) and, in particular, the Trans-Pacific Partnership (TPP) are gaining traction. The TTIP is an agreement between the US and European Union countries (Figure 26). The TPP is an agreement between twelve countries: the US, Canada, Japan, Australia, New Zealand, Chile, Peru, Mexico, Brunei, Malaysia, Singapore and Vietnam.
US President Obama is trying to fast-track these deals (especially TPP) in 2015 and they are backed by the Republicans, who control Congress. While the President faces some resistance from within his own party, Republican support is expected to ensure that the President gets the powers to act quickly on the bill ahead of the US presidential elections next year
Trade agreements more than tripled between 1990 and 2010
Benefits of reducing trade costs under the Bali package could touch USD 1tn
2
7
M
a
y
2
0
1
5
29
S
pec
ia
l
Report:
G
lob
a
l
s
uppl
y
c
ha
ins
: Ne
w
dire
c
tion
s
Figure 26: New multi-party trade agreements under negotiation include the TPP, TTIP and RCEP
Source: Standard Chartered Research
Trans-Pacific partnership
(TPP)
Transatlantic Trade and
Investment Partnership
(TTIP)
Regional Comprehensive
Economic Partnership
(RCEP)
Chile
USA
Canada
Australia
Japan
Brunei
Malaysia
Mexico
New Zealand
Peru
Singapore
Vietnam
China
India
South Korea
Myanmar
Indonesia
Laos
Thailand
EU
Cambodia
Philippines
Dri
ve
rs of
chan
g
e fo
r G
S
Cs
Further, the Japanese government, keen to implement its third arrow of structural reforms, has indicated willingness to relax tariffs on agricultural products. The Regional Comprehensive Economic Partnership (RCEP) agreement, between ASEAN economies and six others including India and China, may also be finalised in 2015, confirming China’s interest in liberalising trade.
The focus now is on ‘deep’ agreements
With industrial tariffs mostly relatively low now, the focus is on so-called ‘deep agreements’, much of which is about facilitating supply-chain growth. These regulatory provisions address ‘behind-the-border’ issues such as institutional quality, transparency, investment, intellectual property rights and contract enforcement, which underpin GSC trade. Trade and foreign investment rules are increasingly linked.
5. Geopolitical tensions
Geopolitical tensions could slow the expansion of supply chains if firms fear conflict, consumer actions or sanctions. Tensions in the Asia-Pacific area are a particular concern. Current concerns in Eastern Europe or the Middle East are of less importance for supply chains. But it also seems likely that the current push for trade agreements such as the TPP, TTIP and China’s RCEP are partly driven by strategic considerations. Countries are looking to consolidate and develop trade relations as part of creating closer ties as well as helping partners develop.
Figure 27: Industrial tariffs mostly relatively low now
Tariff rate applied, weighted mean, all products (%)
Source: World Bank
6. The costs of trade
The cost of moving goods around depends on logistical efficiency, including infrastructure. With the possible exception of China, emerging markets (and some developed countries) have infrastructure bottlenecks that raise the cost of extended supply chains. Many emerging markets are now focused on boosting infrastructure investment, which should help to extend GSCs, though congestion will likely remain as economies grow. Both the Panama and Suez Canals are undergoing expansions expected to be completed within the next couple of years, roughly doubling capacity and allowing larger ships through. This will likely lower costs and speed up delivery for some routes.
0 5 10 15 20 25 30 35 40 45
1996 1998 2000 2002 2004 2006 2008 2010 2012
Geopolitical tensions such as in the Middle East could slow GSC expansion
Panama and Suez Canal widening schemes could lower costs