Getting Started Building and Running a Process
Model
Version Number: V8.4
November 2013
Copyright (c) 1981-2013 by Aspen Technology, Inc. All rights reserved.
Aspen Plus, aspenONE, the aspen leaf logo and Plantelligence and Enterprise Optimization are trademarks or registered trademarks of Aspen Technology, Inc., Burlington, MA.
All other brand and product names are trademarks or registered trademarks of their respective companies. This software includes NIST Standard Reference Database 103b: NIST Thermodata Engine Version 7.1 This document is intended as a guide to using AspenTech's software. This documentation contains AspenTech proprietary and confidential information and may not be disclosed, used, or copied without the prior consent of AspenTech or as set forth in the applicable license agreement. Users are solely responsible for the proper use of the software and the application of the results obtained.
Although AspenTech has tested the software and reviewed the documentation, the sole warranty for the software may be found in the applicable license agreement between AspenTech and the user. ASPENTECH MAKES NO WARRANTY OR REPRESENTATION, EITHER EXPRESSED OR IMPLIED, WITH RESPECT TO THIS DOCUMENTATION, ITS QUALITY, PERFORMANCE, MERCHANTABILITY, OR FITNESS FOR A PARTICULAR PURPOSE.
Aspen Technology, Inc. 200 Wheeler Road Burlington, MA 01803-5501 USA Phone: (1) (781) 221-6400 Toll Free: (1) (888) 996-7100 URL: http://www.aspentech.com
Contents
Who Should Read this Guide ...1
Introducing Aspen Plus ...3
Why Use Process Simulation? ...3
What is an Aspen Plus Process Simulation Model?...3
Sessions in this Book ...4
Using Backup Files ...5
Related Documentation...5
Technical Support ...5
1 Aspen Plus Basics...7
Starting Aspen Plus...7
The Start Using Aspen Plus Window...7
Opening a File...7
To Display the File Menu ...8
The Aspen Plus Main Window ...9
Selecting Flowsheet Objects ... 11
Using a Shortcut Menu... 11
To Display the Shortcut Menu for Stream 1 ... 11
Opening Input Sheets ... 12
To Open the Input Sheets for Stream 1... 12
Using Help... 13
To Get Help on any Topic ... 14
Entering Data on a Sheet ... 15
Expert Guidance – the Next Function ... 16
To Use the Next Function to Display the Next Required Form ... 16
Running the Simulation... 18
To Run the Simulation ... 18
Examining Stream and Block Results ... 19
To Display the Flash Overhead Vapor (Stream 2) Results ... 19
Modifying and Rerunning Your Model ... 20
Saving Your File and Exiting Aspen Plus ... 21
To Change the Save Options... 21
To Save and Exit ... 22
2 Building and Running a Process Simulation Model ...23
Building the Process Model ... 23
Defining the Simulation: Methylcyclohexane Recovery Column... 23
Starting Aspen Plus ... 24
Creating a New Simulation ... 24
To Specify the Template for the New Run ... 25
Defining the Required Properties ... 25
Selecting Thermodynamic Methods... 28
Defining the Flowsheet... 29
To Open the Model Palette... 29
To Select a Unit Operation Block ... 29
To Choose a RadFrac Icon and Place a Block... 30
To Connect Streams to the Block... 31
Adding Data to the Process Model ... 32
Specifying a Title for the Simulation ... 33
Specifying Data to be Reported ... 33
Entering Stream Data ... 35
Entering Unit Operation Block Data... 36
Running the Simulation... 39
Examining Simulation Results ... 40
To Display the Results for Block B1... 40
Examining Stream Results... 42
To Display the Results for Stream 3... 42
To Display the Results for All Streams on the Same Sheet... 43
Changing Input Specifications... 43
To Increase the Phenol Solvent Stream Flow Rate ... 44
Rerunning the Simulation with Changed Input ... 44
Creating Reports ... 44
To Generate a Report File... 44
To View and Save Part of a Report ... 46
Saving Your File and Exiting Aspen Plus ... 46
3 Performing a Sensitivity Analysis ...47
Starting Aspen Plus ... 47
Opening an Existing Simulation... 48
If Your Saved File MCH.apw is Displayed ... 48
If Your Saved File MCH.apw is not Displayed ... 48
Saving a Simulation under a New Name... 48
Defining the Sensitivity Analysis... 49
Entering Sensitivity Specifications ... 49
To Create a New Sensitivity Block ... 49
To Specify the Manipulated Variable ... 49
To Define XMCH as Distillate Product Purity ... 51
To Define QCOND as the Condenser Duty and QREB as Reboiler Duty... 51
To Format the Tabular Results ... 53
Running the Sensitivity Analysis... 54
Displaying Sensitivity Analysis Results ... 55
Plotting Sensitivity Results ... 55
To Generate a Plot of MCH Distillate Purity Versus Phenol Flow Rate ... 56
Saving Your File and Exiting Aspen Plus ... 56
4 Meeting Process Design Specifications...57
Starting Aspen Plus ... 57
Opening an Existing Simulation... 57
If Your Saved MCHSENS.apw is Displayed ... 57
If Your Saved File MCHSENS.apw is Not Displayed... 58
Saving a Simulation Under a New Name... 58
To Define XMCH in DS-1 ... 59
To Set Up the Design Specification ... 59
To Specify the Manipulated Variable ... 60
To Hide Sensitivity S-1... 61
Running the Design Specification Analysis ... 61
Examining Design Specification Results... 62
Exiting Aspen Plus ... 62
5 Annotating Process Flowsheets...63
Starting Aspen Plus ... 63
Opening an Existing Simulation... 63
If Your Saved File MCH.apw is Displayed ... 63
If Your Saved File MCH.apw is not Displayed ... 64
The Process Flowsheet ... 64
Displaying Stream Data ... 64
To Display Temperature and Pressure ... 64
Adding a Stream Table... 66
To Zoom in on Part of the Diagram... 66
Adding Text ... 67
To Add Text... 67
Adding a Molecular Structure Symbol... 67
To Copy the Molecule Symbol of MCH From the Molecule Editor ... 68
To Paste the Molecular Structure of MCH to the Process Flowsheet ... 68
Printing a Process Flow Diagram ... 68
To Print the Process Flowsheet... 68
Exiting Aspen Plus ... 69
6 Estimating Physical Properties for a Non-Databank Component...71
Thiazole Physical Property Data... 71
Starting Aspen Plus ... 72
Creating a Property Estimation Simulation... 72
Specifying Properties to Estimate ... 73
Entering a Title ... 73
Entering Components Information ... 74
Entering Molecular Structure... 74
To Enter the Molecular Structure Information for Thiazole ... 74
Entering Property Data ... 75
To Enter Pure Component Boiling Point and Molecular Weight for Thiazole... 76
To Enter Antoine Vapor Pressure Correlation Coefficients ... 76
Running a Property Constant Estimation (PCES)... 78
Examining Property Constant Estimation Results ... 78
To Examine PCES Results ... 78
Creating and Using a Property Backup File... 80
To Save a Backup File... 80
To Import a Backup File ... 81
Exiting Aspen Plus ... 81
7 Analyzing Properties ...83
Starting Aspen Plus ... 83
Entering Components and Properties ... 83
To Generate a Txy Diagram ... 87 To Generate an Activity Coefficient Plot... 88 Exiting Aspen Plus ... 89
Who Should Read this Guide
This guide is suitable for beginners to the Aspen Plus simulation environment. Users should understand the material in this guide before proceeding to the other Aspen Plus Getting Started Guides.
Introducing Aspen Plus
Aspen Plus makes it easy to build and run a process simulation model by providing you with a comprehensive system of online prompts, hypertext help, and expert system guidance at every step. In many cases, you will be able to develop an Aspen Plus process simulation model without referring to printed manuals.
The seven hands-on sessions show you, step-by-step, how to use the full power and scope of Aspen Plus. Each session requires 30 – 50 minutes. This guide assumes only that you have an installed copy of Aspen Plus. If you have not installed Aspen Plus, please see the Aspen Engineering Suite
Installation Manual.
Why Use Process Simulation?
Process simulation allows you to predict the behavior of a process by using basic engineering relationships, such as mass and energy balances, and phase and chemical equilibrium. Given reliable thermodynamic data, realistic operating conditions, and rigorous equipment models, you can simulate actual plant behavior. Process simulation enables you to run many cases, conduct "what if" analyses, and perform sensitivity studies and optimization runs. With simulation, you can design better plants and increase profitability in existing plants.Process simulation is useful throughout the entire lifecycle of a process, from research and development through process design to production.
What is an Aspen Plus Process
Simulation Model?
A process consists of chemical components being mixed, separated, heated, cooled, and converted by unit operations. These components are transferred from unit to unit through process streams.
You can translate a process into an Aspen Plus process simulation model by performing the following steps:
1 Specify the chemical components in the process. You can take these components from the Aspen Plus databanks, or you can define them. 2 Specify thermodynamic models to represent the physical properties of the
components and mixtures in the process. These models are built into Aspen Plus.
3 Define the process flowsheet:
o Define the unit operations in the process.
o Define the process streams that flow to and from the unit operations. o Select models from the Aspen Plus Model Library to describe each unit
operation and place them on the process flowsheet.
o Place labeled streams on the process flowsheet and connect them to the unit operation models.
4 Specify the component flow rates and the thermodynamic conditions (for example, temperature and pressure) of feed streams.
5 Specify the operating conditions for the unit operation models.
With Aspen Plus you can interactively change specifications such as, flowsheet configuration, operating conditions and feed compositions, to run new cases and analyze process alternatives.
In addition to process simulation, Aspen Plus allows you to perform a wide range of other tasks such as estimating and regressing physical properties, generating custom graphical and tabular output results, fitting plant data to simulation models, optimizing your process, and interfacing results to spreadsheets.
Sessions in this Book
The hands-on sessions in this book are described in the following table:
Follow the steps in this chapter To Learn how to
1 Aspen Plus Basics Start Aspen Plus, use the Aspen Plus user interface, and exit Aspen Plus.
2 Building and Running a Process
Simulation Model Build and run a typical Aspen Plus processsimulation model. 3 Performing a Sensitivity Analysis Use Aspen Plus to study the sensitivity of
process performance to changes in process feeds and operating variables.
4 Meeting Process Design
Specifications Use Aspen Plus to make your process modelmeet a design specification by manipulating a process feed or operating variable.
5 Annotating Process Flowsheets Add stream tables, graphics, and text to your process flowsheet.
6 Estimating Physical Properties for
a Non-Databank Component Use Aspen Plus to enter and estimate missingphysical properties required for simulation. 7 Analyzing Properties Use Aspen Plus to generate tables and plots of
physical properties, computed over a range of values.
Using Backup Files
We recommend that you perform all sessions sequentially using the results of the previous chapter in the current chapter. However, you can skip chapters and work on the session of your choice using backup files containing
simulation data.
Aspen Plus provides backup files (filename.bkp) containing all problem specifications and results for each tutorial session. In some cases, if you skip a session, you need to load a backup file to supply missing data. Each chapter contains instructions for how to do this.
Related Documentation
In addition to this document, a number of other documents are provided to help you learn and use Aspen Plus.
Title Content
Aspen Plus Getting Started Modeling Processes with Solids
Tutorials covering the Aspen Plus features designed to handle solids Aspen Plus Getting Started Modeling
Processes with Electrolytes
Tutorials covering the Aspen Plus features designed to handle electrolytes
Aspen Plus Getting Started Customizing
Unit Operation Models Tutorials covering thedevelopment of custom unit operation models in Aspen Plus Aspen Plus Getting Started Using Equation
Oriented Modeling
Tutorials covering the use of equation-oriented models in Aspen Plus
Aspen Engineering Suite Installation
Manual Instructions for installing AspenPlus and other Aspen Engineering Suite products
Aspen Plus Help Procedures for using Aspen Plus
Technical Support
AspenTech customers with a valid license and software maintenance agreement can register to access the online AspenTech Support Center at: http://support.aspentech.com
This Web support site allows you to: Access current product documentation
Search for tech tips, solutions and frequently asked questions (FAQs) Search for and download application examples
Search for and download service packs and product updates Submit and track technical issues
Send suggestions Report product defects
Review lists of known deficiencies and defects
Registered users can also subscribe to our Technical Support e-Bulletins. These e-Bulletins are used to alert users to important technical support information such as:
Technical advisories
Product updates and releases
Customer support is also available by phone, fax, and email. The most up-to-date contact information is available at the AspenTech Support Center at
1 Aspen Plus Basics
This chapter leads you through an Aspen Plus simulation to explain how to open a file, enter data, run a simulation, and examine results.
Allow about 30 minutes for this session.
Starting Aspen Plus
1 From your desktop, selectStartand then selectPrograms.
2 SelectAspenTech, thenProcess Modeling <version>, thenAspen Plus, and then Aspen Plus <version>.
TheAspen Plus main window appears, showing theStart Using Aspen Plus window.
Note:To create a Windows desktop icon for Aspen Plus, right-clickAspen Plus <version>via theStartmenu, clickCopy, then right-click on your desktop and selectPaste Shortcut. Double-click the icon to start Aspen Plus.
The Start Using Aspen Plus
Window
TheStart Using Aspen Pluswindow provides these ways of starting a run: New and Open File -- quick access to start a new case or open an existing
case.
Recent Models — links to the recently opened cases.
Opening a File
Open a file for an Aspen Plus simulation by: Double-clicking the file in Windows.
Clicking the file name underRecent Modelson the Start Using Aspen Plus window.
SelectingOpenfrom the Filemenu in Aspen Plus.
In this section, useOpenon the Filemenu to open a partially completed Aspen Plus simulation stored in a backup file.
Note:This chapter does not describe all the steps necessary to create the partially-completed example file. The following chapters will explain all the steps necessary to set up Aspen Plus from a blank simulation.
To Display the File Menu
1 Click Filefrom the ribbon. TheFile menu appears:
2 From theFile menu, clickOpen.
TheOpendialog box appears, displaying your default working directory. 3 UnderFavorites at the left, clickAspen Plus<version> Favorites.
By default, the Aspen Plus favorites folder contains shortcuts to four folders that are provided with Aspen Plus. The files in these folders are designed to assist in creating suitable simulation models in Aspen Plus. 4 Double-click the shortcut to theExamplesfolder, then the GSG_Process
folder.
5 From the list of files, selectflash.bkpand clickOpen.
6 An Aspen Plus dialog box appears, informing you that you don't have write access to the directory containing this file, and that Aspen Plus is changing the working directory to a public one. Click OK.
While Aspen Plus opens the simulation model, the cursor shows the busy symbol, to indicate that Aspen Plus is finishing an operation. When the operation is complete, the cursor returns to the arrow shape.
7 Click theSimulation bar on the Navigation Pane to go to the Simulation environment.
The Aspen Plus Main Window
The Aspen Plus main window (shown below) appears when you start Aspen Plus. Open an Aspen Plus case, then click the Simulationbar on theNavigation Pane to get the display style shown below. TheMain Flowsheet window is shown in the workspace area and theFlowsheet tabs appear on the ribbon along with other tabs. The Navigation Pane is on the left side of the main window to provide access to various work folders and forms.
Aspen Plus displays context-dependent definitions and information on the Messages Panel. To activate this panel, on theViewtab of the ribbon, click Message Panel. Whenever you need information about the current
highlighted item, refer to this area for guidance.
Quick Access Toolbar — theQuick Access Toolbarappears at the left side of the title bar. You can customize the Quick Access Toolbar to add other frequently used commands; these commands are always visible, no matter which tab of the ribbon is active.
Ribbon — click any of the tabs on the ribbon to access a set of related commands. These commands are split into named groups, such asRun, Units,Summary,Analysis andPlot on theHometab.
Navigation Pane — the Navigation Pane applies to all open forms, and updates to show the currently open form when you move to a new form or switch tabs to a previously opened one. Also, you can click the
Properties andSimulationbars on the Navigation Pane to switch between the two environments.
Tabbed windows in the workspace — forms, the flowsheet, Control Panel, plots, and other windows appear with separate tabs in the workspace. You can click and drag tabs to one side of the workspace to display them side by side, or drag them out of the Aspen Plus window entirely.
Properties and Simulation environments — Aspen Plus is now divided into separate Propertiesand Simulationenvironments. The environment bars on the Navigation Pane let you switch between these environments. Status messages— the main status message (such asRequired Properties
quick access to the run status and any error or warning messages from the last run.
Zoom slider and Zoom In — use the Zoom slider and theZoom Inbutton on the right side of the Status bar to quickly adjust the size of the
flowsheet, grids, plots shown in the tabbed windows in the Workspace.
Selecting Flowsheet Objects
Aspen Plus displays the process flowsheet for the opened Flash simulation:Process flowsheets display streams and unit operation blocks. The Flash simulation has one feed stream (stream1), two product streams (streams 2 and3), and one unit operation block (B1).
Next, select the feed stream (stream1) on the process flowsheet and enter specifications.
Using a Shortcut Menu
A shortcut menu of commands is available for the flowsheet objects.
To Display the Shortcut Menu for Stream 1
1 Select Stream1and click the right mouse button.
Note:Make sure the tip of the cursor arrow is touching the stream, otherwise you will get the flowsheet shortcut menu instead of the stream shortcut menu.
The stream shortcut menu appears, listing the executable commands for stream 1:
2 Move the cursor to highlight the commands in the shortcut menu.
Opening Input Sheets
Aspen Plus provides input sheets to allow you to specify the components of a stream and properties such as temperature. There are multiple ways to access the input sheets:
Use the Navigation Pane to navigate toStreams | 1 | Input to open the 1 (MATERIAL) | Mixedsheet.
Note:Theitem | sub-item shorthand means “clickitemthen click sub-item.” This shorthand will be used for many hierarchical selection
processes including the Navigation Pane and Filemenu. From the Stream 1shortcut menu, selectInput.
To Open the Input Sheets for Stream 1
2 From the stream shortcut menu, clickInput.
Tip:To open a stream or block input sheet quickly, double-click the object from the process flowsheet.
The1 (MATERIAL)window appears on a separate tab in the workspace.
Note:A sheet may be required, unavailable, or optional. In this example, the Mixedsheet is required and incomplete (hence the symbol: ). TheFlash Options,EO Options, Costing andInformationsheets are optional. Navigate from form to form by expanding the folders in the Navigation Pane and clicking the lowest level objects. For example, if you want to see the input form for stream1, expand theStreams | 1folder by clicking the icons next toStreamsand1, then clickInput.
Navigate from sheet to sheet by clicking the large rectangular tabs at the top of the sheet. For instance, to see the CI Solidsheet on theStreams | 1 | Inputform, after opening the form, click theCI Solid tab to the right of Mixed.
Navigate to other windows by clicking the window tabs in the workspace (the small tabs above the sheet tabs in the above example). For example, if you want to go back to the process flowsheet, click theMain Flowsheet tab to the left of 1 (MATERIAL).
Using Help
Before specifying the characteristics of Stream 1 you may wish to get
context-sensitive help about the sheet itself, the form to which it belongs, or about the various fields within the sheet. To get help, click the box or sheet, then press F1(the help key).
Get help on the1 (MATERIAL) | Mixed sheet and on the whole input form. 1 Click the tab labeledMixed.
Aspen Plus displays a help window that explains how to use theMaterial Stream Input Mixed Sheet:
3 Scroll to the end of the help topic and click the underlined textMaterial Stream Input Form.
TheMaterial Stream Input Formhelp topic appears.
Aspen Plus displays the help for the Material Stream Input form, which, in this case, consists of the following sheets:Mixed, CI Solid, NC Solid, Flash Options, EO Options, Costing, Information.
4 When finished, close the help window.
To Get Help on any Topic
You can get help on any topic at any time by using the Helpbutton. 1 At the right end of the ribbon, click
-or-pressF1from the keyboard.
2 Use the UpandDown arrow keys on the keyboard to move through the Helpcontents.
3 In the Contentspane at the left, double-clickUsing Aspen Plus. Tip:You can clickHideor Show on the help window's toolbar to hide or reveal the left pane which displays theContents,Index, andSearch tabs. You can click theIndex andSearchtabs to look for help by subject.
4 Double-click a topic labeled with the icon to display the associated help topic or double-click items labeled with the icon to view more topics. 5 When finished, close the help window.
Entering Data on a Sheet
Once an input sheet is opened, state variables, units, and numeric data may be entered into the available fields (white rectangular boxes) or selected from drop-down lists. There are two ways to move from field to field on a sheet: Press theTabkey on your keyboard.
Position the cursor in the field and left-click.
In this simulation, enter missing temperature, pressure, and component flow data forStream 1.
1 If necessary, click the tab for the1 (MATERIAL)form in the workspace to make it active.
2 Enter the following state variable and component flow specifications on the Mixedsheet:
Parameter Value Units
Temperature 180 F
Pressure 20 psia
Methanol mole-flow 50 lbmol/hr
Water mole-flow 50 lbmol/hr
Since the default units are appropriate for this simulation, you only need to enter the values.
The completed1 (MATERIAL)form appears below (the Navigation Pane is not shown):
When all required specifications have been entered, a check mark ( ) appears on the tab header containing the sheet name. Check marks also appear in the icons on the Navigation Pane.
Expert Guidance – the Next
Function
The Aspen Plus expert system, known as the Nextfunction, guides you through all the steps for entering specifications for your simulation model. TheNext function:
Guides you through the required and optional input for a simulation by displaying the appropriate sheets.
Displays messages informing you what you need to do next.
Ensures that you do not enter incomplete or inconsistent specifications even when you change options and specifications you have already entered.
To Use the Next Function to Display the
Next Required Form
1 From the Quick Access Toolbar, click .
Aspen Plus displays the next sheet that requires input data, in this case, the B1 (Flash2) - Input | Specificationssheet:
Now you should enter the temperature and pressure specifications. If you click while the sheet is incomplete, theCompletion Status dialog box appears indicating the missing specifications:
Click Xin the upper right corner to close the Completion Status message window.
2 Change the first option ofFlash Type fromTemperatureto Dutyby clicking and selectingDutyfrom the list. The input fields of Pressure andDutyare now active while other specifications are not valid.
This sets the necessary specification needed to run the flash calculation. You can change the combination by clicking beside the input field for each specification, and then selecting other options from the list.
3 In the Pressurevalue field, type 1.
4 In the Pressureunits field, click and selectatmto change the input units from psia to atm.
5 In the Dutyvalue field, type0.
There is no need to change the units (Btu/hris the default).
6 The box in theValid phasesarea is set to Vapor-Liquidby default. For this simulation, accept the default.
Note:Default values on input sheets appear in blue and italic unless you modify them, in which case they will appear in blue and bold text.
The check marks ( ) on the Navigation Pane and the absence of partially filled circles ( ) indicates that all required data have been entered on forms. TheRequired Input Complete message at the lower left corner of the main window indicates that all required data in the entire model have been
entered.
Running the Simulation
The input specifications for this simulation model are complete and the simulation is ready to be run. Run the simulation in either of the following ways:
From the Hometab of the ribbon, inRun, click . From the Quick Access Toolbar, click .
PressF5.
Once the process flowsheet has been fully specified, running the simulation is easy.
To Run the Simulation
On theHometab of the ribbon, in Run, click .
While Aspen Plus performs calculations for the simulation, the cursor has a stop sign shape. The block being executed is also highlighted in the process flowsheet window. When the calculations are complete, the cursor returns to the arrow shape. On the Status bar at the bottom of the main window, the message Results Availableappears on the left.
TheEconomic Analysisdialog box appears. If you want to evaluate the capital and operating costs, make sure that you have installed and have a valid license for Aspen Process Economic Analyzer before clickingActivate.
Note:ClickControl PanelinRun to open the Control Panel and check the run-time message for the calculation. If the calculation completes with errors or warnings, the warning or error messages will be shown on the Control Panel.
Examining Stream and Block
Results
Now view the results for the flash overhead vapor stream (Stream 2) and for the flash block (Block B1).
To Display the Flash Overhead Vapor
(Stream 2) Results
1 Display the process flowsheet by clicking theMain Flowsheet tab in the workspace.
Note:If the streams in your process flowsheet now have temperature and pressure data attached to them, you can remove these attachments by clearing the check boxes forTemperature andPressurein Stream Resultson the Flowsheet | Modifytab on the ribbon. After that, you may wish to click the Viewtab on the ribbon, in Zoom,selectZoom Out or Zoom to Fitto make your flowsheet look nice with the attachments. 2 Select stream2and right-click on the stream to display the shortcut
menu.
3 From the shortcut menu, selectResults.
The2 (MATERIAL) - Resultsform opens in a new window tab, providing the thermodynamic state and composition flows of the vapor stream:
4 From the Navigation Pane, selectBlocks | B1 | Results.
Note:You can expand the tree items shown on the Navigation Pane by clicking the symbol next to a closed folder. When you select a new folder, it automatically expands with the first item selected.
TheB1 (Flash2) - Resultsform appears with the overall results for the block:
5 Review the calculated flash outlet temperature and overall vapor fraction. 6 Click each tab shown in the B1 (Flash2) - Resultswindow to browse
through the results. For example, click theBalancetab to review the mass and energy balance data, and Phase Equilibriumtab to review the vapor-liquid equilibrium results.
Modifying and Rerunning Your
Model
1 From the process flowsheet, select and right-click stream1to display the stream shortcut menu.
2 SelectInput.
The1 (MATERIAL)form opens in a new window tab, with data on the Mixedtab displayed in view.
3 In the Compositionarea, enter the following values for the component mole-flows:
On the Navigation Pane, the icons in front of the folder and form names have changed to and , indicating the input data changed in these forms.
4 On theHometab of the ribbon, in Run, click to run the simulation with the new feed stream values.
Component Value
Methanol 60
5 When the run is completed, display the new results for the outlet streams and the flash block.
Saving Your File and Exiting
Aspen Plus
For this example, save your file as both an Aspen Plus document (.apw) file and an Aspen Plus backup (.bkp) file. Document files contain all the
intermediate convergence information from the simulation and are useful for saving long simulations. This information is not forward compatible for new versions of Aspen Plus. When you open a Document file in a newer version of Aspen Plus, a backup file embedded in that document file will be used,
instead.
Backup files are compact, portable, and are forward compatible but contain only the input specifications and simulation results. The first run using a backup file will take just as long as the very first run of the simulation. First, set Aspen Plus to create a backup file with each save.
To Change the Save Options
1 On the upper left corner of the ribbon, click Fileto open theFilemenu. Click Optionsat the bottom of the menu.
TheSimulation Run Optionsdialog box appears.
2 In the left pane, click Filesto display the options available for file settings.
3 In the Save optionsarea, select the check box next toAlways create backup copy, if it is not already checked.
4 Click OK.
To Save and Exit
1 On the ribbon, clickFileand then move your cursor to Save As. A list of available file types appears on the right side of the menu.
2 Click Aspen Plus Documentto save your simulation as an Aspen Plus document (.apw) file. TheSave Asdialog box appears.
If necessary, use the Save inlist to navigate to your Aspen Plus working folder. In this example, the folder is located in <driver>:\Program
Files\AspenTech\Working Folders\Aspen Plus <version>.
3 TypeFlash as the file name in theFile namefield. Click Save.
Aspen Plus will place a file calledFlash.apwand a file calledFlash.bkpin your Aspen Plus working folder. See the Aspen Plus User Guidefor
detailed descriptions of the characteristics of these files. 4 On the ribbon, clickFileand select Exit.
2 Building and Running a
Process Simulation Model
In this simulation, create an Aspen Plus process model for a methylcyclohexane (MCH) recovery column.
This simulation is divided into three sections: 1 Building the Process Model.
2 Adding Data to the Process Model. 3 Running the Simulation.
4 Examining the Results.
Allow about 50 minutes for this simulation.
Building the Process Model
In this section, build the process model by performing these tasks: 1 Define the process to be simulated.2 Start Aspen Plus.
3 Create a new simulation. 4 Define the required properties. 5 Build a process flowsheet.
Defining the Simulation:
Methylcyclohexane Recovery
Column
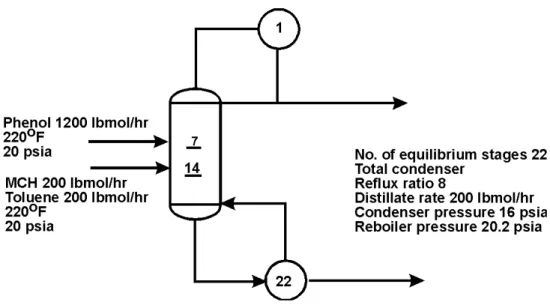
Figure 2.1 Simulation Definition: MCH Recovery Column
MCH and toluene form a close-boiling system that is difficult to separate by simple binary distillation. In the recovery column in Figure 2.1, phenol is used to extract toluene, allowing relatively pure methylcyclohexane to be
recovered in the overhead.
The purity of the recovered methylcylohexane depends on the phenol input flow rate. In this session, create an Aspen Plus simulation that allows you to investigate the performance of the column.
Starting Aspen Plus
1 From your desktop, selectStartand then selectPrograms.
2 SelectAspenTech,thenProcess Modeling <version>, thenAspen Plus, then Aspen Plus <version>.
TheAspen Plus main window appears, showing theStart Using Aspen Plus window.
For more information about this window, see "The Aspen Plus Main Window" on page 9.
Create a new simulation using an Aspen Plus built-in template.
Creating a New Simulation
Aspen Plus provides built-in templates for applications such as chemicals, petroleum, electrolytes, specialty chemicals, pharmaceuticals, and metallurgy. 1 On the ribbon, clickFileand select New.
TheNewdialog box appears. Use the Newdialog box to choose an appropriate template for the new run.
To Specify the Template for the New Run
2 From the pane on the left of theNewdialog box, click Chemical Processesso that the chemical processes templates are shown. 3 Click theChemicals with English Units template.
4 Click Create.
It takes a few seconds for Aspen Plus to finish setting up the new problem.
The template is loaded with default settings for the simulation.
Defining the Required
Properties
Aspen Plus provides three working environments, Properties, Simulation, andEnergy Analysis. ThePropertiesenvironment includes the set of features available in Aspen Properties. For more information about Aspen Properties, please refer to Aspen Properties Help. In theSimulation environment, you can work on the process flowsheet, specify process data, and execute the calculation. It is recommended that you set up all required properties settings before configuring the simulation. TheEnergy Analysis environment is used for optimizing energy usage in a completed simulation model, and will not be covered in this document.
Note:Switch between the environments by clicking the Propertiesand Simulation bars on the Navigation Pane. The list of folders and forms on the Navigation Pane varies in different environments, and the available ribbon tabs and the open windows also differ among the environments. For example, the Main Flowsheetwindow can only be opened in the Simulation
environment; as a result, the Flowsheettabs only appear on the ribbon when you are in the Simulation environment and looking at the Flowsheet window.
Aspen Plus starts a new simulation from the Properties environment. If you need to specify the process flowsheet first, click theSimulationbar on the Navigation Pane to switch to the Simulation environment.
Entering Components
Use theComponents - Specificationsform in thePropertiesenvironment to select the chemical components present in the simulation.
1 Check if you are in the Properties environment by looking at the bars on the Navigation Pane. ThePropertiesbar should be highlighted, indicating that the current environment isProperties.
2 From the Navigation Pane, clickComponents | Specification to open the form.
The components for the process in this simulation are toluene, phenol, and methylcyclohexane.
To Enter a Unique Component ID for Each
Component
1 In the Component IDfield, typeTOLUENEand pressEnter on the keyboard.
Because Aspen Plus recognizes the component name Toluene as an Aspen Plus databank component, it fills in theType, Component name,and Aliasfields automatically.
2 In the nextComponent IDfield, typePHENOLand press Enter on the keyboard.
Note:If the Update Parametersdialog box appears, clickYesto continue.
Aspen Plus again fills in the remaining fields.
3 In the nextComponent IDfield, typeMCHand press Enteron the keyboard.
The Aspen Plus databank does not recognize the abbreviation MCH. 4 In the MCHcomponent name row, typeMETHYLCYCin theComponent
name field and pressEnteron the keyboard. TheFind Compoundsdialog box appears.
5 Click theDatabanks tab and the click to move all to the Selected databanks list.
6 Click theCompounds tab, selectAllforCompound class.
7 Click Find nowto list all the
components in the Aspen Plus databank that have a name containing
METHYLCYC.
8 The resulting compound names are very long. To view the whole names, move the cursor to the right edge of the Compound name column, until it turns into the shape, then click and drag to the right.
9 From the list of components found from the databanks, locate and select
METHYLCYCLOHEXANE.
10 Click Add selected compounds. 11 Click Close.
Note:If you need to search for components based on molecular weight range, boiling point range, or CAS numbers, specify values in the fields on the Compoundstab to perform advanced search.
You have now specified the three components required for this process simulation model: Toluene, Phenol, and Methylcyclohexane:
12 Click .
Note:You can navigate to the incomplete forms yourself by clicking on folders in the tree view on the Navigation Pane marked with the
symbol.
TheBinary Interaction -NRTL-1 (T-DEPENDENT) | Inputsheet appears.
13 From the Navigation Pane, clickMethods | Specifications.
Methods - Specifications | Globalsheet appears. This sheet is already complete with the default settings from the Chemicals with English Units template.
Selecting Thermodynamic Methods
Use the Methods - Specificationsform to select the property method used to calculate properties such as K-values, enthalpy, and density. The Base methodlist contains various property methods built into Aspen Plus. The specific methods in the list depend on the chosen method. To see all the available methods (a very long list), in theMethod filter field, click and select ALL.
Note:Clicking theModify check box allows you to create a custom property method that starts out identical to the chosen base method but may be modified according to your needs. For more information, see the online help topic Using Aspen Plus | Entering Property Specifications | Physical Property Methods.
For this simulation, use the UNIFACproperty method to calculate thermodynamic properties.
To Find the Appropriate Type of Base Method for
this Simulation
1 In the Base method list, click to display the available property methods in Aspen Plus:
Get a brief description of a base method by selecting it and reading the messages shown in the Messages Panel. For detailed information about a base method, refer to thePhysical Property Methodsreference manual. 2 From the Base methodlist, selectUNIFAC.
3 Click .
TheProperties Input Completedialog box appears.
TheRequired Properties Input Completemessage appears on the left side of the Status bar.
Aspen Plus can run the properties calculation if you select theRun properties analysis / setupoption in theRequired Properties Input Completedialog box.
4 Select the optionGo to Simulation environment and clickOK. You have completed the required input for properties.
Now enter theSimulationenvironment to build the process flowsheet and input the process data.
The process flowsheet window now opens in a window namedMain
Flowsheet. It docks in the workspace (beside other open windows, if any).
Defining the Flowsheet
In the flowsheet for the MCH process shown in Figure 2.1, there are two feed streams (MCH-toluene feed and phenol solvent), one unit operation (an extractive distillation column), and two product streams (distillate and bottoms).
Set up the Aspen Plus process flowsheet by placing the unit operation block in the workspace and connecting four streams to it.
If you do not see theModel Palette below the Flowsheet:
To Open the Model Palette
1 Click theView tab on the ribbon. 2 Click Model Palette.
The Model Palette docks below the Flowsheet with icons for the unit operation blocks shown on several tabs.
To Select a Unit Operation Block
1 On the Model Palette, click theColumnstab.
The list of available distillation columns appears displayed as a row of icons. Moving the cursor over a block causes a description to appear beside the block icon.
2 Read the prompt for theRadFrac block.
The description suggests this is the right model for this simulation. 3 SelectRadFrac,then press F1(the Help key) on the keyboard.
The help information confirms thatRadFrac is suitable for extractive distillation.
4 Close the Help window.
To Choose a RadFrac Icon and Place a Block
1 Click the arrow to the right of theRadFrac column. The available icons for RadFracappear:
2 Move the cursor over the displayed icons to view the label for each icon. 3 Click the icon labeledFRACT1to select the model.
4 Move the mouse to the middle of the workspace and click the left mouse button.
The block appears on the flowsheet with the default nameB1:
Results, this opens theFlowsheet Display Options dialog box. Clear the check boxes in front ofAutomatically assign block name with prefix andAutomatically assign stream name with prefix. Click Apply and thenOK to close the dialog box.
Notes about block placement:
FRACT1is now the default icon for theRadFrac block.
Clicking once on an icon enables multiple block placement. The cursor becomes a crosshair and you can click anywhere on the process flowsheet to place any number of blocks. Click or the right mouse button when finished.
Your RadFrac block may have a 3-D appearance. The 3D Iconscheck box inUnit Operations, on the Modifytab of the ribbon determines whether these icons are used.
To Connect Streams to the Block
1 From the Model Palette, click once. This will allow you to place multiple streams.
2 Move the cursor (now a crosshair) onto the process flowsheet.
Ports on the block that are compatible with the stream are indicated by arrows. Red means required; blue means optional. Hover over a port to see a description.
3 Find the Feed (Required; one or more)port and click once to connect a feed stream to the port.
4 Move the cursor to any blank part of the process flowsheet and click once to begin the feed stream at that location. TheAdd Stream dialog box appears. Type1as the name for the feed stream.
5 Create another material feed stream, stream2, connecting to blockB1 at the same port as Stream 1 by repeating steps 3 and 4.
6 Create another stream (Stream 3) connected to the liquid distillate port near the top of the block. The full name of this port is: Liquid Distillate (Required if Distillate Vapor Fraction < 1 (Setup Condenser
sheet)).
7 Connect Stream 4to theBottoms (Required)port. 8 Click to stop adding streams.
The status indicator in the bottom left corner of the main window says
Required Input Incompleteindicating that further input specifications are required before running the simulation.
Notes about Stream placement:
To select a Heat or Work stream instead of a Material stream, click the arrow next to the stream icon on the left side of the Model Palette and choose either theHeat orWork stream icon.
To cancel connecting a stream at any time, press theEsc key on the keyboard or click the right mouse button.
You can delete a stream by selecting it and pressing theDelete key. However, Aspen Plus will continue to increment the numeric label for new streams, if they are being labeled automatically.
To rename a particular stream, select it, right-click, and clickRename Streamon the shortcut menu.
The easiest way to get the shortcut menu is to select the stream label and right-click in its box.
Click the stream icon on the Model Palette and drag to place a single stream. Drag to a port and release the left mouse button to connect the stream. Move the cursor to any blank area or another port and click once to place the other end of the stream.
Adding Data to the Process
Model
Now that you have created your process flowsheet, use the input forms to enter the remaining required information for this run.
The Aspen PlusNextfunction (available with the button in the Quick Access Toolbar and Home tab of the ribbon) displays the required input sheets automatically. You can also navigate to an input sheet in any of the following ways:
Use the Navigation Pane to navigate to any input form.
Select a stream or block in the process flowsheet, right-click, and then select Inputon the shortcut menu.
Specifying a Title for the
Simulation
1 From the Navigation Pane, clickSetup | Specifications. TheSetup - Specifications | Globalsheet appears.
2 In the Titlebox, enter the text Methylcyclohexane Recovery Process and pressEnter on the keyboard.
TheSetup - Specificationsform displays a number of settings that apply to the whole simulation. The chosen template set the units to English (ENG). These may be changed here globally, or in other sheets for particular streams or blocks. For more information about global specifications, see the online help topicUsing Aspen Plus | Entering Data for Simulations | Global Information for Calculations.
Specifying Data to be Reported
Results data may be examined interactively in Aspen Plus or after exiting by viewing a report file with a text editor.For this simulation, tell Aspen Plus to calculate mole fractions as well as a built-in set of properties called TXPORT.
1 Navigate toSetup | Report Optionsby clicking once on the Report Optionsform under theSetup folder on the Navigation Pane.
Note:If theReport Options form is not visible click the symbol next to the Setupfolder to expand it.
TheSetup - Report Options | Generalsheet appears.
By clicking the appropriate tab, you can customize the reporting for specific parts of the simulation.
3 In the Fraction basisarea, select theMolecheck box.
Now Aspen Plus will calculate and report mole fractions of all stream components.
4 Click Property Sets.
5 The template you chose at startup contains a number of available
property sets. SelectTXPORTfrom the list and click to move the property set to theSelected property sets column.
Now Aspen Plus will calculate and report density, viscosity, and surface tension for all streams. To learn more about Aspen Plus built in property sets and user-defined property sets, see the online help topics Using Aspen Plus | Entering Data for Simulations | Global Information
| Designating Property SetsandAspen Plus Reference | Physical Property Data Reference Manual | Property Sets.
6 Click Close. 7 Click .
The1 (MATERIAL) - Inputform appears.
Entering Stream Data
Make Stream 1 the MCH-Toluene feed stream.1 On the1 (MATERIAL) - Input | Mixedsheet, enter the following state variable and component flow specifications for the MCH-Toluene feed stream:
Parameter Value Units
Temperature 220 F
Pressure 20 psia
Toluene flow rate 200 lbmol/hr
MCH flow rate 200 lbmol/hr
Because the default parameters and units are correct for this simulation, you only need to enter the values.
The1 (MATERIAL) - Input | Mixedsheet is complete:
2 Click .
The2 (MATERIAL) - Input | Mixedsheet appears. Make Stream 2 the phenol feed stream.
3 Enter the following specifications for Stream 2:
Parameter Value Units
Temperature 220 F
Pressure 20 psia
Phenol flow rate 1200 lbmol/hr
4 Click .
TheB1 Specifications - Setup | Configurationsheet appears:
Entering Unit Operation Block
Data
On theB1 (RadFrac) - Setupform, the number of stages, the condenser type, and two operating specifications are required data. The reboiler type, valid phases, and convergence method have default choices displayed in shaded type.
1 Click each box and read the descriptive messages on the Message Panel. To view the Message Panel, on theView tab of the ribbon, clickMessage Panel.
If you click while the sheet is incomplete, theCompletion Status message box appears indicating the missing specifications:
Close theCompletion Statusdialog box.
2 Enter the following specifications for the column:
Parameter Value Units
Number of stages 22 —
Condenser Total —
Distillate rate 200 lbmol/hr
Reflux ratio 8 —
Accept the defaults in the Reboiler, Valid phases, and Convergence fields.
The blue check mark on theConfigurationtab indicates the sheet is complete:
TheB1 (RadFrac) - Setup | Streamssheet appears.
In the RadFrac model, there are N stages. Stage 1 is the top stage (the condenser); stage N is the bottom stage (the reboiler). As shown in Figure 2.1, the MCH-Toluene feed (stream 1) enters above stage 14, and the phenol solvent stream (stream 2) enters above stage 7.
4 Enter14 in the Stagefield for Stream 1. 5 Enter7in the Stagefield for Stream 2.
6 Accept the defaults for the entry point conventions for the feed streams and for the locations and phases of the product streams.
TheB1 (RadFrac) - Setup | Streamssheet is complete:
7 Click .
TheB1 (RadFrac) - Setup | Pressuresheet appears.
You can enter a stage-by-stage profile, or specify a top-stage pressure and a pressure drop for the rest of the column. For this example, use a condenser pressure of 16 psia, and a reboiler pressure of 20.2 psia. Aspen Plus interpolates the pressure of the intermediate stages.
8 In the Viewlist, click and select Pressure profile. 9 In the firstStage field, type1and then press the Tabkey. 10 In the firstPressure field, type16and press Tab.
11 In the nextStagefield, type 22 and pressTab.
12 In the nextPressurefield, type20.2 and pressEnter. 13 Accept the default Pressure units (psia).
14 Click .
TheRequired Input Complete dialog box appears.
Note:You can enter additional specifications on optional input sheets, or go back to any of the required sheets and make changes. To see what optional input sheets are available, click Cancelon the Required Input Complete dialog box and navigate through the Navigation Pane to view all the folders. TheReactions, Convergence, Flowsheeting Options,andModel
Analysis Toolsfolders are optional.
Running the Simulation
From the Required Input Completedialog box, click OK. The Control Panel appears and the simulation run begins:Use the Control Panel to monitor and interact with the Aspen Plus simulation calculations. For more information on how to use the Control Panel, see the topic Control Panel: aboutin the online help index.
As Aspen Plus executes the simulation, status messages appear in the Control Panel. When the simulation is complete, the messageResults Available
appears on the status bar at the bottom of the main window.
TheEconomic Analysisdialog box appears. If you want to evaluate the capital and operating costs, make sure that you have installed and have a valid license for Aspen Process Economic Analyzer before clickingActivate.
Note:Click the tabs at the head of the active forms to navigate between different windows. For example, to view the Flowsheet, click the
tab.
Examining Simulation Results
Now you can examine the results of your simulation.1 Navigate to the process flowsheet in one of these ways: o Click theMain Flowsheettab, or
o Click the icon of Flowsheeton the Quick Access Toolbar, or o Click FlowsheetinShow on theView tab of the ribbon
To Display the Results for Block B1
2 On the process flowsheet, select either the block name B1or the block itself, then right-click to display the shortcut menu.
Note:You may wish to alter the appearance of your flowsheet by using the Zoomtools on theViewtab of the ribbon, for example, Zoom to Fit. 3 From the shortcut menu, selectResults.
For this run, block results are reported on three forms: Results, Profiles, andStream Results. On the Navigation Pane, a check mark in a square
appears next to each form to indicate that they contain results.
4 From the Navigation Pane, selectBlocks | B1 | Profilesby clicking once on Profiles.
TheB1 (RadFrac) - Profiles | TPFQ sheet appears, reporting temperature, pressure, heat duty, and flow profiles for the block:
5 Use the scrollbar(s) to view the displayed profiles. 6 Click next to theView list and selectStage flows.
7 Use theBasis list to specify the type of units available for the displayed results.
8 Use the units box in each column to select the desired units for the display. Aspen Plus will perform the conversions automatically.
9 Use the Navigation Pane and the tabs on each form to view the rest of the results for Block B1. Click theCompositionstab.
10 Check the purity of the methylcyclohexane overhead product by examining the composition at the top of the column (stage 1).
This simulation predicts a little better than 97% purity for the MCH product with the given stream and block specifications.
Examining Stream Results
Display calculated stream results by selecting a stream directly from the process flowsheet.
To Display the Results for Stream 3
1 Navigate to the process flowsheet.
2 Select Stream 3 and right-click to display the shortcut menu. 3 SelectResults.
The3 (MATERIAL) - Results | Material sheet appears, providing the results for Stream 3:
In addition to the thermodynamic state and flow results for the stream, mole fractions are also given (use the vertical scroll bar to view them) because you requested them by clicking the appropriate check box in theSetup | Report Options | Streamsheet.
To Display the Results for All Streams on
the Same Sheet
1 On the3 (MATERIAL) - Results | Materialsheet, click the box at the top of the first column of the data table (ignoring the field labels at the left) and select1.
2 Click the list box in the second column and select2. 3 Click the list box in the third column and select 3. 4 Click the list box in the fourth column and select4.
The results for all four streams are displayed. A quicker way to do this is to selectAll streamsin the Displaybox.
Note:You can close some of the windows if you wish. Click the X at the right side of the window's tab to close that window.
Changing Input Specifications
In this section, review the effect of increasing the solvent flow rate on the purity and of the recovered methylcyclohexane.To Increase the Phenol Solvent Stream
Flow Rate
1 Navigate to the Flowsheet.
2 Select Stream 2, and right-click to display the shortcut menu. 3 SelectInput.
The2 (MATERIAL) | Mixedsheet appears.
4 In the Compositionfield, change the flow rate for PHENOL from 1200 lbmol/hr to 1800 lbmol/hr by changing the entry in theValuefield to 1800 and pressingEnteron the keyboard.
Since you have changed the input specifications, the symbols and
appear in several places on the Navigation Pane. The (Run) command on the Hometab of the ribbon is now enabled.
Rerunning the Simulation with
Changed Input
1 Click to continue.
TheRequired Input Completedialog box appears indicating that your input is complete and asking if you want to run the simulation with the new specifications.
2 Click OKto run the simulation.
The column calculations are completed using the new phenol flow rate. 3 Display the new block and stream results by either selecting blocks and
streams from the process flowsheet as before or navigating using the Navigation Pane.
MCH purity with the increased phenol flow rate is now over 98%. To choose an optimal flow rate, it would be helpful to generate a plot of MCH purity versus phenol flow rate. This is the subject of Chapter 3Performing a Sensitivity Analysis.
Creating Reports
To Generate a Report File
Aspen Plus allows you to generate a report file containing the simulation specifications and calculated results.
A list appears on the right. ClickFile. TheExportdialog box appears. 2 In the Save as typelist, select Report Files (*.rep).
4 Click Saveto generate the report file,MCH.rep.
By default,MCH.repis saved in your working directory (displayed in the Save inbox). You can select another directory by navigating to it.
You can open MCH.repwith a text editor to read or print the file; it is not necessary to be running Aspen Plus at the same time. If you double-click on an Aspen Plus report file, it will be opened with a Windows text editor, most likely Notepad.
To View and Save Part of a Report
You can also examine the report before exiting Aspen Plus by clickingReport inSummaryon the Hometab of the ribbon. TheReportdialog box allows you to select which part of the report you want to display (for example, data from Stream 1 only). Aspen Plus will display the selected part of the report (or the whole report, if you selectSimulation) using Notepad. From the Notepadwindow, you can then save the report fragment you are currently viewing by selectingFile | Save as.
Saving Your File and Exiting
Aspen Plus
1 From the ribbon, clickFile, and move the cursor to Save As.
A list appears on the right. ClickAspen Plus Document. The Save As dialog box appears.
2 In the File namefield, typeMCH. Make sure theSave as typefield reads Aspen Plus Documents (*.apw)and clickSave.
Aspen Plus saves the simulation in your working folder. Note:This folder is located in
C:\Program Files\AspenTech\Working Folders\Aspen Plus <version> if C:\Program Files\AspenTech is the Root Directory selected when Aspen Plus was installed.
3 SelectFile | Exitto exit Aspen Plus.
3 Performing a Sensitivity
Analysis
One of the benefits of a simulation is that you can study the sensitivity of process performance to changes in operating variables. With Aspen Plus, you can allow inputs to vary, and can tabulate the effect on a set of results of your choice. This procedure is called a sensitivity analysis.
In this chapter, you will perform a sensitivity analysis using either the methylcyclohexane (MCH) recovery simulation you created in Chapter 2 or the MCH simulation that was placed in the Examplesfolder when you installed Aspen Plus.
Allow about 20 minutes for this simulation.
Starting Aspen Plus
1 From your desktop, selectStartand then selectPrograms.
2 SelectAspenTech | Process Modeling <version> | Aspen Plus | Aspen Plus <version>.
Opening an Existing Simulation
You can open a saved simulation file from the list presented at startup, or by navigating to a folder containing the saved file. For this session, either open your savedMCH.apw from Chapter 2, or useMCH.bkpin theExamples\GSG_Processfolder.
If Your Saved File MCH.apw is Displayed
To open an existing simulation:
1 On theStart Using Aspen Pluswindow, findRecent Models. 2 In the list, selectMCH.apwand clickOK.
If Your Saved File MCH.apw is not
Displayed
1 Click Fileon the ribbon and selectOpen. TheOpendialog box appears.
2 Navigate to the directory containing your savedMCH.apw or navigate to the Examples\GSG_Processfolder containingMCH.bkp.
Note:TheExamplesfolder is located in:
C:\Program Files\AspenTech\Aspen Plus <version>\Favorites\Examples, if C:\Program Files\AspenTech is the Root Directory selected when Aspen Plus was installed.
3 Select eitherMCH.apw orMCH.bkp and clickOpen.
TheFlowsheetwindow of the MCH column simulation appears.
Saving a Simulation under a
New Name
Before creating a new simulation from MCH.apw or MCH.bkp, create a file with a new name,MCHSENS.apw. Now you can modify this new file. The original is safe.
1 From the ribbon, clickFileand then move the cursor to Save As. 2 In the Save Aslist which appears on the right side, select Aspen Plus
Document.
TheSave Asdialog box appears.
3 Choose the directory where you want to save the simulation from the Look inlist.
4 In the File namefield, enterMCHSENS. 5 Click Save.
Defining the Sensitivity
Analysis
In Chapter 2, you simulated MCH recovery using two values for the phenol solvent flow rate. In the following sensitivity analysis, tabulate
methylcyclohexane (MCH) distillate product purity (mole fraction), as well as condenser duty and reboiler duty, for several different flow rates of phenol. To do this, you must make sure that you are in theSimulation environment by checking that theSimulationbar is highlighted on the Navigation Pane.
Entering Sensitivity
Specifications
To Create a New Sensitivity Block
1 SelectModel Analysis Tools | Sensitivity. TheSensitivityobject manager appears. You can use this sheet to:
o Create new sensitivity blocks. o Edit existing sensitivity blocks. o View status of sensitivity blocks. 2 Click New.
TheCreate New IDdialog box appears. 3 Click OKto accept the default ID S-1.
TheS-1 | Varysheet appears.
This sensitivity analysis will generate a data table. The first column will contain a user-specified range of input values for the phenol flow rate. Three other columns will contain calculated results for MCH distillate product purity, the condenser duty, and the reboiler duty.
In the Varysheet, specify the range and increments for the manipulated variable (phenol flow rate). In theDefinesheet, define names for each of the calculated variables (product purity, condenser duty, reboiler duty). In the Tabulatesheet, set up the format you want for the data table.
Start with the definition of the MCH distillate product purity variable.
To Specify the Manipulated Variable
Define the phenol flow rate (Stream 2) to vary from 1200 lbmol/hr to 2000 lbmol/hr in increments of 100 lbmol/hr.
1 In the Edit selected variablesection, click beside theVariablefield, select <New>.The value of this field then changes to1.