RESEARCH ARTICLE
Celsr1 is required for the generation of polarity at multiple levels of
the mouse oviduct
Dongbo Shi1,2,‡, Kouji Komatsu1,3,*,‡, Mayumi Hirao1, Yayoi Toyooka1,4, Hiroshi Koyama1,4, Fadel Tissir5, André M. Goffinet5, Tadashi Uemura2,3and Toshihiko Fujimori1,3,4,§
ABSTRACT
The oviduct is an important organ in reproduction where fertilization occurs, and through which the fertilized eggs are carried to the uterus in mammals. This organ is highly polarized, where the epithelium forms longitudinal folds along the ovary-uterus axis, and the epithelial multicilia beat towards the uterus to transport the ovulated ova. Here, we analyzed the postnatal development of mouse oviduct and report that multilevel polarities of the oviduct are regulated by a planar cell polarity (PCP) gene,Celsr1. In the epithelium, Celsr1 is concentrated in the specific cellular boundaries perpendicular to the ovary-uterus axis from postnatal day 2. We found a new feature of cellular polarity in the oviduct–the apical surface of epithelial cells is elongated along the ovary-uterus axis. InCelsr1-deficient mice, the ciliary motion is not orchestrated along the ovary-uterus axis and the transport ability of beating cilia is impaired. Epithelial cells show less elongation and randomized orientation, and epithelial folds show randomized directionality and ectopic branches in the mutant. Our mosaic analysis suggests that the geometry of epithelial cells is primarily regulated by Celsr1 and as a consequence the epithelial folds are aligned. Taken together, we reveal the characteristics of the multilevel polarity formation processes in the mouse oviduct epithelium and suggest a novel function of the PCP pathway for proper tissue morphogenesis.
KEY WORDS: Celsr1/Flamingo, Planar cell polarity, Cilia, Epithelial morphogenesis, Oviduct, Cell shape
INTRODUCTION
The oviduct, or fallopian tube, is a tube through which ovulated oocytes and zygotes are transported from the ovary to the uterus. Morphologically, the oviduct comprises a simple columnar epithelium and a thin stromal layer surrounded by smooth muscle layers named myosalpinx (Stewart and Behringer, 2012). Oviduct epithelium forms folds that run in parallel with the ovary-uterus (longitudinal) axis, and these folds are thought to increase the epithelial surface area and ensure the transport of the oocyte. In mature mice, 17-19 epithelial folds exist in the infundibulum, and all of these folds are longitudinal to the oviduct (Agduhr, 1927).
Oviduct folds develop postnatally, as there are only one to two folds in the neonatal oviduct, and the number of folds gradually increases until 6 weeks of age (Agduhr, 1927). As development proceeds, the number of folds with the stroma inside is increased, and the height of the fold also rises (Agduhr, 1927). The presence of longitudinal epithelial folds in the oviduct is evolutionarily conserved in birds, amphibians and mammals (Bakst, 1998; Stewart and Behringer, 2012; Wake and Dickie, 1998). Folding of a cellular sheet is observed widely throughout the animal body, e.g. the convolutions of the brain and the gastric folds in the stomach or small intestine. The structure of folds is a good model to understand three-dimensional organogenesis or the morphological changes of an epithelial sheet. However, the mechanism(s) underlying the formation of folds has not been closely examined. How the fold is formed and how the folds are aligned longitudinally in the oviduct are open questions.
The oviduct epithelium comprises two types of cells: ciliated and secretory. About 80 percent of epithelial cells are ciliated in the infundibulum (Agduhr, 1927; Stewart and Behringer, 2012; Yamanouchi et al., 2010), which is the region close to the open end of the oviduct. Although the myosalpinx contractions also play roles in the transportation of ova, the ciliary movements at the infundibulum are sufficient to generate oviductal flow and to carry the oocytes towards the uterus (Halbert et al., 1989; Halbert et al., 1976; Shi et al., 2011). The orchestrated direction of ciliary motion is thought to be a key to ensure oocyte transport. This alignment of the polarity of ciliated cells is an example of planar cell polarity (PCP), which is the polarity of epithelial cells in a plane perpendicular to their apical-basal axis. Recent studies have revealed that PCP genes regulate ciliary polarity in frog epidermis (Mitchell et al., 2009; Park et al., 2008), the mouse brain ventricle (Guirao et al., 2010; Hirota et al., 2010; Tissir et al., 2010), the mouse embryonic node (Antic et al., 2010; Hashimoto et al., 2010; Song et al., 2010), the zebrafish Kupffer’s vesicle (Borovina et al., 2010; May-Simera et al., 2010) and the mouse trachea (Vladar et al., 2012). However, as yet, the roles of PCP genes in the oviduct epithelium have not been studied.
A group of PCP gene products form an asymmetric complex between neighboring cells to regulate planar polarity (Adler, 2012; Goodrich and Strutt, 2011; Wang and Nathans, 2007). One member of this group, flamingo, also known as starry night, encodes a seven-pass transmembrane cadherin localized at specific cellular edges in theDrosophila melanogasterwing (Chae et al., 1999; Usui et al., 1999). In the mouse, three orthologs offlamingo–Celsr1,
Celsr2,Celsr3(cadherin EGF LAG seven-pass G-type receptor)– have been identified (Formstone and Little, 2001; Hadjantonakis et al., 1997; Usui et al., 1999). Mice carrying a point mutation in
Celsr1are reported to have planar polarity abnormalities in the inner ear hair cells and hair follicle cells, as well as defects in neural tube closure (Curtin et al., 2003; Devenport and Fuchs, 2008).
Received 1 August 2014; Accepted 17 September 2014
1
Division of Embryology, National Institute for Basic Biology, 5-1 Higashiyama, Myodaiji, Okazaki, Aichi 444-8787, Japan.2Graduate School of Biostudies, Kyoto University, Kyoto 606-8501, Japan.3CREST, Japan Science and Technology Agency, Kawaguchi, Saitama 332-0012, Japan.4The Graduate University for Advanced Studies, Okazaki, Aichi, 444-8787, Japan.5Institute of Neuroscience, University of Louvain Medical School, Brussels B1200, Belgium.
*Present address: Bio-database Institute of Reproductive and Developmental Medicine, Nagoya, Aichi 458-0801, Japan.
‡
These authors contributed equally to this work
§
Author for correspondence (fujimori@nibb.ac.jp)
© 2014. Published by The Company of Biologists Ltd|Development (2014) 141, 4558-4568 doi:10.1242/dev.115659
DEVEL
O
In this study, we analyzed the roles of Celsr1 in the development of the mouse oviduct. Celsr1 protein localized in epithelial cellular edges in a polarized way from postnatal day 2 (P2). By observing the oviducts ofCelsr1-deficient mice (Ravni et al., 2009), we found Celsr1 was required for the orchestration of the direction of ciliary movements, the proper epithelial cell shapes and arrangements, and the orderly patterned alignment of epithelial folds in the longitudinal direction.
RESULTS
Postnatal development of the mouse oviduct
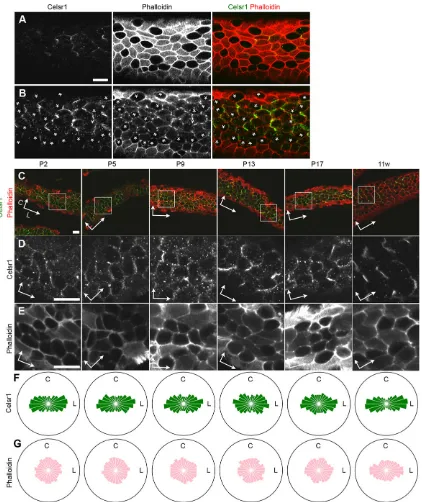
We focused on the infundibular region of the oviduct. The development and maturation of oviduct epithelium was analyzed in postnatal stages. We surgically opened the oviduct longitudinally to observe the apical epithelial surface. We mainly examined the cells on the top and at the lateral side of the epithelial folds in this study, because it was technically difficult to observe the cells in the deep regions of the fold. However, analyses of histological sections suggest that similar developmental processes occur over the entire lumen of the oviduct epithelium (data not shown). Two types of cells, namely, cells with a dome-shaped apical domain and cells with a flat surface, were analyzed by using bright-field microscopy to image living tissue (Fig. 1A). To more precisely classify the cell types during development of the oviduct, we stained with phalloidin and antibodies against acetylated tubulin; by using confocal microscopy, five cell types were identified as follows (Fig. 1): (1) cells without any cilia; (2) cells with a primary cilium; (3) cells with apical cell membrane protrusions; (4) cells with short immature multicilia; and (5) cells with matured long multicilia. The relative numbers of these cell types changed as development progressed, and the number of multiciliated cells increased (6% at P2 to 76% at 11 weeks old). We also found that the apical surface of cells is elongated in shape along the ovary-uterus axis, which will be described later.
To examine the functional significance of multicilia, their movements were analyzed with a high speed charge-coupled device
(CCD) camera (supplementary material Movie 1). Consistent with the morphological observations, the number of cells with beating cilia increased during development. Cells with short motile cilia did not show clear polarity in the direction of the ciliary motion. As the number of cells with longer cilia accumulated, the population of cells with cilia moving directionally along the ovary-uterus axis increased.
Celsr1 protein localization is polarized in oviduct epithelium Because the direction in which the multicilia beat aligned with the ovary-uterus axis, these features might reflect the polarity of each epithelial cell, known as PCP. We examined the expression of PCP factors in adult mouse oviducts by using reverse transcriptase (RT)-PCR and detected the expression ofCelsr1,Celsr2,Vangl1,Vangl2,
Dvl1,Dvl2,Pk2,Pk3,Fz1,Fz2,Fz3,Fz6,Fz8andPtk7(data not shown). We focused onCelsr1in this study.
[image:2.612.48.409.458.735.2]Celsr1 proteins were enriched at circumferential cell-cell boundaries, which are perpendicular to the longitudinal axis of the oviduct (Fig. 2). Multiciliated cells could be distinguished by their strong phalloidin (F-actin) signal at the apical plasma membrane in addition to the cell-cell boundaries (Fig. 2A). Celsr1 was localized to the apical side of the lateral membrane of the epithelial cells, not only in the cell boundaries between multiciliated cells, but also in the cell boundaries between multiciliated cells and non-ciliated cells (Fig. 2B). The cell boundaries between non-ciliated cells had weaker Celsr1 localization. Next, we analyzed the localization of Celsr1 close to the apical surface at several developmental stages (Fig. 2C-E). By using mathematical transformation (Aigouy et al., 2010), we asked in which domain of the cellular outline Celsr1 preferred to localize at the single cell level. Celsr1 was localized in a polarized fashion at all stages from P2 to adult (Fig. 2F). This polarized localization was not evident in the phalloidin signal (Fig. 2G). Vangl2 protein, one of other PCP factors, also showed similar expression and polarized localization (Fig. 3A). These data suggest that the conserved nature of the PCP pathway is functional in the oviduct epithelium.
Fig. 1. Epithelial cell composition during oviduct development.(A,B) The oviduct infundibulum at P2 ( postnatal day 2), P5, P13 and 11 weeks (11 w). (A) The upper panels present snapshot images of beating cilia captured by a high-speed camera. The related time-lapse movies are shown in supplementary material Movie 1. Cells with a dome-shaped apical domain and cells with a flat surface are marked by white and black arrow head, respectively. o, ovary side; u, uterus side. The bottom panels show maximum intensity projection (MIP) images of confocal images of oviduct infundibular epithelium stained with Hoechst (blue; nucleus), an antibody against acetylated α-tubulin (green; cilia) and phalloidin (red; F-actin). The representative cells for each cell type (1-5; corresponding with the right-hand image in B) are marked by arrows. Left, ovary side; right, uterus side. Scale bars: 10μm. (B) The population of cell types observed in the oviduct infundibulum at each stage. Each color corresponds to the cell type shown on the right panel. The number of cells analyzed at each stage are 4677 (P2), 6614 (P5), 3966 (P9), 4406 (P13) and 5070 (11 w), with at least six oviducts analyzed for each stage.
DEVEL
O
TheCelsr1-deficient mouse shows abnormal female reproductive tract formation
To understand the functions of Celsr1, we analyzed the oviducts of homozygous mutant mice that lacked Celsr1 (Ravni et al., 2009). These Celsr1-deficient mice, which have
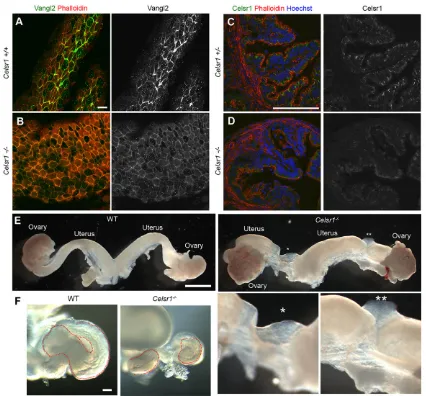
[image:3.612.98.520.55.557.2]a deletion in the genome corresponding to exons 26-29, are reported to have impaired coordination of hairs in the skin (Ravni et al., 2009). In Celsr1 mutant oviducts, clear Celsr1 staining was not detected in the sections (Fig. 3C,D), and Vangl2 signals were weak and uniformly distributed at
Fig. 2. Celsr1 protein localization in oviduct epithelium.(A-E) Confocal microscopy images of oviduct epithelium stained for Celsr1 and with phalloidin. (A,B) The images with a focal plane near the apical membrane (A) and with a focal plane 2μm more basal to the apical membrane (B). Asterisks indicate non-ciliated cells, which were defined by a lack of intense apical surface phalloidin staining. The ovary side is to the left and the uterus side is to the right (A,B). Note that because the oviduct epithelium is not flat and forms folds, a different position in the apical-basal axis of each epithelial cell is captured. (C) Staining for Celsr1 and staining with phalloidin at several developmental stages. (D,E) Higher magnification of single channel images of the area indicated in C showing Celsr1 (D) and phalloidin staining (E). Arrows indicate the axes; L, longitudinal axis (the ovary-uterus axis); C, circumferential axis. (F,G) Distribution and orientation of the Celsr1 (F) and phalloidin signals (G). The angle (0-180°) is determined by using quantitative analysis (see Materials and Methods) for each cell. For example, cells with an angle around the longitudinal axis represent strong localization of Celsr1 at the cell-cell boundaries perpendicular to the longitudinal axis. Note that angles are measured relatively, according to the longitudinal axis (as determined by the angle of the running fold). In the rose diagram, angles are classed into 12 classes (15° for each class) and visualized in a point symmetry manner. The area size of each class indicates the rate of the cell numbers for each stage, and the outer circles indicate the 50% line. The number of cells analyzed for each stage are 630 (P2), 339 (P5), 480 (P9), 170 (P13), 521 (P17) and 614 (11 weeks, 11 w). Scale bars: 10μm in A-E.
RESEARCH ARTICLE Development (2014) 141, 4558-4568 doi:10.1242/dev.115659
DEVEL
O
cell boundaries (Fig. 3B), suggesting that the PCP signaling pathway is compromised.
Abnormalities of the female reproductive tract were found in the mutant mice. We examined 43 Celsr1 mutant female mice at different developmental stages. Of these, 21 animals displayed a gap of the uterus (Fig. 3E). Discontinuities of oviduct were also observed in 12 animals (Fig. 3F). These abnormalities did not always occur on both sides of the same animal. In addition, all of the female mutants were infertile (data not shown).
TheCelsr1-deficient mouse shows abnormal fold formation
in the oviduct
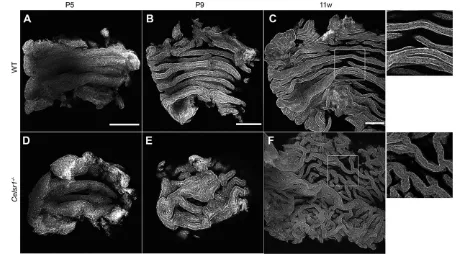
We then examined the lumen of the infundibular region. The morphology of epithelial folds was also disorganized in the mutant oviducts (Fig. 4). The folds formed a straight shape along the longitudinal axis during the later maturation stages, and the folds seldom branched, regardless of their size and depth in the wild-type animals. InCelsr1mutant oviducts, the abnormalities in the shape
of the folds were not evident at P5 (Fig. 4D), but were obvious after P9 (Fig. 4E,F). Although the folds were formed, ectopic and abnormal branches were observed. Folds ran, not in a straight manner, but in a winding way, and were not parallel to the longitudinal axis. Thus, Celsr1 is essential for the alignment of the folds and the suppression of the fold branching.
TheCelsr1-deficient mouse shows abnormal ciliary polarity
in oviducts
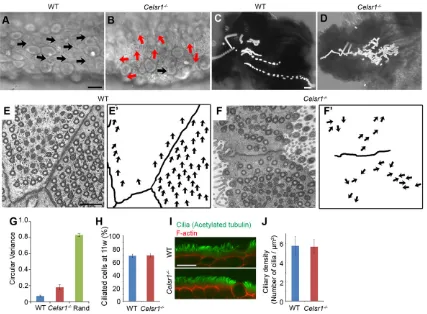
[image:4.612.94.520.55.451.2]Next, we examined the direction of ciliary movement in each cell, as well as the coordination of movement between neighboring cells in the oviduct epithelium. In wild-type adult animals, multicilia in each cell beat in the same direction, and this directional movement was also coordinated among neighboring cells along the longitudinal axis (Fig. 5A; supplementary material Movie 2). We also analyzed the coordination of ciliary movements by applying fluorescently labeled beads onto the surgically opened oviduct. In wild-type specimens, the beads were transported along the longitudinal folds
Fig. 3. Localization of PCP proteins and the morphology of oviducts and uteri in wild-type andCelsr1−/−mice.(A,B) Confocal images of Vangl2 staining in the oviducts of 11-week-old wild-type (Celsr1+/+) (A) andCelsr1−/−(B) mice. (C,D) Cryosections of oviducts from 4-week-oldCelsr1+/−(C) andCelsr1−/−
(D) mice stained with an antibody against Celsr1, phalloidin and Hoechst. The oviducts were sectioned transversely; thus, the folds were also sectioned perpendicular to their longitudinal axes.Celsr1heterozygote mice were considered comparable to the wild-type controls here. (E,F) Examples of the female reproductive tracts of 4-week-old wild-type (WT) andCelsr1−/−mice. The gap regions in theCelsr1−/−uterus are marked by asterisks. Higher magnification views
of these regions are shown in the lower panels on the right. (F) The morphology ofCelsr1−/−and WT oviducts. Dotted lines indicate the oviduct outline. Scale bars: 10μm in A,B; 100μm in C,D,F; 1 mm in E.
DEVEL
O
(Fig. 5; supplementary material Movie 3). The basal feet of beating cilia with 9+2 ultrastructure are known to be oriented in the same direction in a cell (Gibbons, 1961). Accordingly, we found that the oviduct cilia and their basal feet oriented in the same direction, as determined by using transmission electron microscopy (TEM) (Fig. 5E,E′). Quantitative analysis also indicated that the value of circular variance of basal feet orientation in each cell was low (Fig. 5G). Cilia in neighboring cells were also oriented in a similar direction (Fig. 5E,E′).
InCelsr1-deficient mice, the proportion of multiciliated cells was comparable to that observed in wild-type mice (Fig 5H, Fig 6A,B), although the arrangement of ciliated cells and non-ciliated cells appeared to be different (Fig. 6A,B). When ciliary movements were analyzed, a large number of cilia moved in directions that were not parallel to the ovary-uterus axis (Fig. 5B; supplementary material Movie 2). Ciliary movements were coordinated locally, even in the mutant, although this coordination was not maintained over a broader area (e.g. several cells wide). Next, we examined the capability to transport beads in the mutant oviduct (Fig. 5D; supplementary material Movie 4). Beads were certainly moved; however, the bead movements were not coherent in one direction. Some beads moved in a reverse direction, others moved slowly in local swirling patterns. By using TEM analysis, we found that the structure of each mutant cilium was basically the same as that of wild type, but the directionality of the cilia was not well coordinated (Fig. 5F,F′). Some cilia were directed in a similar orientation within a small area in a cell; however, not all cilia were in the same orientation over the entire cell surface. This is also suggested by the quantitative analysis, which showed that, on average, the value of the circular variance of basal feet orientation in each cell was higher than that of the wild type, but still lower compared with the conditions under which all of the basal feet were completely randomly oriented (Fig. 5G). The orientation of cilia in neighboring cells was also not aligned (Fig. 5F,F′). Additionally, we did not find any apparent differences in the length or density of cilia between the two genotypes
(Fig. 5I,J). Thus, Celsr1 is dispensable for ciliogenesis itself but is indispensable for the proper orientation of cilia.
Epithelial cells are elongated along the ovary-uterus axis in a Celsr1-dependent manner
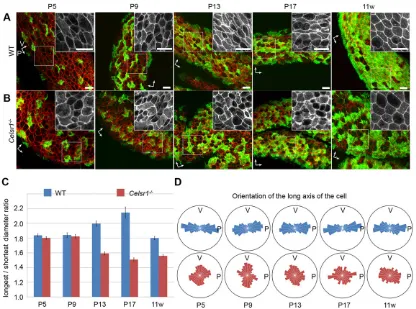
We analyzed the changes in the apical shape of the cells during the postnatal development of the infundibulum (Fig. 6). Phalloidin staining of oviduct that had been opened longitudinally revealed that each apical surface of the cell in wild-type adult mice was elongated along the oviduct fold in shape (Fig. 6A). The average longest to shortest diameter ratio (resembling the aspect ratio) of cell shapes was more than 1.8 at P5 in the wild type (Fig. 6C). Thus, cells were already elongated by P5, and this ratio increased to a maximum at P17. At all stages examined, the orientation of the cellular long axis was distributed in parallel to the oviduct fold (Fig. 6D), suggesting that the cells are elongated along the ovary-uterus axis during postnatal development. Cells during earlier stages, including perinatal stages, were technically difficult to analyze quantitatively. In the mutant oviducts, the shape of the apical surface of cells was less elongated, but was closer to being round in shape, and there was no clear correlation in the angles of cell elongation with the fold orientation (Fig. 6B). These differences in comparison with wild type were even more evident when the cell shapes were quantitatively analyzed. The average longest to shortest diameter ratio was smaller after P13 in the mutant (Fig. 6C). In addition, the distribution of the orientation of the long axis was already different from that of the wild type at P5, and the angles were less correlated with the fold orientation (Fig. 6D). These results suggest that the polarity of cell geometries, i.e. elongation and orientation, are formed depending on the presence ofCelsr1.
The shapes of oviduct epithelial cells are primarily regulated by Celsr1
[image:5.612.74.537.58.312.2]To examine the relationship between the cellular geometry and the fold morphology, we performed mosaic analyses by
Fig. 4. The shape of epithelial folds during oviduct maturation.Luminal side of oviduct infundibulum regions from wild-type (A-C) andCelsr1−/−(D-F) mice in an open-book preparation were stained with phalloidin at P5, P9 and 11 weeks (11 w). MIPs of multiple confocal images are shown. Higher magnification images of regions indicated by the squares in C and F are shown on the right. Left, ovary side; right, uterus side. Scale bars: 100μm.
RESEARCH ARTICLE Development (2014) 141, 4558-4568 doi:10.1242/dev.115659
DEVEL
O
generating chimeric mice with Celsr1−/− or wild-type (as a
control) embryonic stem cells that were tagged by an enhanced green fluorescent protein (EGFP)-labeled histone 2B nuclear marker (Fig. 7). Wild-type clones showed normal cellular geometries (Fig. 7A-D). Large mutant clones (>1000 cells) showed abnormal cellular geometries and ectopic fold branches, as seen in Celsr1 mutants (Fig. 7E-H). Interestingly, smaller mutant clones were found in straight folds, whereas these cells showed a less elongated cellular morphology (Fig. 7K,O), and randomized cellular orientation in some cases (Fig. 7P), compared with the wild-type cells in the same straight epithelial fold. The abnormal cellular geometries in the normal straight epithelial fold, sharing the equivalent environment, suggested that the cellular geometries are intrinsically regulated through Celsr1 and not by extrinsic cues from the surrounding environment. This is also in accordance with the finding that the cellular geometry defects are already present at earlier stages (P5) in the Celsr1 mutant, before the occurrence of the fold abnormality (P9) (Fig. 4, Fig. 6D). These observations provide evidence that cell shape is primarily regulated through the PCP pathway.
DISCUSSION
In this study, we focused on a PCP gene,Celsr1, and found that
Celsr1functions in the orchestration of polarities at multiple levels in the mouse oviduct, i.e. from the subcellular structures to the overall tissue morphology.
[image:6.612.94.521.57.371.2]Because detailed descriptions of mouse oviduct development at the cellular level have been lacking, we initially examined the changes in cellular components during the oviduct maturation. The multicilia were formed only in a small number of cells at P2, and the oviduct lumen was covered by cells that had a rounded surface (Fig. 1A). The coincidence of the increase of the multiciliated cells and the decrease of the rounded surface cells (with and without primary cilium) suggests that these rounded surface cells might differentiate into multiciliated cells. In some cases, it has been suggested that the cells with primary cilia will differentiate into multiciliated cells (Jain et al., 2010). Further lineage analyses are needed to validate this possibility in the oviduct. In quail oviduct ciliogenesis, the basal foot orientation of each cilium is first randomized when the basal bodies dock with apical membrane, and then orchestrated into the same orientation as ciliogenesis proceeds (Boisvieux-Ulrich et al., 1985). Our observations of ciliary
Fig. 5. Direction of ciliary movement and flow in oviducts.Ciliary movement in (A) wild-type (WT) and (B)Celsr1−/−mice at 15-17 weeks of age. Images were taken with a high-speed camera after an open-book preparation (see also supplementary material Movie 2). The arrows indicate the direction of ciliary movement in each cell. (C,D) Time-stack images of fluorescent beads placed on WT (C) and mutant (D) epithelium. Images were taken from time-lapse movies captured at 1.5 s intervals (supplementary material Movies 3, 4). The bead transport assay was performed on four oviducts of females at 18 weeks for each genotype. Left, ovary side; right, uterus side (A-D). (E,F) TEM images of the ciliary basal feet in the oviduct epithelium of WT (E) andCelsr1−/−(F) mice. (E′,F′) The arrows indicate the direction of the basal feet (the angle of protrusion of each circular basal body) for each cilium. Note that we could not capture all the cilia and/or the whole apical surface of the epithelial cells in electron microscopy images due to the fold structure of the epithelium. (G) The circular variance of the basal feet directions in each cell. TEM images that captured 10 or more basal feet in a cell were analyzed.n=48 cells (WT) and 20 cells (Celsr1−/−).‘Rand’ indicates the expected value of circular variance when the direction of each cilium is completely randomized with the same number of cells and cilia as that in
Celsr1−/−. Mean±s.e.m. (H) Percentage of ciliated cells in the epithelium at 11 weeks.n=5 mice each. (I) Confocal images of the oviduct stained with an antibody
against acetylated tubulin, and phalloidin. (J) Ciliary density obtained from TEM images.n=27 cells (WT) and 26 cells (Celsr1−/−). Mean±s.d. Scale bars: 10μm in A,B,I; 100μm in C,D; 1μm in E,F.
DEVEL
O
movement are consistent with the idea that cilia do not have an obvious polarity when the cilia are short and immature.
In theCelsr1-deficient adult oviducts, the movements of multicilia were not unidirectional, and the directional flow from the ovary to the uterus was not established (Fig. 5). As a result, the transportation of ova was also impaired in the cultured longitudinally opened oviduct of these animals (data not shown). Although the cilia did point in a similar direction within small local regions of aCelsr1mutant cell (Fig. 5F-G), the cilia did not face the same direction over the whole cell nor between neighboring cells. These results might suggest that Celsr1 functions to coordinate the ciliary orientation within each cell and the neighboring cells, and other Celsr1-independent factors (e.g. actin and microtubules) regulate the ciliary polarity at the very local level, as suggested previously by Werner and colleagues inXenopus (Werner et al., 2011), although there might be some residual Celsr function in theCelsr1mutant mice.
Changing cell shape is a basic cellular behavior during dynamic tissue morphogenesis (Fristrom, 1988). Various morphogenetic events are known to coincide with cellular shape changes (Condic et al., 1991; Taniguchi et al., 2011; Wang et al., 2012), and a few reports suggest that regulation of apical cell shape is required for proper morphogenesis (Nelson et al., 2012; Taniguchi et al., 2011). Although the correlation between PCP signaling and polarized cellular geometries has been shown to be poor in flies (Aigouy et al., 2010; Bosveld et al., 2012), here we report that the geometric
characteristics of the cellular apical surface are regulated by the PCP pathway in mouse oviduct epithelium. Interestingly, in the mosaic analyses, wild-type cells that were adjacent toCelsr1mutant cells also showed abnormal cellular geometries (Fig. 7K,O). This could be explained by the ability of‘core PCP’proteins to locally alter PCP between neighboring cells (Taylor et al., 1998; Vinson and Adler, 1987), althoughDrosophilaFlamingo has been suggested to act in a cell-autonomous manner in the wing (Usui et al., 1999). The localization of PCP proteins in the wild-type border cells might be disturbed on the membrane that faces the mutant cells because they lack a binding partner, and the function of Celsr1 could be partially affected in the border cells, leading to the observed reduction in elongation. These observations also imply that Celsr1 regulates cell geometries through the PCP pathway. Mechanisms of how the PCP pathway polarizes cell geometries should be elucidated in the future. The abnormal morphology of the uterus is also reported in another PCP gene mutant mouse Vangl2Lpt (Vandenberg and Sassoon, 2009). The uterine epithelium of E18.5Vangl2Lpt/Lptor
Vangl2Lpt/+displays morphological defects, and half ofVangl2Lpt/+
[image:7.612.99.515.56.365.2]adult females show an enlarged and fluid-filled uterus. Although enlarged and fluid-filled uteri were also observed inCelsr1mutants (data not shown), the postnatal oviduct development could not be analyzed in Vangl2Lpt/Lpt mice because of perinatal lethality resulting from neural tube closure defects (Copp et al., 1994; Strong and Hollander, 1949). Therefore, further analyses, such as
Fig. 6. Cellular geometries during development of the oviduct epithelium.(A,B) Oviducts are stained with phalloidin (red) and antibodies against acetylated tubulin (green) for wild-type (WT) (A) andCelsr1−/−(B) mice. Higher magnification views of the phalloidin signal are shown as insets. P and V labeled arrows, indicate parallel and vertical to the fold angle, respectively. Note that‘P’is not always parallel to the longitudinal axis of the oviduct in the case of mutants. Scale bars: 10μm. (C) The mean longest to shortest (longest/shortest) diameter ratio of epithelial cells for each developmental stage is shown. Error bars indicate s.e.m. (D) Distribution of the orientation of the long axis of apical cells. In the rose diagram, angles are classed into 12 classes (15° for each) and visualized in a point symmetry manner. The area of each class indicates the cell numbers for each stage and genotype, and the outer circles indicate the 50% line. The number of cells analyzed at each stage were–P5: 581 WT, 680 mutant; P9: 438 WT, 250 mutant; P13: 292 WT, 277 mutant; P17: 131 WT, 117 mutant; 11 weeks: 456 WT, 501 mutant.
RESEARCH ARTICLE Development (2014) 141, 4558-4568 doi:10.1242/dev.115659
DEVEL
O
those using conditionalVangl2inactivation, are needed in order to establish whether the multilevel polarities observed in the mouse oviduct depend on Vangl2. In addition, in spite of the uterine epithelial abnormalities reported inVangl2Lpt/+ (Vandenberg and Sassoon, 2009), the polarized localization of Celsr1, the ciliary motion polarity and the epithelial fold polarity in adultVangl2Lpt/+ female oviducts were apparently the same as those of wild type (data not shown), suggesting that the PCP pathway might still be functional inVangl2Lpt/+.
It is also known that the PCP pathway is one of the regulators of three-dimensional morphology in other systems (Nishimura et al., 2012). How are these tissue morphologies regulated through the
[image:8.612.91.523.56.506.2]function of the PCP pathway? The alignment of muscle fibers surrounding the oviduct also could affect the morphology of folds. Recently, it has been reported that the formation of villi in the gut epithelium is regulated by the direction of muscle fibers surrounding the epithelium (Shyer et al., 2013). However, we concluded that this is not the case for the misoriented formation of folds in theCelsr1 mutant oviduct, because, Celsr1 is dominantly expressed in the epithelium and not in the muscle layer (Fig. 3C), and our mosaic analysis showed that Celsr1 mutant clones in mesenchymal or muscle layers did not affect the morphology of the epithelium (data not shown). These data suggest that the epithelial fold morphology is regulated by oviduct epithelium that expresses Celsr1.
Fig. 7. Mosaic analyses with wild-type cells andCelsr1−/−mutant cells.(A-P) Mosaic analysis of wild-type cells (A-D) andCelsr1−/−cells (E-P) in wild-type oviduct. The left two columns show the MIP of confocal images of phalloidin-stained oviduct epithelium of 3-week-old chimeric mice (red in A,E,I,M and white in B,F,J,N). Wild-type cells orCelsr1−/−mutant clone cells were identified by using histone 2B-EGFP (green signals in A,E,I,M). Note that although there were
also EGFP signals in mesenchymal cells, we marked only epithelial clones with red (B,F,J,N), and the selected clones of epithelial cells were used for further analyses. The two columns on the right show cellular geometrical analyses. The longest to shortest (longest/shortest) diameter ratio (C,G,K,O) and the angle of long axis (major angle) relative to the fold (D,H,L,P) of each cell are shown in color code. The boundaries of the mutant cells analyzed are indicated by a white or black line. We observed more than 200 clones of various sizes in 48 images from six 3-week-old mutant chimeric oviducts, and more than 100 clones in 30 images from eight 3-week-old wild-type chimeric oviducts. Scale bars: 50μm.
DEVEL
O
Nevertheless, mechanical tensions might be one of the unknown factors connecting the shape and the condition of each cell to the morphology of the epithelial sheet.
Cell proliferation is also a candidate factor in the regulation of epithelial morphology. However, we could not detect significant differences in the rate of bromodeoxyuridine (BrdU; an analog of thymidine) incorporation and in the localization of BrdU-positive cells between wild-type and Celsr1 mutant oviduct at P5 (supplementary material Fig. S1A; data not shown). The orientation of cell division is also one of the important regulatory factors for tissue morphology (Yu et al., 2009), but the epithelial cell division angles relative to the fold in theCelsr1−/− mutant were not significantly different from those of wild type at P5 during 24 h of tissue culture time-lapse imaging (supplementary material Fig. S1B). Thus, it is suggested that cell division is not the major factor regulated by Celsr1 to control the epithelial morphology of the oviduct.
Our analyses show newly identified functions of PCP genes, which regulate cell polarity and tissue morphology at multiple levels of the oviduct structure. The functions of PCP pathways in the polarization of cells are still unknown. The mechanism connecting cell polarities and three-dimensional tissue morphologies should be elucidated in the future.
MATERIALS AND METHODS
Animals
Female mice (Slc; ICR, Japan SLC) were used for analyses of developmental processes (Figs 1, 2; supplementary material Movie 1).
Celsr1 mutant mice (Ravni et al., 2009) and R26-H2B-EGFP mice
(Kurotaki et al., 2007) have been described previously.Vangl2Lptmice were
obtained from The Jackson Laboratory (LPT/LeJ 000220). Animal care and experiments were conducted in accordance with National Institutes of Natural Sciences, Animal Experiment Rules the Guidelines of Animal Experimentation. The experiments employed in this study were approved by The Institutional Animal Care and Use Committee of National Institutes of Natural Sciences. The animals were kept in a light and temperature-controlled room with a 12 h light:dark cycle at 22±1°C.
ForCelsr1mutant mice, the primers used to detect the knockout allele
were: forward primer 612 (5′-GAAAGAGACTGTTGGTGAGC-3′) and
reverse primer 615 (5′-CTCTGTTGACTTCTGACTGG-3′), yielding a
PCR product of 592 bp. The primers for the wild-type allele were: forward
primer 612 and reverse primer 613 (5′-CCACTCTGCTAACGGTAGG-3′),
yielding a PCR product of 389 bp. For R26-H2B-EGFP knock-in mice, the primers used to detect the R26-H2B-EGFP allele were: forward primer
Phil1 (5′-AAAGTCGCTCTGAGTTGTTAT-3′) and reverse primer pA1
(5′-AAGGGGGAGGATTGGGAAGACA-3′), yielding a PCR product of
497 bp. The primers for the wild-type allele were: forward primer Phil1 and
reverse primer Phil3 (5′-GGAGCGGGAGAAATGGATATG-3′), yielding
a PCR product of 607 bp. LATaq or MightyAmp (TaKaRa) were used for the genotyping PCR experiments.
RT-PCR
The oviducts were separated into three parts, the infundibulum, the ampulla and the isthmus. Total RNA was extracted from each part using an RNeasy Mini Kit (Qiagen), and then cDNA was synthesized using a SuperScript II First-Strand Synthesis System (Invitrogen). To check the expression of PCP genes in the oviduct, PCR analyses were performed using Platinum Taq DNA Polymerase (Invitrogen). The amplification conditions were as follows: denaturation at 94°C for 5 min, 35 cycles of 95°C denaturation for 20 s, 61°C annealing for 30 s and 72°C extension for 30 s. The primer pairs and the product size for each PCP gene are shown in supplementary material Table S1.
Immunohistochemistry
Antibodies against Celsr1 (dilution 1:100) were gifts from Elaine Fuchs and generated as previously described (Devenport and Fuchs, 2008). Anti-Vangl2
antibodies (1:500) were gifts from Mireille Montcouquiol (Montcouquiol
et al., 2006). The following reagents were purchased: anti-acetylated α
tubulin (1:500; Sigma-Aldrich, no. T7451), Alexa Fluor-conjugated secondary antibodies (1:500; Molecular Probes), Texas Red-X phalloidin (1:100; Molecular Probes, no. T7471) and Hoechst 33258 (1:1,000,000; Molecular Probes). The fluorescent images were taken using a Nikon A1 confocal microscope (Nikon) and FV-1000 confocal microscope (Olympus). Oviducts were dissected, opened longitudinally and fixed overnight with 4%
paraformaldehyde (PFA) in Ca2+, Mg2+-free PBS at 4°C. After treatment with
0.1% Triton X-100 in PBS, samples were blocked with Blocking One (Nacalai Tesque) at room temperature and incubated with primary antibodies in Blocking One at 4°C overnight. After washes with 0.1% Triton X-100 in PBS, the samples were incubated with fluorescently labeled secondary antibodies at room temperature for 1 h. After washes, the oviducts were mounted with their apical side up in Fluoromount G (SouthernBiotech).
To produce tissue sections, the oviducts were embedded in Optimal Cutting Temperature (OCT) compound (Sakura Finetek), frozen in liquid nitrogen and sectioned (8 µm) on a cryostat (OTF-5000; Bright Instrument). The cryosections were fixed with 4% PFA for 20 min at room temperature and stained using the same procedure described above for whole-mount preparations.
Quantification of the polarity of Celsr1 or phalloidin distribution within cell contours
The principle of the image analysis method for quantification of the polarity of staining signals within cell contours has been previously described (Aigouy et al., 2010). Maximum intensity projection (MIP) images of three
serial single-channel confocal images (0.3μm thick) around the apical
surface were created. The cell boundary was traced manually according to
the phalloidin image, and thex,ycoordinates of each cellular contour were
recorded. The staining intensities (Celsr1 or phalloidin) of the pixels in the
contour were collected asI(x,y).I(x,y) was transformed intoI(r,θ), wherer
is the distance between the pixel and the center of the cell andθis the angle
indicating the position of the pixel, with the fold direction set toθ=0°. Then,
we calculated the average value ofI(r,θ) for eachθsection with a 5° range
(e.g. 2.5°-7.5°, 7.5°-12.5°, etc.). The average value was set toS(θm), where
θmis the centerθvalue of the section (e.g.θm=5°, 10°, etc.). The polarity of
the staining signals ϕ(0°≤ϕ<180°) was determined for each cell to fit:
cos 2f¼Q1=
ffiffiffiffiffiffiffiffiffiffiffiffiffiffiffiffiffi
Q2 1þQ22 p
;sin 2f¼Q2=
ffiffiffiffiffiffiffiffiffiffiffiffiffiffiffiffiffiffi
Q2 1þQ22; p
where Q1=Σ S(θm)
cos2θm, Q2=Σ S(θm)sin2θm. Processing was performed in ImageJ and
Excel, and rose diagrams were drawn by using R.
Observations of ciliary movements
The infundibular oviduct region was isolated and longitudinally opened. A piece of adhesive tape in the form of a ring was put on a glass slide to make a well, and opened oviducts were put into the well that had been filled with PBS. After covering with a coverslip, movies were quickly acquired at 200 frames/s for 2.5 s using an upright microscope (BX70; Olympus) with a digital high-speed CCD camera (HAS-220; Ditect) and a ×40 objective.
Bead transport assay
Green fluorescent beads (FluoSpheres Polystyrene Microspheres, 15μm;
Invitrogen, no. F21010) were applied to longitudinally opened oviducts in PBS, and images were captured by using a CCD camera (DP72; Olympus) with a stereomicroscope (MZFLIII; Leica).
Electron microscopy
For transmission electron microscopy, oviducts were fixed in 2% glutaraldehyde and 2% PFA in 0.1 M phosphate buffer ( pH 7.4). Tissues
were treated with 2% OsO4in the same buffer. Fixed specimens were
washed and dehydrated in a graded ethanol series, and reconstituted in propyleneoxide. Samples were pre-impregnated with a propyleneoxide: epon (Quetol 812) mixture, and impregnated with epon (Quetol 812). Then, samples were mounted into epon (Quetol 812) blocks for 48 h at 60°C to ensure polymerization. Ultrathin sections (80-90 nm) were cut using an ultramicrotome (ULTRACUT-UCT; Leica), stained with 2%
uranyl acetate for 15 min and then with modified Sato’s lead solution for
RESEARCH ARTICLE Development (2014) 141, 4558-4568 doi:10.1242/dev.115659
DEVEL
O
5 min. Sections were analyzed using a transmission electron microscope (JEM-1200EX; Jeol).
Quantification of basal feet orientation
Circular varianceS2(Zar, 2010) of the basal feet orientation of each cell was
calculated as:
S2¼1
ffiffiffiffiffiffiffiffiffiffiffiffiffiffiffiffiffiffiffiffiffiffiffiffiffiffiffiffiffiffiffiffiffiffiffiffiffiffiffiffiffiffiffiffiffiffiP cosu
n
2
þ Psinu
n
2
; s
whereθis the angle of orientation of each cilium,nis the number of cilia in
the cell. When we calculatedS2using the assumption that basal feet are
randomly oriented for comparison, the number of cells and the number of cilia in each cell were set to be the same as that used for the analysis of Celsr1−/−.
Quantification of cellular morphology
The apical cellular contours of phalloidin staining in confocal images were
traced manually. The longest and shortest diameter ratio (the ratio of Feret’s
diameter to MiniFeret in ImageJ) and the orientation of the long axis (major angle in Fit Ellipse in ImageJ) were calculated for each cell. The value of the orientation angle was adjusted so that the angle of fold was 0°. Rose diagrams were drawn by using R.
Mosaic analysis
Celsr1+/−mice were crossed withCelsr1+/−; homozygous R26-H2B-EGFP
mice, and embryonic stem (ES) cell lines were established from the blastocysts, using a modified version of a previously described protocol (Kiyonari et al., 2010; Nichols et al., 2009; Ying et al., 2008). Briefly, embryos at E3.5 were cultured in 2i medium [ESGRO complete basal
medium (Millipore) supplemented with 0.4μM PD0325901 (Cayman
Chemical), 3μM CHIR99021 (Wako) and 1000 units/ml leukocyte
inhibitory factor (LIF; Millipore)], on mouse embryonic fibroblast (MEF) feeder cells (ReproCELL). After 4-7 days, we trypsinized the clumps and replated them into new wells. For genotyping, ES cells were cultured
without feeder cells, and then genomic DNA was extracted. Celsr1
genotyping was performed by using LATaq or MightyAmp as described above. The sex of each clone was determined by using PCR for the Y
chromosome-specificSrygene [ primers: Sry-M5 (5′
-GTGGTGAGAGG-CACAAGTTGGC-3′) and Sry-M3 (5′
-CTGTGTAGGATCTTCAATC-TCT-3′) (Kusaka et al., 2010)].Celsr1−/−orCelsr1+/+; Srynegative ES
cell lines were used for generation of the chimera to avoid the cells with Y chromosome in the female chimera.
The chimera was generated by using a standard protocol (Behringer et al., 2014). We injected 5-15 trypsinized ES cells into each Jcl:MCH(ICR) blastocyst and then transferred the blastocysts to the uterus of a 2.5-day pseudopregnant ICR female mouse.
BrdU incorporation assay
BrdU was injected intraperitoneally at 50μg/g of body weight into P5 mice.
Three hours later, oviducts were fixed in 4% PFA and embedded in paraffin. After blocking the endogenous peroxidase activity by using 0.6% hydrogen
peroxide in methanol at room temperature for 40 minutes, 5 μm thick
sections were obtained from the samples. Sections were incubated with anti-BrdU antibodies (1:500; Sigma-Aldrich, no. B2531) and stained by using the immunoperoxidase method using the VECTASTAIN ABC Kit (Vector Laboratories) according to a standard protocol. Sections were also stained with SIGMAFAST diaminobenzidine with Metal Enhancer tablet (Sigma-Aldrich, no. D0426). The number of BrdU-positive cells and the total cells in the epithelium were counted for multiple sections for each oviduct.
Cell division angle analysis
The oviducts ofCelsr1+/+or Celsr1–/–mice homozygous for
R26-H2B-EGFPwere longitudinally opened and placed in a glass-bottomed culture
dish (MatTek, no. P35G-1.5-10-C). The epithelium of the opened oviducts
was set to face the coverslip. The oviducts were cultured in 37°C, 5% CO2
for 24 h in Dulbecco’s Modified Eagle’s Medium with Nutrient Mixture
F-12 containing 10% serum. For the time-lapse imaging of nuclear H2B-EGFP signal, an electron multiplying CCD camera (Cascade II, Photometrics) in combination with a spinning disc laser scan system (CSU10, Yokogawa) using a 488 nm diode laser driven by imaging software (Openlab, Improvision) was used as described previously (Kurotaki et al.,
2007). Images of 2μm interval optical sections were captured at 10 min
intervals.
Acknowledgements
We thank E. Fuchs for the anti-Celsr1 antibody and the plasmid of the antigen; M. Montcouquiol for the anti-Vangl2 antibody; H. Takase for TEM technical support; and H. Sasaki for suggestions. We thank Spectrography and Bioimaging Facility, National Institute for Basic Biology (NIBB) Core Research Facilities for technical support.
Competing interests
The authors declare no competing financial interests.
Author contributions
D.S., K.K., H.K., T.U. and T.F. designed the study and wrote the manuscript. D.S. and K.K. performed most of the experiments and analyses. F.T. and A.M.G. generatedCelsr1mutant mice. M.H. helped with cellular geometrical analyses. Y.T. provided technical assistance for ES cell experiments. T.F. performed blastocyst injections and supervised the project with T.U.
Funding
This work was supported by a Centers of Research Excellence in Science (CREST) grant and a Ministry of Education, Culture, Sports, Science and Technology (MEXT) grant (Kakenhi) to T.U. and T.F.; a grant of The Mitsubishi Foundation to T.U.; and a grant from the National Institute for Basic Biology to T.F. D.S. was a Research Fellow of the Japan Society for the Promotion of Science (JSPS).
Supplementary material
Supplementary material available online at
http://dev.biologists.org/lookup/suppl/doi:10.1242/dev.115659/-/DC1
References
Adler, P. N. (2012). The frizzled/stan pathway and planar cell polarity in the Drosophila wing.Curr. Top. Dev. Biol.101, 1-31.
Agduhr, E.(1927). Studies on the structure and development of the bursa ovarica and the tuba uterina in the mouse.Acta Zool.8, 1-133.
Aigouy, B., Farhadifar, R., Staple, D. B., Sagner, A., Röper, J.-C., Jülicher, F. and Eaton, S.(2010). Cell flow reorients the axis of planar polarity in the wing epithelium of Drosophila.Cell142, 773-786.
Antic, D., Stubbs, J. L., Suyama, K., Kintner, C., Scott, M. P. and Axelrod, J. D. (2010). Planar cell polarity enables posterior localization of nodal cilia and left-right axis determination during mouse and Xenopus embryogenesis.PLoS ONE
5, e8999.
Bakst, M. R.(1998). Structure of the avian oviduct with emphasis on sperm storage in poultry.J. Exp. Zool.282, 618-626.
Behringer, R., Gertsenstein, M., Vintersten Nagy, K. and Nagy, A. (2014).
Manipulating the Mouse Embryo, 4th edn. Cold Spring Harbor, NY: Cold Spring
Harbor Laboratory Press.
Boisvieux-Ulrich, E., Laine, M. C. and Sandoz, D.(1985). The orientation of ciliary basal bodies in quail oviduct is related to the ciliary beating cycle commencement.
Biol. Cell55, 147-150.
Borovina, A., Superina, S., Voskas, D. and Ciruna, B.(2010). Vangl2 directs the posterior tilting and asymmetric localization of motile primary cilia.Nat. Cell Biol.
12, 407-412.
Bosveld, F., Bonnet, I., Guirao, B., Tlili, S., Wang, Z., Petitalot, A., Marchand, R., Bardet, P.-L., Marcq, P., Graner, F. et al. (2012). Mechanical control of morphogenesis by Fat/Dachsous/Four-jointed planar cell polarity pathway.
Science336, 724-727.
Chae, J., Kim, M. J., Goo, J. H., Collier, S., Gubb, D., Charlton, J., Adler, P. N. and Park, W. J.(1999). The Drosophila tissue polarity gene starry night encodes a member of the protocadherin family.Development126, 5421-5429.
Condic, M. L., Fristrom, D. and Fristrom, J. W.(1991). Apical cell shape changes during Drosophila imaginal leg disc elongation: a novel morphogenetic mechanism.Development111, 23-33.
Copp, A. J., Checiu, I. and Henson, J. N.(1994). Developmental basis of severe neural tube defects in the loop-tail (Lp) mutant mouse: use of microsatellite DNA markers to identify embryonic genotype.Dev. Biol.165, 20-29.
Curtin, J. A., Quint, E., Tsipouri, V., Arkell, R. M., Cattanach, B., Copp, A. J., Henderson, D. J., Spurr, N., Stanier, P., Fisher, E. M. et al.(2003). Mutation of
DEVEL
O
Celsr1 disrupts planar polarity of inner ear hair cells and causes severe neural tube defects in the mouse.Curr. Biol.13, 1129-1133.
Devenport, D. and Fuchs, E.(2008). Planar polarization in embryonic epidermis orchestrates global asymmetric morphogenesis of hair follicles.Nat. Cell Biol.10, 1257-1268.
Formstone, C. J. and Little, P. F. R.(2001). The flamingo-related mouse Celsr family (Celsr1-3) genes exhibit distinct patterns of expression during embryonic development.Mech. Dev.109, 91-94.
Fristrom, D.(1988). The cellular basis of epithelial morphogenesis.Tissue Cell20, 645-690.
Gibbons, I. R.(1961). The relationship between the fine structure and direction of beat in gill cilia of a lamellibranch mollusc. J. Biophys. Biochem. Cytol.11, 179-205.
Goodrich, L. V. and Strutt, D.(2011). Principles of planar polarity in animal development.Development138, 1877-1892.
Guirao, B., Meunier, A., Mortaud, S., Aguilar, A., Corsi, J.-M., Strehl, L., Hirota, Y., Desoeuvre, A., Boutin, C., Han, Y.-G. et al. (2010). Coupling between hydrodynamic forces and planar cell polarity orients mammalian motile cilia.Nat. Cell Biol.12, 341-350.
Hadjantonakis, A.-K., Sheward, W. J., Harmar, A. J., de Galan, L., Hoovers, J. M. N. and Little, P. F. R.(1997). Celsr1, a neural-specific gene encoding an unusual seven-pass transmembrane receptor, maps to mouse chromosome 15 and human chromosome 22qter.Genomics45, 97-104.
Halbert, S. A., Tam, P. Y. and Blandau, R. J.(1996). Egg transport in the rabbit oviduct: the roles of cilia and muscle.Science191, 1052-1053.
Halbert, S. A., Becker, D. R. and Szal, S. E.(1989). Ovum transport in the rat oviductal ampulla in the absence of muscle contractility. Biol. Reprod. 40, 1131-1136.
Hashimoto, M., Shinohara, K., Wang, J., Ikeuchi, S., Yoshiba, S., Meno, C., Nonaka, S., Takada, S., Hatta, K., Wynshaw-Boris, A. et al.(2010). Planar polarization of node cells determines the rotational axis of node cilia.Nat. Cell Biol.
12, 170-176.
Hirota, Y., Meunier, A., Huang, S., Shimozawa, T., Yamada, O., Kida, Y. S., Inoue, M., Ito, T., Kato, H., Sakaguchi, M. et al.(2010). Planar polarity of multiciliated ependymal cells involves the anterior migration of basal bodies regulated by non-muscle myosin II.Development137, 3037-3046.
Jain, R., Pan, J., Driscoll, J. A., Wisner, J. W., Huang, T., Gunsten, S. P., You, Y. and Brody, S. L.(2010). Temporal relationship between primary and motile ciliogenesis in airway epithelial cells.Am. J. Respir. Cell Mol. Biol.43, 731-739. Kiyonari, H., Kaneko, M., Abe, S. and Aizawa, S.(2010). Three inhibitors of FGF
receptor, ERK, and GSK3 establishes germline-competent embryonic stem cells of C57BL/6N mouse strain with high efficiency and stability.Genesis48, 317-327. Kurotaki, Y., Hatta, K., Nakao, K., Nabeshima, Y.-i. and Fujimori, T.(2007). Blastocyst axis is specified independently of early cell lineage but aligns with the ZP shape.Science316, 719-723.
Kusaka, M., Katoh-Fukui, Y., Ogawa, H., Miyabayashi, K., Baba, T., Shima, Y., Sugiyama, N., Sugimoto, Y., Okuno, Y., Kodama, R. et al.(2010). Abnormal epithelial cell polarity and ectopic epidermal growth factor receptor (EGFR) expression induced in Emx2 KO embryonic gonads. Endocrinology 151, 5893-5904.
May-Simera, H. L., Kai, M., Hernandez, V., Osborn, D. P. S., Tada, M. and Beales, P. L.(2010). Bbs8, together with the planar cell polarity protein Vangl2, is required to establish left-right asymmetry in zebrafish.Dev. Biol.345, 215-225. Mitchell, B., Stubbs, J. L., Huisman, F., Taborek, P., Yu, C. and Kintner, C.
(2009). The PCP pathway instructs the planar orientation of ciliated cells in the Xenopus larval skin.Curr. Biol.19, 924-929.
Montcouquiol, M., Sans, N., Huss, D., Kach, J., Dickman, J. D., Forge, A., Rachel, R. A., Copeland, N. G., Jenkins, N. A., Bogani, D. et al.(2006). Asymmetric localization of Vangl2 and Fz3 indicate novel mechanisms for planar cell polarity in mammals.J. Neurosci.26, 5265-5275.
Nelson, K. S., Khan, Z., Molnár, I., Mihály, J., Kaschube, M. and Beitel, G. J. (2012). Drosophila Src regulates anisotropic apical surface growth to control epithelial tube size.Nat. Cell Biol.14, 518-525.
Nichols, J., Jones, K., Phillips, J. M., Newland, S. A., Roode, M., Mansfield, W., Smith, A. and Cooke, A.(2009). Validated germline-competent embryonic stem cell lines from nonobese diabetic mice.Nat. Med.15, 814-818.
Nishimura, T., Honda, H. and Takeichi, M.(2012). Planar cell polarity links axes of spatial dynamics in neural-tube closure.Cell149, 1084-1097.
Park, T. J., Mitchell, B. J., Abitua, P. B., Kintner, C. and Wallingford, J. B.(2008). Dishevelled controls apical docking and planar polarization of basal bodies in ciliated epithelial cells.Nat. Genet.40, 871-879.
Ravni, A., Qu, Y., Goffinet, A. M. and Tissir, F.(2009). Planar cell polarity cadherin Celsr1 regulates skin hair patterning in the mouse.J. Invest. Dermatol.129, 2507-2509.
Shi, D., Komatsu, K., Uemura, T. and Fujimori, T.(2011). Analysis of ciliary beat frequency and ovum transport ability in the mouse oviduct.Genes Cells16, 282-290.
Shyer, A. E., Tallinen, T., Nerurkar, N. L., Wei, Z., Gil, E. S., Kaplan, D. L., Tabin, C. J. and Mahadevan, L.(2013). Villification: how the gut gets its villi.Science
342, 212-218.
Song, H., Hu, J., Chen, W., Elliott, G., Andre, P., Gao, B. and Yang, Y.(2010). Planar cell polarity breaks bilateral symmetry by controlling ciliary positioning.
Nature466, 378-382.
Stewart, C. A. and Behringer, R. R.(2012). Mouse oviduct development.Results Probl. Cell Differ.55, 247-262.
Strong, L. C. and Hollander, W. F.(1949). Hereditary loop-tail in the house mouse: accompanied by imperforate vagina and with lethal craniorachischisis when homozygous.J. Hered.40, 329-334.
Taniguchi, K., Maeda, R., Ando, T., Okumura, T., Nakazawa, N., Hatori, R., Nakamura, M., Hozumi, S., Fujiwara, H. and Matsuno, K.(2011). Chirality in planar cell shape contributes to left-right asymmetric epithelial morphogenesis.
Science333, 339-341.
Taylor, J., Abramova, N., Charlton, J. and Adler, P. N.(1998). Van Gogh: a new Drosophila tissue polarity gene.Genetics150, 199-210.
Tissir, F., Qu, Y., Montcouquiol, M., Zhou, L., Komatsu, K., Shi, D., Fujimori, T., Labeau, J., Tyteca, D., Courtoy, P. et al.(2010). Lack of cadherins Celsr2 and Celsr3 impairs ependymal ciliogenesis, leading to fatal hydrocephalus.Nat. Neurosci.13, 700-707.
Usui, T., Shima, Y., Shimada, Y., Hirano, S., Burgess, R. W., Schwarz, T. L., Takeichi, M. and Uemura, T.(1999). Flamingo, a seven-pass transmembrane cadherin, regulates planar cell polarity under the control of frizzled.Cell98, 585-595.
Vandenberg, A. L. and Sassoon, D. A. (2009). Non-canonical Wnt signaling regulates cell polarity in female reproductive tract development via van gogh-like
2.Development136, 1559-1570.
Vinson, C. R. and Adler, P. N.(1987). Directional non-cell autonomy and the transmission of polarity information by the frizzled gene of Drosophila.Nature329, 549-551.
Vladar, E. K., Bayly, R. D., Sangoram, A. M., Scott, M. P. and Axelrod, J. D. (2012). Microtubules enable the planar cell polarity of airway cilia.Curr. Biol.22, 2203-2212.
Wake, M. H. and Dickie, R.(1998). Oviduct structure and function and reproductive modes in amphibians.J. Exp. Zool.282, 477-506.
Wang, Y. and Nathans, J.(2007). Tissue/planar cell polarity in vertebrates: new insights and new questions.Development134, 647-658.
Wang, Y.-C., Khan, Z., Kaschube, M. and Wieschaus, E. F.(2012). Differential positioning of adherens junctions is associated with initiation of epithelial folding.
Nature484, 390-393.
Werner, M. E., Hwang, P., Huisman, F., Taborek, P., Yu, C. C. and Mitchell, B. J. (2011). Actin and microtubules drive differential aspects of planar cell polarity in multiciliated cells.J. Cell Biol.195, 19-26.
Yamanouchi, H., Umezu, T. and Tomooka, Y.(2010). Reconstruction of oviduct and demonstration of epithelial fate determination in mice.Biol. Reprod.82, 528-533. Ying, Q.-L., Wray, J., Nichols, J., Batlle-Morera, L., Doble, B., Woodgett, J.,
Cohen, P. and Smith, A.(2008). The ground state of embryonic stem cell self-renewal.Nature453, 519-523.
Yu, J., Carroll, T. J., Rajagopal, J., Kobayashi, A., Ren, Q. and McMahon, A. P. (2009). A Wnt7b-dependent pathway regulates the orientation of epithelial cell division and establishes the cortico-medullary axis of the mammalian kidney.
Development136, 161-171.
Zar, J. H.(2010).Biostatistical Analysis, 5th edn. London: Pearson Education International.
RESEARCH ARTICLE Development (2014) 141, 4558-4568 doi:10.1242/dev.115659