BIROn - Birkbeck Institutional Research Online
Sutcliffe, A. and Soo, A. and Barnes, Jacqueline (2010) Predictive value of
developmental testing in the second year for cognitive development at five
years of age. Pediatric Reports 2 (2), pp. 48-50. ISSN 2036-7503.
Downloaded from:
Usage Guidelines:
Please refer to usage guidelines at
or alternatively
BIROn
-
B
irkbeck
I
nstitutional
R
esearch
On
line
Enabling open access to Birkbeck’s published research output
Predictive value of developmental testing in the second
year for cognitive development at five years of age
Journal Article
http://eprints.bbk.ac.uk/3034
Version: Publisher draft (refereed)
Citation:
© 2010 The Authors
Publisher version
______________________________________________________________
All articles available through Birkbeck ePrints are protected by intellectual property law, including copyright law. Any use made of the contents should comply with the relevant law.
______________________________________________________________
Deposit Guide
Contact: [email protected]
Birkbeck ePrints
Birkbeck ePrints
Sutcliffe, A.; Soo, A.; Barnes, J. (2009) Predictive value of
[page 48] [Pediatric Reports 2010; 2:e15]
Predictive value
of developmental testing
in the second year for cognitive
development at five
years of age
Alastair G. Sutcliffe,1Audrey Soo,1
Jacqueline Barnes2
1General and Adolescent Paediatrics Unit,
Institute of Child Health, University College London, UK
2Institute for the Study of Children,
Families and Social Issues, Birkbeck, University of London, UK
Abstract
There is mixed evidence about the predic-tive validity of the Griffiths mental develop-mental scales. This study aimed to assess the predictive value of developmental assess-ments of children in their second year using the Griffiths mental development scales for neuro-developmental status at five years using the Wechsler preschool and primary scale of intelligence, revised (WPPSI-R). In a longitudinal study 253 children were assessed in their second year of life using the Griffiths scales and again at five years using the WPPSI-R. The scores were compared and the predictability of the WPPSI-R outcome on the basis of Griffiths scores was assessed. The WPPSI-R full scale IQ and the performance IQ at age five could be predicted moderately by the Griffiths general quotient (GQ) and by the personal/social scale. The Griffiths GQ was not a significant predictor of verbal IQ at age 5. The Griffiths performance scale predicted sub-sequent WPPSI-R performance IQ, and mar-ginally the Full Scale IQ. For the early identifi-cation of children at risk for language delay, the Griffiths scales may not be suitable. However, a shortened form would be useful to predict overall cognitive development from the second year to school entry, focussing on the personal-social and performance scales.
Introduction
It has been known for some time that although the commonly used developmental scales for infants (Bayley mental developmen-tal scales1and the Griffiths scales2) have some
ability to predict skills at a later age, they are not as sensitive as developmental assess-ments used when children are 5 years or above. This is mainly because of the lack of
verbal skills range possessed by toddlers pared to older children, which limits the com-parability of the tasks in assessments at the two ages.
Little research has been done to show the predictability of either of the developmental systems. Studies previously done tended to use small numbers of children,3use children
who have specific characteristics such as being very premature or having conditions that may affect their development in an unrecognised manner and which could skew the results of the predictability.4-6
Some previous studies compared Bayley scales of infant development scores and sub-sequent WPPSI-R scores. A search of the med-ical literature revealed only one study, per-formed in 1977, which compared the Bayley and the Griffiths scales. The sample was small (50) and the infants were from a neonatal fol-low-up clinic and therefore high-risk for delay in cognitive development. Nevertheless, the potential of the Griffiths scale was suggested by the strong association found between the Griffiths and the Bayley tests.7
This study, designed to investigate the development over time of children conceived by assisted reproductive technology (ART)8is
also one of the largest to be able to investigate the predictability of neuro-developmental scores in the second year for development in the fifth year of life. The longitudinal study used the Griffiths mental development scales to assess a cohort of children at a mean age of 17 months. These children were reassessed at 54 months of age.9The Griffiths mental
devel-opment scales have been examined to estab-lish the extent to which they accurately pre-dict children’s neuro-developmental progress at 54 months of age using the Wechsler pre-school and primary scale of intelligence, Revised (WPPSI-RUK).10
The children were either naturally con-ceived, or from intracytoplasmic sperm injec-tion (ICSI), a type of in vitrofertilisation, but for the purposes of this paper nature of con-ception is not considered. This report describes the extent to which the earlier cog-nitive measure can predict subsequent devel-opment.
Materials and Methods
Procedure
At the original assessment8and at
follow-up,9 the children were assessed by a single
researcher. In their second year (mean age 17.3 months) all children were assessed by a paediatrician. At the second evaluation (mean age 5.0 years) a trained psychologist assessed the children, unaware of their mode of con-ception and blind to previous test scores. The
first language of all of the children was English. They were Caucasian, born at term, singleton and with normal birth-weight. Measurements at the two time points were available for 253 children: 165 ICSI conceived children (65.2%) and 88 naturally conceived children (34.7%). The sex distribution between the two groups was similar (female 113, male 140). Further details of the original cohort8 and the follow-up group9 have been
previously described.
Measures
The Griffiths mental development scales2
uses a simple ratio transformation, dividing the mental age by chronological age yielding slightly different means and standard devia-tions for the total index and the scale scores. It yields a general cognitive quotient (GQ, mean 100.2, s.d. 12.8) and at the 1-2 year age has 5 sub-scales: hearing and speech (mean 99.8, s.d. 17.8); hand and eye coordination (mean 100.5, s.d. 15.6); personal-social devel-opment (mean 100.3, s.d. 16.2); locomotor development (mean 100.4, s.d. 16.3); perform-ance tests (mean 99.8, s.d. 17.2).
The WPPSI-R10 provides a full scale IQ
(mean 100, s.d.15) derived from 10 sub-test scores, grouped into verbal (5 tests) and formance (5 tests) and both verbal and per-formance IQ scores (mean 100, s.d. 10).
Analysis
Linear regressions were calculated
predict-Pediatric Reports 2010; volume 2:e15
Correspondence: Alastair G. Sutcliffe, General and Adolescent Paediatrics Unit, Institute of Child Health, University College London, WC1N 1EH, London, UK. E-mail: [email protected]
Key words: development pediatrics, cognitive, children, assessment.
Contribution: AGS and JB contributed to the con-ception and design of the study; JB contributed to the analysis of data with input from AS. All co-authors contributed to the final manuscript writing.
Acknowledgements: the authors thank all partici-pating families for taking part in this study.
Conflict of interest: the authors report no conflict of interest.
Received for publication: 1 June 2010. Revision received: 22 July 2010. Accepted for publication: 2 August 2010.
This work is licensed under a Creative Commons Attribution 3.0 License (by-nc 3.0).
©Copyright A.G. Sutcliffe et al., 2010 Licensee PAGEPress, Italy
Pediatric Reports 2010; 2:e15 doi:10.4081/pr.2010.e15
Non-commercial
ing the WPPSI-R verbal IQ, performance IQ and full scale IQ scores from Griffiths GQ scores and to indicate the variance in WPPSI-R IQ explained by the Griffiths GQ. The predic-tive power of each Griffiths scale was exam-ined using ANOVA.
Results
The mean Griffiths GQ score (98.39) and mean WPPSI-R scores (FSIQ, 106.01; VIQ 101.03; PIQ 111.21) were in the average range.
Prediction of WPPSI-R IQ scores
from Griffiths general quotient
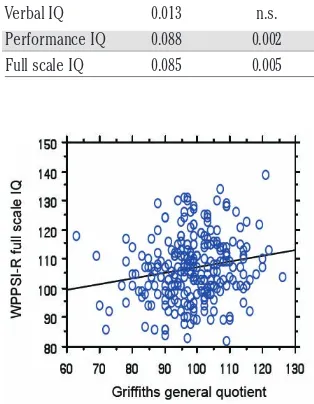
The Griffiths GQ scores had a weak but sta-tistically significant power to predict subse-quent WPPSI-R full-scale IQ and performance IQ (Table 1; Figures 1 and 2). The predictive power of the Griffiths GQ for the WPPSI-R ver-bal IQ was minimal and not significant (Table 1, Figure 3).
Prediction of WPPSI-R IQ scores
from Griffiths scale scores
[image:4.595.227.554.55.136.2]Examination of the relationship between the individual Griffiths scales and the WPPSI-R showed that only one scale, personal-social (F 7.10, P=0.009) was a significant predictor of the WPPSI-R full scale IQ with marginal pre-diction from the performance scale (F 3.38, P=0.068) and the locomotor scale (F 2.83, P=0.095) (Table 2). Two of the Griffiths scales were significant predictors of the WPPSI per-formance IQ, the perper-formance scale (F 6.93, P=0.009) and the personal-social scale (F 5.28, P=0.02) with marginal prediction from the hearing and speech scale (F 3.62, P=0.059) (Table 3).
Discussion
When trying to predict the subsequent WPPSI-R scores at age 5, the Griffiths scale, completed during toddlerhood at an age when language was only just emerging (17 months), has a significant predictive power for perform-ance IQ and full scale IQs but not the verbal IQ. This suggests that there is less predictive power for this age group in the Griffiths items from the hearing and speech scale that revolve around language-based tasks that are similar to the WPPSI-R verbal IQ score. Those items in the personal/social scale for the second year reflect some verbal skills such as communicat-ing about experiences and these may be more useful than items indicating the extent of vocabulary, which can vary widely during the second year. The Griffiths measure is there-fore more likely to be useful as a general indi-cator of subsequent development, but may not be the most appropriate test if language devel-opment is a particular target, for instance of an early intervention or to identify children who may in the future have language delay. It may be more useful for research purposes when mean values for groups are the focus rather than for clinical work focussing on specific children to identify those potentially in need of intervention.
References
1. Bayley N. Bayley scales of infant develop-ment, 2nd edition, 1993. The Psychological Corporation, San Antonio, TX, USA. 2. Griffiths R. The Griffiths mental
develop-ment scales, 1996 revision. 1996, Henley M., association for research in infant and
Article
Table 1. Summary of regressions of WPPSI-R IQ scores against the Griffiths general quotient score.
WPPSI-R R2 P
Verbal IQ 0.013 n.s.
Performance IQ 0.088 0.002
Full scale IQ 0.085 0.005
Table 2. Results of ANOVA of Griffiths scales with WPPSI-R full scale IQ.
Griffiths scale Mean square F P
Eye & hand coordination 293.41 1.66 0.199
Hearing and speech 45.83 0.26 0.611
Locomotor 498.67 2.83 0.095
Performance 595.88 3.38 0.068
[image:4.595.57.214.90.292.2]Personal-social 1252.35 7.10 0.009
Table 3. Results of ANOVA of Griffiths scales with WPPSI-R performance IQ.
Griffiths scale Mean square F P
Eye & hand coordination 52.84 0.77 0.383
Hearing and speech 249.16 3.62 0.059
Locomotor 4.24 0.06 0.804
Performance 477.15 6.93 0.009
Personal-social 363.92 5.28 0.023
Figure 1. Regression Plot of WPPSI-R full scale IQ and Griffiths general quotient.
[image:4.595.228.553.168.250.2]Figure 2. Regression plot of WPPSI-R per-formance IQ and Griffith general quotient.
Figure 3. Regression plot of WPPSI-R ver-bal IQ and Griffith general quotient.
Non-commercial
[image:4.595.59.213.555.702.2][page 50] [Pediatric Reports 2010; 2:e15]
child development, test agency.
3. Conn P. The relations between Griffiths scales assessments in the pre-school peri-od and educational outcomes at 7+ years. Child Care Health Dev 1993;19:275-89. 4. Beail N. A comparative study of profoundly
multiply handicapped children's scores on the Bayley and the Griffiths developmental scales. Child Care Health Dev 1985;11:31-6.
5. Kitchen WH, Rickards AL, Ford GW, et al. Selective improvement in cognitive test scores of extremely low birth weight infants aged between 2 and 5 years. Aust
Paediatr J 1989;25:288-91.
6. Rickards AL, Kitchen WH, Doyle LW, Kelly EA. Correction of developmental and intel-ligence test scores for premature birth. Aust Paediatr J 1989;25:127-9.
7. Ramsay M, Fitzhardinge PM. A compara-tive study of two developmental scales: the Bayley and the Griffiths. Early Hum Dev 1977;1:151-1.
8. Sutcliffe AG, Taylor B, Saunders K, et al. Outcome in the second year of life after in-vitro fertilisation by intracytoplasmic sperm injection: a UK case-control study. Lancet 2001;357:2080-84.
9. Ponjaert-Kristoffersen I, Bonduelle M, Barnes J, et al. International collaborative study of intracytoplasmic sperm injection-conceived, in vitro fertilization-conceived and naturally conceived 5-year-old child outcomes: cognitive and motor assess-ments. Pediatrics 2005;115:e283-9. 10. Wechsler D. Wechsler Preschool and
Primary Scale of Intelligence -Revised (WPPSI-R): Short Form Vocabulary and Block Design, 1989. The Psychological Corporation, Amersham, UK.