4320
BALANCING EXPLORATION AND EXPLOITATION IN ACS
ALGORITHMS FOR DATA CLUSTERING
1AYAD MOHAMMED JABBAR, 2 RAFID SAGBAN, 3KU RUHANA KU-MAHAMUD
1Computer Science Department, Shatt Al-Arab University College, Iraq
2 Department of Software, Faculty of Information Technology, University of Babylon, Iraq 3School of Computing, Universiti Utara Malaysia, Malaysia
E-mail: 1 [email protected], 2[email protected], 3[email protected]
ABSTRACT
Ant colony optimization (ACO) is a swarm algorithm inspired by different behaviors of ants. The algorithm minimizes deterministic imperfections by assuming the clustering problem as an optimization problem. A balanced exploration and exploitation activity is necessary to produce optimal results. ACO for clustering (ACOC) is an ant colony system (ACS) algorithm inspired by the foraging behavior of ants for clustering tasks. The ACOC performs clustering based on random initial centroids, which are generated iteratively during the algorithm run. This makes the algorithm deviate from the clustering solution and performs a biased exploration. This study proposes a modified ACOC called the population ACOC (P-ACOC) to address this issue. The proposed P-ACOC allows the ants to process and update their own centroid during the algorithm run, thereby intensifying the search at the neighborhood before moving to another location. However, the algorithm quickly produces a premature convergence due to the exploitation of the same clustering results during centroid update. To resolve this issue, this study proposes a second modification by adding a restart strategy that balances between the exploration and exploitation strategy in P-ACOC. Each time the algorithm begins to converge with the same clustering solution, the restart strategy is performed to change the behavior of the algorithm from exploitation to exploration. The performance of the proposed algorithm is compared with that of several common clustering algorithms using real-world datasets. The results show that the accuracy of the proposed algorithm surpasses those of other algorithms.
Keywords: Data Clustering, Optimization Clustering, Swarm Clustering, Exploration, Exploitation.
1. INTRODUCTION
Clustering is a means to organize data as
clusters without predefined information.
Similarities among data are measured on the basis of the data’s extracted features. This method is an indirect data mining approach that uses unlabeled data to determine relationships among the data, whereas a direct approach called a classification approach requires predefined classes [1]. Data clustering tasks can be categorized as deterministic and stochastic approaches. The deterministic approach includes partitional and hierarchical clustering approaches [2, 3]. A partitional
clustering approach contains three major
approaches, namely, density-, model-, and grid-based clustering, whereas the hierarchical clustering approach includes divisive and agglomerative
clustering. The partitional clustering approach produces a spherical clustering result wherein each object belongs to a single cluster, whereas the
hierarchical clustering approach produces
4321 and their natural behavior and in which the clustering problem is formulated as an optimization problem [10, 12, 13]. This approach minimizes or maximizes an objective function to find the maximum similarity among data [14]. The stochastic approach comprises three algorithms, namely, exact, estimation, and approximation. The exact algorithm is good for an optimization problem within a dependent runtime instance [15]. However, exponential time is required by the algorithm to solve a difficult optimization problem. The estimation approach uses a predefined range of inputs to produce results, such as in clustering when the number of clusters is defined as a range of inputs [16], [17]. Likewise, the approximation approach does not promise an optimal clustering solution, but it can find good solutions in a relatively short time. This approach performs clustering based on a single or population approach [17, 18]. The single approach, such as simulated annealing, tracks the improvement of a single solution candidate, whereas the population approach iteratively modifies a set of candidate solutions based on algorithm feedback [20].
Ant colony optimization (ACO) is a
population approach inspired by the foraging behavior of ants, and it can be applied in different data mining application domains [21]–[24]. The success of ACO lies in its two main components: exploration and exploitation [23, 24]. Exploration refers to the global processing of the search space to produce diverse solutions. Meanwhile, exploitation identifies high-quality regions in a search space that has high-quality solutions and intensifies the search in these regions [25]. The balance between the two components affects the performance of the algorithm.
ACO for clustering (ACOC) uses the concept of an ant colony system (ACS) to solve clustering problems. Kao and Cheng [26] introduced dynamic cluster centers so that the ACO for partitional clustering (ACOC) assumes the number of clusters as a fixed parameter. The algorithm performs high exploration towards a clustering solution without searching towards the promising region of the best solution. This activity is a drawback because such a large amount of exploration does not guarantee that the neighborhoods of the best regions are revisited, thus causing difficulty in decision-making during the run. In the ACOC algorithm, ants generate a random centroid in each iteration, disabling the algorithm to transfer the current clustering solution to the next iteration. Therefore, the history of the search is lost during the algorithm run.
This study aims to solve the shortcoming of ACOC by presenting a new modified algorithm called a population ant colony optimization for clustering (P-ACOC) task. The modification is designed to make ants exploit the search in a region before moving to a new region without changing the centroid in each iteration. In other words, each ant will attempt to improve its clustering solution during the iterations so that the current neighborhood structure is transferred to the next iteration using the current clustering solution. The proposed algorithm has a new parameter for each ant called the convergence limit. This parameter measures the diversity of the clustering solution and represents the number of solutions that does not improve during the algorithm run. The convergence to the local minima transpires, and the current ant will produce the same clustering result. Thus, the current clustering solution is abandoned. A restart strategy is added to control the exploitation rate based on the amount of similarity of solutions calculated by the convergence limit. When the exploitation rate is high,the algorithm is forced to explore in a new region for more optimal clustering solutions using random and mating search strategies.
The remainder of this paper is organized as follows: Section 2 presents the literature review on ACO based clustering algorithms. Section 3 illustrates the proposed methodology and Section 4 discusses the proposed algorithm. Section 5 shows the evolution task of the proposed modification while conclusions and future works are provided in Section 6.
2. RELATED WORK
4322 clustering does not produce the actual number of clusters because objects may not be grouped when the execution of the algorithm is completed [29]. Therefore, other algorithms are combined with ant-based clustering to minimize error. In ACO-ant-based clustering, ants exchange indirect connections with other ants [30]. ACO-based clustering can construct and modify the solutions iteratively to produce more optimal solutions. In addition, this approach can learn over time using the pheromone of the colony. Moreover, researchers have improved the algorithm to make it strong and suitable for different areas. Regardless of the placement of the deterministic and stochastic clustering approaches in the taxonomy, this research focuses on ACO-based clustering due to its advantages and ability to produce near-optimal clustering solutions.
The first research in ACO-based clustering was published in 2004 [31]. The proposed algorithm belongs to partitional clustering, where the number of clusters is known to the user. The algorithm is based only on pheromone trails in which each instance is assigned to a cluster according to the amount of pheromones. The local optima is easily determined because the algorithm produces empty sub-clusters. Hence, the initial pheromone allows the algorithm to group the instances into a single cluster. The algorithm requires a long time to distribute the instances to the right clusters.
The algorithm for text and numerical datasets in [32][26] were modified to extend the Shelokar algorithm [31] as a dynamic cluster center. The proposed algorithm considers the number of clusters predefined by the user. The pheromone and heuristic information serve as a guide for the clustering problem. The algorithm generates random clustering centroids in each iteration to find the optimal clustering configuration using the pheromone and heuristic information. However, the algorithm depends greatly on the exploration towards a clustering solution. The ability of the algorithm to search many spaces reduces its capacity to exploit the best neighborhood solution. Thus, the learning process is not effective to obtain the best solution at the right time [26].
The medoid ACOC (M-ACOC) is an extension of ACOC that uses the medoid to improve the algorithm performance against outlier objects [33]. The algorithm generates a random medoid in each iteration, and each medoid is used to achieve optimal clustering based on pheromone and heuristic information. However, this algorithm also generates the medoids in a random and
iterative manner, thereby rendering the exploitation strategy ineffective in searching the search space.
Other research has proposed an automatic grouping of instances as partitional clustering using a silhouette index [34, 35]. The proposed algorithm starts partitional clustering with a random number of clusters using a predefined range of clusters in a dataset. The objective is clustering with high-value indexes so that the grouping of instances will reflect the real distribution of the instances in the dataset. However, the algorithm is based on the predefined range of clusters; thus, the algorithm cannot produce optimal clustering results if the dataset has an unknown clustering number and forms in different density levels.
A hybrid spectral-based ACO clustering algorithm is proposed to group instances in a dataset according to their density. The algorithm uses a user-defined number of clusters in which each cluster considers one kernel instated on the centroid. Results show that the algorithm is better than K-means when the dataset forms in different density levels. However, the number of clusters has to be predefined and the algorithm suffers from memory consumption, thereby restricting the suitability of the algorithm to disparate distributions of instances. Comparison using K-means is ineffective to this kind of data but is faster in processing as a whole [36].
Similar research has proposed an automatic grouping of instances based on the external validity measurement of the density of instances in the dataset [3]. Two objective functions, namely, adjusted compactness and relative separation, are proposed. Each objective function evaluates the clustering solution considering the local characteristics of the neighborhoods. However, the algorithm requires high consumption time, and the number of clusters is measured in the range predefined by the user; hence, if the dataset has an unknown clustering number, the algorithm cannot easily determine the right number.
4323 algorithm produces a highly explored clustering solution because it changes its centroids in every iteration.
In conclusion, the majority of the clustering algorithm considers a predefined number of clusters, thereby causing the algorithm to perform clustering with the centroid randomly changing with each iteration. This phenomenon disables the exploitation of the current clustering solution. The algorithm forgets the history of the search and produces the same clustering result during the algorithm run. The ability of the algorithm to search substantial data from the search space reduces its capacity to exploit the best neighborhood solution; thus, the learning process becomes ineffective in converging with the best solution at the right time.
3. RESEARCH METHOD
The contributions of the proposed P-ACOC algorithm is twofold. First, in contrast to extant literature, the current algorithm does not randomly update the clustering centroids in each iteration. The proposed P-ACOC allows the ants to process their own centroid by intensifying the search at the neighborhood of current ant’s centroided before moving to another location. The algorithm exploits the neighborhood of each ant to find improved clustering solutions. However, the algorithm may represent premature convergence due to the exploitation of the same clustering results during centroid update. Second, this work adds a restart strategy, wherein the search restarts when the premature convergence occurs. The strategy changes the behavior of the algorithm from exploitation to exploration to find other promising regions of the search space. Each ant starts with a random centroid, which will not be iteratively updated until the current centroid remains unchanged in each iteration (first modification). This modification causes premature convergence on the clustering results during the early stages. This problem is solved by applying the second modification in which the algorithm will produce a random clustering solution and jump off the current stagnation when the algorithm converges with the clustering solution. Two jumping strategies are used. The first involves the restart of the algorithm with a random clustering solution to escape the early convergence. This process is important if the randomly generated solution comes from the global region (i.e., the strategy is used for global search). If the random clustering solution is worse than the current solution, the restart algorithm becomes
ineffective because the algorithm will research for the optimal solution and may require more time to produce an optimal solution. The second strategy is mating the current clustering solution with a random clustering solution using crossover and mutation operators to ensure that the produced clustering solution is at the neighborhood of the current solution. The algorithm intensifies the search in the best clustering solution at the current algorithm run.
4. ALGORITHM DETAIL
The proposed algorithm follows the framework of the ACOC algorithm. The algorithm starts with a random number of centroids and a predefined number of clusters known to the users. The constructed graph is divided into 𝐾 ∗ 𝑀
portions, where 𝐾 is the number of clusters, and 𝑀
is the number of instances (Figure 1). The ant starts its clustering from instance 𝑀1 to the nearest centroid 𝐾2. Each ant moves sequentially from one instance to another, assigns the instances one by one, and deposits pheromones on the nodes. The solid circles represent the visited nodes, whereas the hollow circles denote the unvisited ones. Figure 1 presents a clustering solution example (2-1-2-2-2-3). The first instance (𝑀1) of the solution is assigned to cluster number 2, the second instance (𝑀2) is assigned to cluster number 1, and so on.
Figure 1: Graph for P-ACOC Algorithm
Each ant 𝑟 has its own centroid; clustering is based on the ant’s centroid and pheromone and heuristic information. The assignment of each instance 𝑀 to the nearest ant centroid is based on the amount of pheromone between the instance and the heuristic value, which is represented by the Euclidean distance between 𝑀 and the ant 𝑟 centroid, where
𝑐 is the current ant 𝑟 centroid.
4324 The algorithm performs clustering on instances based on either an exploitation or exploration strategy. Each strategy has its own effect on the clustering results, especially at the start of the algorithm run. Exploitation is a greedy strategy, which drives the clustering solution toward regain with a high amount of pheromone, whereas exploration is a stochastic search that allows the algorithm to consider the solution with results worse than the current clustering solution or drives the algorithm toward regain with insufficient information. The goal of the algorithm is to obtain various solutions which prevent the algorithm from being trapped in the local optima especially at the start of the algorithm run at which the acceptance of the solutions is allowed in the primitive research stages while intensifying the algorithm research regions that contain the best quality solutions in the advanced research stages. Exploitation and exploration operate according to a predefined static parameter 𝑞 and a random parameter 𝑞, which are generated in each selection. Exploitation occurs if
𝑞<𝑞 to select the cluster 𝑘 for instance 𝑚.
𝑘 = arg 𝑚𝑎𝑥 ∈ [𝜏(𝑚, 𝑐 ) ] 𝜂(𝑚, 𝑐 ) 𝑖𝑓 𝑞 < 𝑞 𝑆 𝑜𝑡ℎ𝑒𝑟𝑤𝑖𝑠𝑒 , (2)
where 𝜏(𝑚, 𝑐 ) is the amount of pheromones between ant centroid 𝑐 and instance 𝑚; 𝜂(𝑚, 𝑐 )
is the heuristic information calculated as the distance between ant centroid 𝑐 and instance 𝑚; and 𝛽 and 𝛼 are the controller parameters, which are important for the control of the pheromone and distance value. If 𝑞 is greater than 𝑞 , the algorithm selects the cluster 𝑘 according to the probability selection shown below.
𝑝(𝑘) = [𝜏(𝑚, 𝑐 ) ] 𝜂(𝑚, 𝑐 )
∑ [𝜏(𝑚, 𝑐 ) ][𝜂(𝑚, 𝑐 ) ] (3)
The assignment process is performed until no more instances are left. The best clustering solution in the current iteration is improved through an applied simple local search by which each single component of clustering solution can be changed from its current cluster value into another value
depending on the predefined parameter 𝑝
(𝑝 =0.01) within the range 0 ≤ 𝑝 ≤1. Therefore, only the random number with values less than 𝑝
will be assigned a different cluster number. This process allows the algorithm to improve the clustering solution, especially at the start of the run when clustering solutions are not yet acceptable. In each step, clustering solutions are evaluated using
the minimum error between each instance and the ant centroid 𝑐 . 𝑁 is the total number of instances.
𝑓 = 𝑑(𝑐 , m) (4)
The next process selects the best solution obtained by either the local search process or the iteration based on the fitness function. This solution is updated by the amount of pheromone and the evaporation process on all entries of the pheromone matrix performed (Equation [5]). The evaporation process is based on the value of the evaporation factor 𝜌, which is known to the user. After the evaporation process, each ant updates its centroids to use them in the next stage similar to the K-means algorithm.
𝜏 (𝑡 + 1) = (1 − 𝜌)𝜏 (𝑡) + . (5)
The modification of the algorithm is performed after the evaporation process, and the convergence
limit is introduced. As discussed, the
algorithm converges with the local minima when the update of centroids remain unchanged, thus ants will produce the same clustering solution; therefore, the current clustering solution is abandoned. A new clustering solution and jump from the local optima solution is achieved by applying a restart strategy. The algorithm produces a new random clustering solution for each ant, and this solution is accepted regardless of whether it is better or worse than the current solution. This strategy helps the algorithm jump from the local optima by exploring a new region. However, the algorithm may jump in regions with an unacceptable clustering solution, thereby disabling the algorithm’s ability to produce improved clustering results.
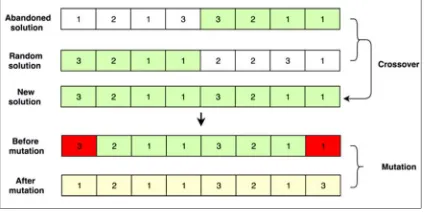
4325 such cases, the original solution is again subjected to crossover operation. The probability of using the crossover and mutation operations is based on the crossover and mutation rates, which are 0.8 and 0.001, respectively. Both operations are performed if the crossover and mutation rates are less than the random numbers respectively generated by the algorithm.
Figure 2: Crossover and Mutation Operators
[image:6.612.91.303.199.307.2]The convergence limit is set to 30. Each ant performs this strategy based on its predefined convergence limit. Small values of the convergence limit will lead the algorithm search toward exploration; otherwise, the search is led toward exploitation. Therefore, the convergence limit must be tuned to produce a more optimal clustering result. The P-ACOC algorithm is illustrated in Figure 3.
Figure 3: Proposed P-ACOC Algorithm
5. EXPERIMENTAL RESULTS
The proposed P-ACOC is performed to solve data clustering problems on ten (10) datasets from the University of California (UCI) Irvine Machine Learning Repository [38]. These benchmark datasets are for clustering and classification tasks. The datasets include different features of problem space such as sample dimension, feature diversity, size (small, medium, large). The datasets are from different problems such as disease which includes breast cancer (BC), breast tissue (BT), hepatitis and E.coli (Ec),
[image:6.612.312.525.215.459.2]analysis of hand movement (Libras (Li)), finding the survival of patients (Haberman (Hb)), image analysis of ionosphere (Io), metal signals in mining operation (sonar (So)), iris flower (Ir) and chemical analysis in wine (Wi). The description of the datasets is as depicted in Table 1. The datasets differ from each other, thereby making the comparison of the proposed algorithm against other swarm clustering algorithms challenging.
Table 1: Description of UCI Datasets
Name
Dataset & attribute characteristics
Attribute number
Class (number of
clusters)
Instance
BC Multivariate Integer 9 2 699
BT Multivariate Real 9 6 106
Ec Multivariate Real 7 6 336
Li Multivariate Real 90 15 360
Hb Multivariate Integer 3 2 306
Hp
Multivariate Categorical,
Integer, Real 19 2 155
Lo Integer, Real Multivariate 34 2 351
So Multivariate Real 60 2 208
Ir Multivariate Real 4 3 150
Wi Integer, Real Multivariate 13 3 178
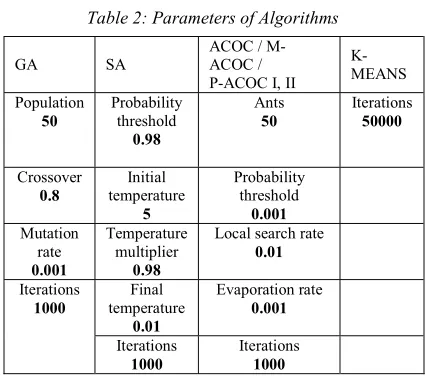
The results of the P-ACOC were compared with five (5) algorithms, namely, ACOC, M-ACOC, genetic algorithm (GA), simulating annealing algorithm (SA), and K-means (KM) algorithm. The parameters of each algorithm are listed in Table 2. The parameter settings follow the literature of these algorithms in the clustering domain [39]. The parameter of clustering algorithm that belongs to ACO-based clustering are number of ants sets to 50, probability threshold either exploration or exploitation equals 0.001, local search rate is 0.01 and evaporation rate equals 0.001. Note that the number of iterations is 1000 and the execution time is 10 times for each algorithm. The K-means algorithm is the only algorithm that has a different number of iterations and different number of runs, where the number of iterations equals 50000 and the number of executions is 25 times because the algorithm easily converges to local optima solution. This makes it easier to ensure that algorithms are compared fairly.
4326
Table 2: Parameters of Algorithms
GA SA ACOC / M-ACOC /
P-ACOC I, II K-MEANS Population 50 Probability threshold 0.98 Ants 50 Iterations 50000 Crossover 0.8 Initial temperature 5 Probability threshold 0.001 Mutation rate 0.001 Temperature multiplier 0.98
Local search rate 0.01 Iterations 1000 Final temperature 0.01 Evaporation rate 0.001 Iterations 1000 Iterations 1000
Good clustering can be judged using the internal and external criteria in the clustering domains. The criteria can assess clustering performance based on static value. Each criterion measures the distribution of a single cluster and the connectivity and distances among the cluster’s members. The best clustering performance is represented by the minimum distance among the members and the maximum distance of the cluster from others.
The evaluation of the algorithms focuses on the internal measurement, which is the error, and external information such as F-measure and
entropy, where the calculation for the
measurements are based on realistic information extracted by the user from labeled data. The metrics for comparison are the average of intra-cluster distance, Calinski-Harabasz (CH) measurement, F-measure and entropy F-measurement. The internal criteria are the sum of intra-cluster distances (Equation [4]) and Calinski-Harabasz (CH) measurement [16], whereas the external criteria include the F-measure and entropy measurement [40], [41]. The sum of the intra-cluster distances measures the summation of error within each cluster. CH measures the quality of results based on overall within-cluster variance (SSW) and between-cluster variance (SSB), as shown in the Equation (6), where 𝑁 is the number of instances in the dataset, and 𝐾 is the number of clusters. A higher CH signifies a better result.
𝑆𝑆𝐵
𝑆𝑆𝑊∗
𝑁 − 𝐾
𝐾 − 1 (6)
F-measure is applied to identify the quality of the clustering results and the best value if maximized.
It requires two additional measure criteria to calculate its results as shown in Equation (7). These measures are called precision and recall, which can be calculated as shown in Equations (8) and (9), respectively [42].
𝐹 − 𝑚𝑒𝑎𝑠𝑢𝑟𝑒 = ∗ ∗ , (7)
𝑃𝑟𝑒𝑐𝑖𝑠𝑖𝑜𝑛 = , (8)
𝑅𝑒𝑐𝑎𝑙𝑙 = , (9)
where 𝑇𝑃 means true positive, 𝐹𝑃 is false positive, and 𝐹𝑁 is false negative
.
Equation (10) demonstrates how the entropy for single clustering 𝑤 is calculated [43].
𝐻(𝑤) = − 𝑃(𝑤 )𝑙𝑜𝑔 𝑃(𝑤 ), (10)
∈
where c is a classification in set C, and 𝑃(𝑤 ) is the probability of a data point being classified as c in cluster w. The total entropy of a cluster is
𝐻(Ω) = 𝐻(𝑤)𝑁
𝑁, (11) ∈
where H(w) is the single cluster’s entropy, N is the number of points in cluster w, and N is the total number of points. A low total entropy indicates better clustering results.
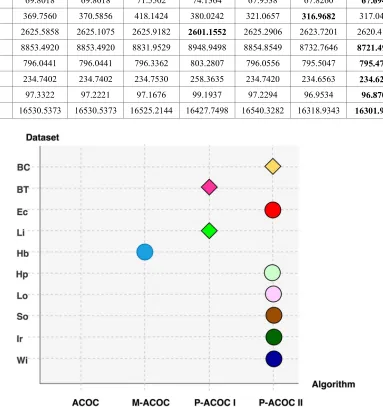
P-4327 ACOC II that searches for global optimal solutions. It can also be seen in Figure 4 (diamond shapes are for disease related datasets and circle shapes are for non-disease datasets), that P-ACOC I and P-ACOC II outperformed two (2) other ACO-based clustering algorithms for all datasets except the Hb datasets where M-ACOC performed the best. It is also noted that P-ACOC II managed to outperform P-ACOC I on seven (7) datasets which shows that a random strategy is better in terms of sum of
[image:8.612.90.525.236.410.2]intra-cluster distances. In conclusion, ACOC I and P-ACOC II outperform other clustering algorithms because both strategies keep track of the best solution (so far) while changing the neighbourhood of the best clustering region. The algorithms were also able to avoid local optima solution by moving the search into global optima solution.
Table 3: Average Results of Sum Intra-Cluster Distance for All Clustering Algorithms
Dataset GA SA ACOC M-ACOC K-means P-ACOC I P-ACOC II
BC 3055.4205 3061.3448 4196.0555 3213.6519 3055.6440 3047.6036 3047.3872
BT 7130.3520 7054.0887 7222.3375 8081.8647 7082.3945 7034.0568 7037.1041
Ec 69.8018 69.8018 71.5502 74.1364 67.9538 67.8260 67.6949
Li 369.7560 370.5856 418.1424 380.0242 321.0657 316.9682 317.0435 Hb 2625.5858 2625.1075 2625.9182 2601.1552 2625.2906 2623.7201 2620.4190 Hp 8853.4920 8853.4920 8831.9529 8948.9498 8854.8549 8732.7646 8721.4906
Lo 796.0441 796.0441 796.3362 803.2807 796.0556 795.5047 795.4785
So 234.7402 234.7402 234.7530 258.3635 234.7420 234.6563 234.6243
Ir 97.3322 97.2221 97.1676 99.1937 97.2294 96.9534 96.8703
[image:8.612.116.499.291.698.2]Wi 16530.5373 16530.5373 16525.2144 16427.7498 16540.3282 16318.9343 16301.9347
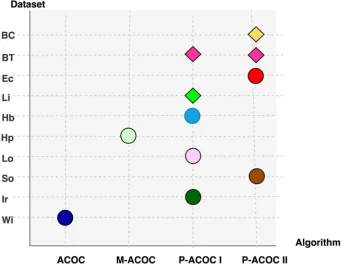
4328 Table 4 shows the results of clustering algorithms for CH measurement. The proposed P-ACOC I has obtained good results on four datasets (BT, Li, Hb, and Ir) while P-ACOC II only managed to obtain good results on two (2) datasets (BT and Ec). K-means has secured good results on four (4) datasets (BC, Hp, Lo and So) as well. Figure 5 shows the comparison of all four (4)
[image:9.612.93.523.222.406.2]ACO-based algorithms. Both P-ACOC I and P-ACOC II outperformed ACOC and M-ACOC on eight (8) datasets because both ACOC and M-ACOC algorithms randomly generate clustering centroids which increase the error in clustering. Mating strategy seems to be a better strategy than random strategy in terms of CH metric. This can be seen when P-ACOC I has better results than P-ACOC II.
Table 4: Average CH Result for All Clustering Algorithms
Dataset GA SA ACOC M-ACOC K-means P-ACOC I P-ACOC II
BC 1037.3525 1028.0012 918.7035 1032.1596 1039.8662 1039.0430 1039.1302
BT 12.9674 13.6737 12.0905 10.5126 12.31930 14.0240 14.0240
Ec 144.6957 139.9484 142.3530 141.0125 153.3272 159.3317 159.8686
Li 33.6332 32.5390 21.0945 45.2097 49.7054 56.0269 55.59839
Hb 239.6843 239.9218 239.7359 236.8510 232.4738 239.9218 239.1396 Hp 117.5595 117.5595 118.6960 123.6394 128.6346 120.7601 120.3596 Lo 118.4701 118.4701 118.3696 118.4263 118.8242 118.7017 118.6338
So 59.1919 59.1919 58.9205 55.2992 59.5830 59.1718 59.1919
Ir 555.0277 558.9161 559.9799 558.6531 509.0713 560.2599 558.9999
[image:9.612.131.480.437.705.2]Wi 556.1460 556.1459 555.2400 547.4481 539.7797 537.6950 538.9061
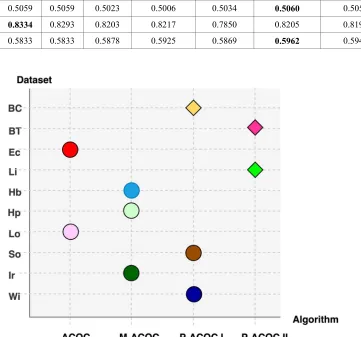
4329 Table 5 depicts the results of clustering algorithms for F-measure measurement which indicates the clustering accuracy. The K-means algorithm performed the best as compared to other algorithms. P-ACOCII, ACOC and SA clustering algorithms performed equally well on the ten (10) datasets better than M-ACOC. There is no dominant algorithm because F-measure is an external clustering measure which is based on information that reflects the real classification of
[image:10.612.90.524.235.416.2]the data, while the objective function is an internal clustering and based on internal information recording the minimum intra-clustering variance on finding the optimal centroids. Thus, even though the algorithm can find better centroids than other algorithms, in some cases it produces the same groups. P-ACOC I had better results when compared to P-ACOC II but had the same results with M-ACOC as shown in Figure 6.
Table 5: Average F-Measure Result for All Clustering Algorithms
Dataset GA SA ACOC M-ACOC K-means P-ACOC I P-ACOC II
BC 0.9394 0.9365 0.9277 0.9161 0.9273 0.9361 0.9358
BT 0.2536 0.2733 0.2406 0.2307 0.2488 0.2622 0.2635
Ec 0.5287 0.4973 0.6770 0.5335 0.5775 0.5802 0.6099
Li 0.2530 0.2485 0.2096 0.3096 0.3355 0.3571 0.3885
Hb 0.5481 0.5479 0.5478 0.5487 0.5561 0.5479 0.5480
Hp 0.6628 0.6628 0.6681 0.6826 0.7244 0.6697 0.6681
Lo 0.5996 0.5996 0.5997 0.5995 0.6042 0.5975 0.5959
So 0.5059 0.5059 0.5023 0.5006 0.5034 0.5060 0.5059
Ir 0.8334 0.8293 0.8203 0.8217 0.7850 0.8205 0.8195
[image:10.612.131.492.367.704.2]Wi 0.5833 0.5833 0.5878 0.5925 0.5869 0.5962 0.5946
4330 Table 6 highlights the results of the entropy measurement. The comparison on entropy value determines the information contained in the cluster. The lower the value, the more accurate the clustering result. K-means, P-ACOC I and SA performed the best results in this comparison followed by P-ACOC II and GA. The best results
[image:11.612.95.524.197.684.2]among the ACO-based algorithms were obtained by P-ACOC II and P-ACOC I followed by ACOC (refer to Figure 7). However, random strategy is superior than mating strategy where P-ACOC II has obtained better results on four (4) datasets which reflects a more robust and accurate clustering result.
Table 6: Average Entropy Result for All Clustering Algorithms
Dataset GA SA ACOC M-ACOC K-means P-ACOC I P-ACOC II
BC 0.2142 0.2216 0.2240 0.2808 0.2496 0.2242 0.2249
BT 2.0494 1.9814 2.0520 2.1049 2.0600 2.0490 2.0315
Ec 0.8127 0.8374 0.8058 0.8095 0.7472 0.7128 0.6482
Li 2.1534 2.2240 2.4232 1.8638 1.7223 0.3949 1.4971
Hb 0.8329 0.8329 0.8333 0.8330 0.8308 0.8329 0.8328
Hp 0.7340 0.7340 0.7336 0.7338 0.7320 0.7334 0.7336
Lo 0.8144 0.8144 0.8161 0.8169 0.8119 0.8193 0.8211
So 0.9909 0.9909 0.9909 0.9964 0.9884 0.9920 0.9909
Ir 0.3806 0.3798 0.3969 0.3907 0.4668 0.3949 0.4040
Wi 0.9091 0.9091 0.8894 0.8913 0.9115 0.8832 0.8863
[image:11.612.88.524.200.382.2] [image:11.612.135.475.415.682.2]4331 In the comparison of all ACO-based algorithms, we can see that the proposed P-ACOC I and P-ACOC II produced better results than ACOC and MACOC algorithms on disease-related datasets. The proposed algorithms produce significantly better results for internal measurements (CH and sum of intra-cluster distances) while for the external measurements (F-measure and entropy), the results are comparable.
6. CONCLUSION
This research aims to improve the ACOC algorithm to produce more optimal clustering results. We also intend to determine the effects of algorithm performance, including high exploration, which disables the algorithm in order to intensify the search in the best region of the best clustering solution. This study improves the ACOC algorithm by proposing a modification in which each ant is allowed to process and update its own centroid during an algorithm run. Once the ant has obtained the same clustering solution, it will move to another region based on either a random or mating strategy. The random strategy will trigger the algorithm to search for the global optimal solution. In the mating strategy, which includes crossover and mutation operators, the strategy allows the algorithm to improve the same clustering solution through a deep intensification of the best obtained solution. The P-ACOC is compared with five clustering algorithms using ten datasets. The results show that a P-ACOC with both strategies outperforms classical clustering algorithms in terms of intra-cluster distance, CH, entropy, and F-measure results. In the future, it would be better if the algorithm can automatically produce the number of clusters without any user involvement and evaluate the algorithm using more datasets with different distributions and density levels. Automatic clustering using an internal measurement such as CH criteria can be used to measure the performance for better clustering solutions.
ACKNOWLEDGEMENT
The authors thank the Ministry of Higher Education Malaysia for funding this study under the Transdisciplinary Research Grant Scheme (S/O code 14163).
REFRENCES:
[1] H. N. K. Al-Behadili, K. R. Ku-Mahamud,
and R. Sagban, “Rule pruning techniques in
the ant-miner classification algorithm and its variants: A review,” in IEEE Symposium on Computer Applications and Industrial Electronics(ISCAIE), 2018, pp. 47–56. [2] R. F. Kashef, “Cooperative Clustering
Model and Its Applications,” pp. 1–170, 2008.
[3] T. İnkaya, S. Kayalıgil, and N. E. Özdemirel, “Ant Colony Optimization based clustering methodology,” Appl. Soft Comput., pp. 301–311, 2015.
[4] R. Forsati, A. Keikha, and M. Shamsfard, “An improved bee colony optimization algorithm with an application to document clustering,” Neurocomputing, vol. 159, no. 1, pp. 9–26, 2015.
[5] A. K. Jain, “Data clustering: 50 years beyond K-means,” Pattern Recognit. Lett., vol. 31, no. 8, pp. 651–666, 2010.
[6] M. S. Bhargavi and S. D. Gowda, “A novel validity index with dynamic cut-off for determining true clusters,” Pattern Recognit., pp. 1–15, 2015.
[7] V. Cohen-Addad, V. Kanade, F.
Mallmann-Trenn, and C. Mathieu, “Hierarchical Clustering: Objective Functions and Algorithms,” IEEE Commun., no. 1–42, 2017.
[8] J. Muguerza, O. Arbelaitz, J. Martın, and J. Muguerza, “SEP / COP : An efficient method to find the best partition in hierarchical clustering based on a new cluster validity index,” Pattern Recognit., vol. 43, pp. 3364–3373, 2010.
[9] K. R. Žalik and B. Žalik, “Validity index for clusters of different sizes and densities,” Pattern Recognit. Lett., vol. 32, no. 2, pp. 221–234, 2011.
[10] R. Xu, J. Xu, and D. C. Wunsch, “A Comparison Study of Validity Indices on Swarm-Intelligence-Based Clustering,” vol. 42, no. 4, pp. 1243–1256, 2012.
[11] O. Arbelaitz, I. Gurrutxaga, J. Muguerza, J. M. Pérez, and I. Perona, “An extensive comparative study of cluster validity indices,” Pattern Recognit., vol. 46, no. 1, pp. 243–256, 2013.
[12] S. Zhu and L. Xu, “Many-objective fuzzy
centroids clustering algorithm for
categorical data,” Expert Syst. Appl., vol. 96, pp. 230–248, 2018.
4332 e12310, 2018.
[14] S. Karol and V. Mangat, “Evaluation of text document clustering approach based on particle swarm optimization,” Cent. Eur. J. Comput. Sci. Eval., vol. 3, no. 2, pp. 69–90, 2013.
[15] R. Sagban, “Reactive Approach for
Automating Exploration and Exploitation in Ant Colony Optimization,” 2015.
[16] R. Ünlü and P. Xanthopoulos, “Estimating the number of clusters in a dataset via consensus clustering,” Expert Syst. Appl., vol. 125, pp. 33–39, 2019.
[17] W. Zhang, H. I. Yang, H. Y. Jiang, and C. K. Chang, “Automatic data clustering analysis of arbitrary shape with K-means
and enhanced ant-based template
mechanism,” Proc. - Int. Comput. Softw. Appl. Conf., pp. 452–460, 2012.
[18] I. Boussaïd, J. Lepagnot, and P. Siarry, “A survey on optimization metaheuristics,” Inf. Sci. (Ny)., vol. 237, pp. 82–117, 2013. [19] M. Birattari, “Tuning Metaheuristics: A
Machine Learning Perspective,” in Tuning Metaheuristics: A Machine Learning Perspective, Second edi., vol. 197, Berlin: Springer, 2009, p. 37.
[20] C. Blum and A. Roli, “Metaheuristics in combinatorial optimization: overview and conceptual comparison,” ACM Comput. Surv., vol. 35, no. 3, pp. 189–213, 2003. [21] H. N. K. Al-Behadili, K. R. Ku-Mahamud,
and R. Sagban, “Ant colony optimization algorithm for rule-based classification: Issues and potential solutions,” J. Theor. Appl. Inf. Technol., vol. 96, no. 21, pp. 7139–7150, 2018.
[22] H. N. K. Al-Behadili, “Intelligent
Hypothermia Care System using
Ant Colony Optimization for Rules Prediction,” J. Univ. Babylon, vol. 26, no. 2, pp. 47–56, 2018.
[23] J. Wahid and H. F. A. Al-Mazini,
“Classification of Cervical Cancer Using
Ant-Miner for Medical Expertise
Knowledge Management,” Knowl. Manag. Int. Conf., no. November, 2018.
[24] A. M. Jabbar, “Controlling the Balance of Exploration and Exploitation in ACO Algorithm,” J. Univ. Babylon, vol. 26, no. 2, pp. 1–9, 2018.
[25] R. Sagban, K. R. Ku-Mahamud, and M. S.
A. Bakar, “Unified strategy for
intensification and diversification balance in ACO metaheuristic,” ICIT 2017 - 8th Int.
Conf. Inf. Technol. Proc., pp. 139–143, 2017.
[26] Y. Kao and K. Cheng, “An ACO-Based Clustering Algorithm,” ANTS Int. Work. Ant Colony Optim. Swarm Intell., vol. 4150/2006, pp. 340–347, 2006.
[27] J. L. Deneubourg, S. Goss, N. Franks, A. Sendova-Franks, C. Detrain, and L. Chrétien, “The Dynamics of Collective Sorting: Robot-Like Ants and Ant-Like Robots,” From Anim. to Animat. 1st Int. Conf. Simul. Adapt. Behav., pp. 356–363, 1991.
[28] A. M. Jabbar, K. R. Ku-Mahamud, and R. Sagban, “Ant-based sorting and ACO-based clustering approaches: A review,” in
IEEE Symposium on Computer
Applications & Industrial Electronics (ISCAIE), 2018, pp. 217–223.
[29] Y. He, S. C. Hui, and Y. Sim, “A novel ant-based clustering approach for document clustering,” 3rd Asia Inf. Retr. Symp. AIRS 2006 Oct. 16 2006 Oct. 18, pp. 537–544, 2006.
[30] R. Sagban, K. R. Ku-Mahamud, and M. S.
Abu Bakar, “Reactive max-min ant system with recursive local search and its application to TSP and QAP,” Intell. Autom. Soft Comput., vol. 23, no. 1, pp. 127–134, 2017.
[31] P. S. Shelokar, V. K. Jayaraman, and B. D. Kulkarni, “An ant colony approach for clustering,” Anal. Chim. Acta, no. 2, pp. 187–195, 2004.
[32] David and R. R. Kosala, “Clustering Algorithm Comparison of Search Results Documents,” 2018 6th Int. Conf. Cyber IT Serv. Manag., no. Citsm, pp. 1–6, 2018. [33] H. D. Menéndez, F. E. B. Otero, and D.
Camacho, “MACOC: A Medoid-Based ACO Clustering Algorithm,” in Swarm Intelligence, 2014.
[34] T. M. Pacheco, L. B. Gonçalves, V. Ströele, and S. S. R. F. Soares, “An Ant Colony
Optimization for Automatic Data
Clustering Problem,” 2018 IEEE Congr. Evol. Comput. CEC 2018 - Proc., 2018. [35] H. D. Menéndez, F. E. B. Otero, and D.
Camacho, “Medoid-based clustering using ant colony optimization,” Swarm Intell., vol. 10, no. 2, pp. 123–145, 2016.
[36] H. D. Menéndez, F. E. B. Otero, and D.
Camacho, “SACOC:A Spectral-Based
4333 194.
[37] D. S. Santos, D. de Oliveira, and A. L. Bazzan, “Data mining and multi-agent integration,” Data Min. Multi-Agent Integr., pp. 239–249, 2009.
[38] K. Bache and M. Lichman, “UCI Machine
Learning Repository,” Univ. Calif. Irvine Sch. Inf., vol. 20, no. 8, 2013.
[39] T. Niknam and B. Amiri, “An efficient hybrid approach based on PSO, ACO and k-means for cluster analysis,” Appl. Soft Comput. J., vol. 10, no. 1, pp. 183–197, 2010.
[40] J. S. Lee and S. C. Park, “Document clustering with multi-objective genetic algorithms, NSGA-II and SPEA2,” Inf., vol. 17, no. 3, pp. 1003–1011, 2011. [41] T. N. Reddy, “Optimization of K-Means
Algorithm: Ant Colony Optimization,” in International Conference on Computing Methodologies and Communication (ICCMC), 2017, no. Iccmc, pp. 530–535. [42] J. O’Rourke and G. T. Toussaint, “Pattern
recognition,” in Handbook of Discrete and Computational Geometry, Third Edition, 2017.